11 ( 11.09.1 SMC; 11.01.1; 09.04.1; 13.09.1; 13.09.4 )
W. T. Reach, reach@ipac.caltech.edu
Detection of mid-infrared Aromatic Hydrocarbon Emission Features from the Small Magellanic Cloud ††thanks: Based on observations with the Infrared Space Observatory (ISO). ISO is an ESA project with instruments funded by ESA Member States (especially the PI countries: France, Germany, the Netherlands and the United Kingdom) and with the participation of ISAS and NASA.
Abstract
The mid-infrared (5–16 m) spectral energy distribution for an individual quiescent molecular cloud in the Small Magellanic Cloud (SMC) was observed using ISOCAM. The spectrum is dominated by broad emission bands at 6.2, 7.7, and 11.3 m, with weaker bands at 8.6 and 12.7 m. As these are the same bands, with similar shape and relative strengths, as observed in the ISM of our Galaxy, the same carriers must exist in both galaxies. The carriers are widely consider to be large molecules or clusters of aromatic hydrocarbons, which absorb ultraviolet and visible photons and emit mid-infrared photons during high-temperature pulses. Based on the brightness of the mid-infrared emission and the estimated strength of the radiation field in the SMC, the absorption by aromatic hydrocarbons is of order 10% of total dust absorption, comparable to the case for Galactic dust. Ultraviolet observations of extinction of most SMC stars have shown that dust in the SMC does not absorb in the 2175 Å feature that is so prominent in Milky Way extinction. If aromatic hydrocarbons and featureless extinction curves were ubiquitous in the SMC, then we would conclude that aromatic hydrocarbons are not the carriers of the 2175 Å feature. However, SMC extinction curve measurements are biased toward hot, luminous stars, where aromatic hydrocarbons are destroyed, so that the absence of the 2175 Å bump may not be typical of SMC dust. The presence of aromatic hydrocarbons in the SMC further demonstrate that these molecules exist even in an interstellar medium with an order-of-magnitude lower metallicity than in the disk of the Milky Way.
keywords:
Galaxies: individual: SMC – Galaxies: abundances – Galaxies: irregular – ISM: dust,extinction – Infrared: galaxies – Infrared: interstellar: lines1 Introduction
The Small Magellanic Cloud (SMC) provides a unique environment for studying interstellar matter. The abundance of C, N, O, and heavier elements has been found to be an order of magnitude lower in the SMC than in the disk of the Milky Way ([Dufour et al. 1982]), so heating, cooling, and chemical processes dependent upon metal abundances can be expected to be different from our local interstellar medium (ISM). In particular, the properties of dust in the SMC could be quite different from dust in the Milky Way, because dust is composed almost entirely (by mass) of elements that are substantially less abundant in the SMC. The visible extinction per unit H column density is about an order of magnitude lower in the SMC than in the Milky Way, suggesting that the total dust abundance may scale with the total metal abundance ([Bouchet et al. 1985]). The spectrum of SMC extinction (or the SMC ‘extinction curve’) is significantly different from that of our Galaxy: the SMC has relatively stronger ultraviolet extinction, and it lacks the 2175 Å bump that is so prominent in the Milky Way extinction curve ([Savage & Mathis 1979]).
Infrared emission from the SMC was detected by the Infrared Astronomical Satellite (IRAS), with bright and extended 60 and 100 m emission and weaker emission at 12 and 25 m ([Schwering & Israel 1991], [Sauvage et al. 1990], [Okumura 1993]). The 12 m IRAS image shows very little diffuse emission, being dominated by a few compact regions. The weak 12 m emission from the SMC suggested low-metallicity galaxies may be lacking the aromatic hydrocarbons that dominate the 12m emission from the Milky Way. In this paper, we describe one observation that is part of a larger Infrared Space Observatory (ISO; [Kessler et al. 1996]) Guaranteed Time program designed to characterize the mid-infrared emission from interstellar dust in a wide variety of environments. The cloud SMC B1#1 was selected as an extragalactic target to characterize a quiescent, low-metallicity environment. The cloud was discovered serendipitously during observations as part of the Swedish-ESO Submillimeter Telescope Key Program to map CO-line emission from some star forming regions in the SMC ([Rubio et al. 1993]; [Lequeux et al. 1994]). The cloud is far from any trace of O stars in existing H and radio continuum maps (see Fig. 5 of [Rubio et al. 1993]), and its molecular-line emission is narrow, indicating that the gas is dynamically quiescent. Therefore the dust emission from the cloud is likely excited by a combination of the average SMC radiation field and, possibly, some associated stars. As such, the cloud represents a relatively simple laboratory for studying the properties of SMC dust using its infrared spectrum, away from sites of high-mass star formation.
2 Observations
Our observations were made with the mid-infrared camera, ISOCAM ([Cesarsky, C. et al. 1996]). The telescope was pointed toward J2000 coordinates 00h45m32.5s, -73∘18′46.3′′ on 5 July 1996. We used the 12′′pixel-field-of-view lens, for which only the central of the detector is illuminated. A first spectrum (July 5, 1996) was obtained by rotating the circular-variable filters (CVF) through the range 16.61 to 5.079 m. A second spectrum (2 Oct 1997) was obtained by covering the same wavelengths but rotating the CVFs both forward and backward. During the second observation, we also observed a nearby reference position outside the SMC, at J2000 coordinates 00h45m32.5s, -73∘18′46.3′′, to measure the Milky Way emission in the 10.74–11.79 m range. For all observations, dark current was subtracted from the images using a library dark current image scaled such that it matches the level of the unilluminated edges of our images. The brightness level after dark current subtraction was compared to that expected from an interpolation of the COBE Diffuse Infrared Background Experiment (DIRBE) broad-band observations at 4.9 and 12 m. At low levels of illumination, the ISOCAM detectors exhibit some transient response, and they take time to stabilize to the true sky brightness level. We applied a transient correction algorithm that takes into account the initial rapid rise of the ISOCAM gain and a single exponential rise thereafter. The transient corrections are only about 10% for wavelengths longer than 6 m, because the change in brightness as the CVF rotates is small; but at the shortest wavelengths, the correction increases to 60%, because the sky brightness was decreasing more quickly than the ISOCAM detector could stabilize. The images at each wavelength were corrected for zodiacal light, stray light and vignetting by subtracting a special calibration observation of a blank field, scaled by a model spectrum of the zodiacal light that matches the COBE/DIRBE data for the same position and date (Reach et al. 1996a,b). To complement the CVF observations, we also present here a portion of an image made with the ISOCAM through the LW2 filter (5–8.5 m) on March 13, 1996. This image was reduced using the CAM Interactive Analysis package and aligned to stars in the Palomar Digital Sky Survey.
3 Results
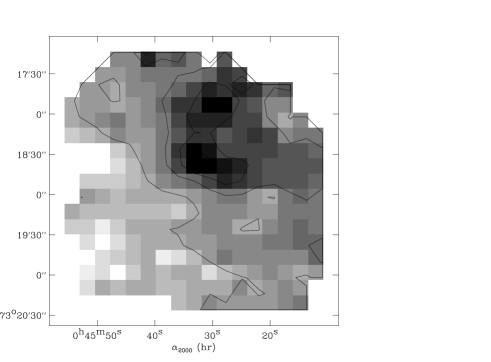
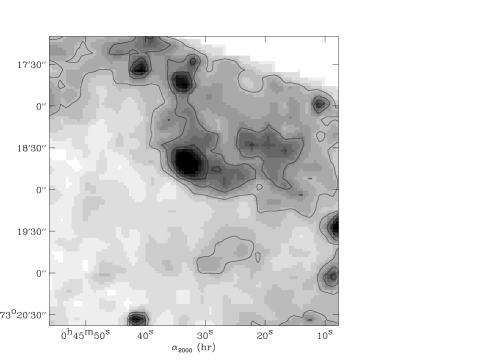


Figure 1a shows an image of the region we observed, in the 11.3 m aromatic hydrocarbon feature. The 11.3 m emission feature comes mostly from the northwest corner of the image. Figure 1b shows an image in the broad LW2 filter (5–8.5 m). The LW2 image shows some diffuse emission that is spatially associated with the emission in the 11.3 m feature, as well as several point sources. The similarity between the wide-band image and the 11.3 m image suggests that they are both tracing the same type of emission.
The diffuse emission in the 11.3 m image is coincident with the molecular cloud SMC B1#1. This cloud has been mapped in the CO(2–1) emission line, revealing a cloud size of 50′′40′′([Rubio et al. 1996]), similar in size and shape to the 11.3 m emission we see with ISOCAM. Figure 2(a) shows the spectrum of the cloud, averaged over the diffuse emission, comparable to the extent of the CO emission, and excluding the embedded source, which is the peak pixel in the CVF image and a point-like source in the LW2 filter image. It is evident that the diffuse emission is dominated by features at 6.2, 7.7, and 11.3 m, corresponding to the brightest of the mid-infrared features that appear in similar spectra of Galactic interstellar clouds (e.g. [Boulanger et al. 1996]). The reasonably good correlation between the diffuse emission in the LW2 image and the 11.3 m feature image is most likely due to the LW2 filter containing the 6.2 and 7.7 m features. Thus Fig. 1(a) shows only emission from one aromatic hydrocarbon feature, while Fig. 1(b) shows a combination of point-like continuum sources and diffuse emission from aromatic hydrocarbon features.
The Milky Way foreground is faint compared to our target SMC B1#1: no aromatic hydrocarbon features (from the Milky Way or the SMC), are detected in the southeast corner of our CVF image, nor in the reference position outside the SMC (Fig. 2). Thus it is evident that the carrier of these features, widely considered to be aromatic hydrocarbons, also exist in the SMC.
The relatively bright point source in the LW2 image, SMC004532.2-731840, has an extremely red spectrum, shown in Fig. 2(b), rising continuously from 5–16 m. The source spectrum is relatively featureless, so it does not appear as a prominent source in the 11.3 m feature image. Using the filter images (with pixels), the point-like source has a flux densities of 23 and 5 mJy in the LW3 (12–18 m) and LW2 (5–8.5 m) filters, respectively. The source’s luminosity in the mid-infrared, integrating over 5–16 m, is L⊙. A possible Galactic analog for this source is an ultracompact H II region: the mid-infrared spectrum is similar to that observed for an ultracompact H II region in M 17 ([Cesarsky, D. et al. 1996]). The source could also be a reflection nebula, but the featureless and extremely red spectrum is completely different from reflection nebulae around Milky Way stars.
4 Discussion
Relation to extinction curve— The SMC is one of the most unusual environments in which to observe aromatic hydrocarbons in abundance because of two well-established facts. First, the metallicity of the SMC is lower than in our Galaxy by a factor of 10, and the C/O ratio is also lower than in our Galaxy, which could affect the abundance of aromatic hydrocarbon molecules, which composed almost entirely of C by mass ([Dufour et al. 1982]). Second, the measured extinction curve of SMC dust is significantly different from that of Galactic dust. In particular, most SMC extinction curves lack the prominent 2175 Å bump so obvious in the Galactic extinction curve ([Savage & Mathis 1979]). This bump is widely attributed to graphitic particles. Clusters of aromatic hydrocarbons may have similar spectral properties to graphite. Because the 2175 Å feature is missing from the SMC, while the aromatic hydrocarbon abundance is high in the SMC, our results suggest that aromatic hydrocarbons are not responsible for the 2175 Å bump in the Milky Way. However, at least one SMC star, Sk 143, has an extinction curve with the same shape as that of the Milky Way, which suggests strong regional variations in the SMC extinction curve ([Lequeux et al. 1982], [and Clayton 1998]). Also, we have only detected the aromatic features from one quiescent cloud, which may or may not be representative of typical SMC material. Therefore, it is possible that we could be comparing the UV-visible extinction and mid-infrared emission for regions with different dust properties. This problem could be eliminated in the future, by observing the extinction curve through the same type of region from which mid-infrared emission in observed. The aromatic hydrocarbons must absorb a substantial fraction (see below) of the interstellar radiation field, but we cannot be sure what photon energy range is exciting them. Observations of reflection nebulae excited by stars with a range of spectral types indicate that aromatic hydrocarbons may not require far-ultraviolet photons for excitation ([Uchida, Sellgren, & Werner 1998]).
| FWHM | |||
|---|---|---|---|
| (MJy sr-1) | (m) | (m) | (nW m-2 sr-1) |
Comparison to Milky Way spectra— The mid-infrared spectrum of the SMC contains features at the same wavelengths as most galactic sources; however, the feature-to-feature ratios are quite distinct for the SMC. The spectrum of the diffuse cloud emission is well fit by a sum of 4 Lorentzians, representing the 6.2, 7.7, 11.3, and 12.6 m features. A Lorentzian shape is a better fit and more physically justified than a Gaussian fit (Boulanger et al. 1998). Other than the wings of the Lorentzians and a broad pedestal under the 11.3 and 12.6 m features, no continuum was detected toward the diffuse cloud (within the uncertainties The relative strengths of the emission features are significantly different from those of Milky Way objects. Compared to the observations of H II regions, reflection nebulae, and diffuse clouds, summarized by Lu (1998), the ratio of (11.3)/(7.7) features is higher in SMCB1#1. Compared to the B-star excited emission from the Oph molecular clouds (Boulanger et al. 1996, 1998), the ratio of (11.3)/(7.7) features is 3 times higher in SMCB1#1. Ionization of polycyclic aromatic hydrocarbon molecules (PAH) enhances the 6–9 m features relative to the 11–14 m features ([Joblin et al. 1996, Allamandola, Hudgins, & Sanford 1999]), a signature that is opposite to our observations for the SMC. If the aromatic hydrocarbons in the Oph region are ionized, then the comparison would suggest that the aromatic hydrocarbons in SMC B1#1 are more neutral. We suggest that another explanation may be more likely. The (11.3)/(7.7) feature ratio is proportional to the fraction of emission arising from C–H bonds as opposed to C–C bonds. The high value of this ratio in the SMC suggests there are relatively more C–H bonds. This seems consistent with the aromatic hydrocarbons forming in a more reducing environment (higher H/C abundance ratio) in the SMC, where the abundance of C in the gas from which the molecules form is a factor of 10 lower than in the Milky Way. If the hydrocarbons in the SMC are indeed more hydrogenated than those in the Milky Way, we predict a relatively bright 3.3 m line from diffuse SMC gas. Our current understanding the nature of interstellar aromatic hydrocarbons is still in its early stages because of the complex inter-relationship between the excitation, chemistry, collisional destruction, and ionization. By providing a new aromatic hydrocarbon spectrum from a unique environment, the observations reported here should help toward disentangling the various processes that shape the aromatic hydrocarbon features and their carriers.
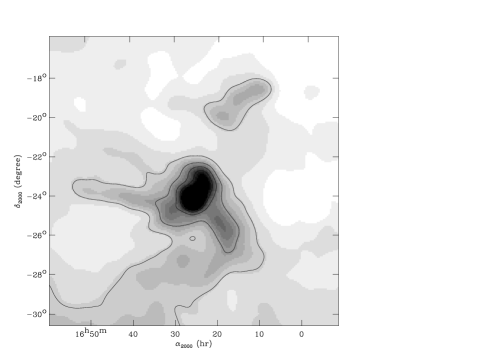
Comparison to Milky Way nebulae— We can put SMC B1#1 into context by comparing it to what known galactic nebulae would look like at the distance of the SMC. To this end, we used the IRAS ISSA ([Wheelock et al. 1994]) to make simulated maps of three galactic complexes: (1) the O-star-excited H II region around the Orion Trapezium, (2) the B-star-excited reflection nebula around Oph, and (3) the star-forming complex in Taurus. The physical sizes of all three nebulae are in the same order of magnitude as SMC B1#1 ( pc). The 12 m surface brightnesses at 1.7 pc physical resolution ( at SMC distance) of the objects are 350, 12, and MJy sr-1, respectively; for comparison, the brightness of SMC B1#1 is about 2 MJy sr-1. It is clear that SMC B1#1 is significantly different from the Trapezium, both because it is much less bright in the mid-infrared, and because it has no associated radio or optical H II region. It is also evident that SMC B1#1 is different from the Taurus clouds, because it is brighter in the mid-infrared. The best Galactic analog for SMC B1#1 is Oph. The smoothed image of Oph, shown in Fig. 3, is comparable to that of SMC B1#1, with one bright point source and diffuse emission on a 10 pc size scale. The point-source in our ISOCAM image of SMC B1#1 could be a reflection nebula, analogous to the bright mid-infrared region in Oph imaged by ISOCAM ([Abergel et al. 1996]), but with a rather different spectrum; or it could be an ultracompact H II region from a highly embedded late-type O star.
Estimated abundance of aromatic hydrocarbons— The abundance of aromatic hydrocarbons in the SMC B1#1 cloud can be roughly estimated from the brightness of the infrared features in the diffuse emission from SMC B1#1, where the dust heating is due to the diffuse SMC interstellar radiation field. The total energy absorbed by a completely dark cloud is the integrated energy from the incident interstellar radiation field. The fraction of the radiation field that is absorbed by aromatic hydrocarbons can be calculated from the observed infrared brightness as
where is the intensity of the observed aromatic hydrocarbon features, is the fraction of all aromatic hydrocarbon emission that comes out in the observed features, and is the intensity of the ultraviolet Solar Neighborhood radiation field ([Mathis, Mezger, & Panagia 1983]). In practice, the value of obtained from this equation is a lower limit, because the cloud surface may not be completely dark and may not fill the beam uniformly. The radiation field of the observed cloud is , in units of . Adding together the 1620 Å fluxes of the stars in the H II regions seen with the UIT ([Cornett et al. 1997]), and including the estimated fluxes of the H II regions DEM 21, 28 and 16 based on their H brightness, we estimate that the radiation field at the location of SMC B1#1 has , with an uncertainty of about a factor of 2. If the exciting star of the point-like reflection nebula in SMC B1#1 is a B3 or later star, its flux would exceed that of the radiation field only within pc of the star (or less, if extinction were included), consistent with the unresolved source in our image but of little or no importance for the diffuse emission. The ISOCAM wavelength range includes essentially all of the aromatic hydrocarbon emission, so , although it is possible that we miss some emission in a quasi-continuum under the features or outside of our observed wavelength range. Using the sum of the feature brightness from Table 1, we find .
To estimate directly the energy emitted by large dust grains in the SMC, we use archival ISOPHOT ([Lemke et al. 1996]) observations. An image of the SMC-B1 region, covering including the region of our ISOCAM observation, was made at 135 m wavelength with the C2 detectors. The far-infrared emission is faint at the location of our ISOCAM image, with no evidence of a far-infrared peak corresponding to the mid-infrared peak. There is some far-infrared emission extending north of our target region, suggesting that SMC B1#1 is a clump at the southern edge of a large, cold cloud. The far-infrared surface brightness at the location of our mid-infrared peak SMC B1#1 is MJy sr-1, measured with respect to nearby dark pixels in the ISOPHOT image. If the far-infrared spectrum is typical of large dust grains in the Milky Way ([Boulanger, et al. 1988], [Dwek et al. 1997]), then the integrated far-infrared emission is 2 times brighter than at 135 m, so the far-infrared surface brightness of our cloud is nW m-2 sr-1. Comparing to the sum of the aromatic hydrocarbon feature brightnesses in Table 1, the relative amount of energy absorbed by aromatic hydrocarbon as compared to big grains is . This is comparable to the fraction of energy absorbed by aromatic hydrocarbons in our Galaxy ([Dwek et al. 1997]). It is also consistent with our abundance estimate in the previous paragraph.
5 Conclusions
Using ISOCAM observations of a molecular cloud in the SMC, we found that the mid-infrared emission of its low-metallicity interstellar medium is dominated by broad aromatic hydrocarbon features at 6.2, 7.7, 8.6, 11.3, and 12.7 m. The locations of the features are similar to those found in the Milky Way interstellar medium, but the brightness ratios among the features are different. The 11.3 m feature is relatively brighter in the SMC, suggesting relatively more emission from C–H bonds compared to C–C bonds, which we can explain as a difference in the aromatic hydrocarbons forming in a lower metallicity (higher H/C abundance ratio) environment in the SMC. The abundance of aromatic hydrocarbons, relative to the dust that makes the rest of the absorption, is similar in the SMC B1#1 cloud and typical Milky Way dark clouds. While the properties, and the total abundance, of dust in the SMC and Milky Way differ significantly, the aromatic hydrocarbons and larger grains are likely to play similar roles in the interstellar media of the two galaxies.
Previous studies of the mid-infrared emission from SMC suggested that its dust lacks the 2175 Å feature and may be deficient in aromatic hydrocarbons. These effects may both be due to the fact that massive star forming regions dominate the infrared emission and provide the beacons toward which extinction curves are measured. Aromatic hydrocarbons are destroyed in such high-radiation environments ([Ryter, Puget and Perault 1987]). Our results suggest that aromatic hydrocarbons exist in the SMC with an abundance (relative to that of large grains) comparable to that in the Milky Way. These results probably apply to other low-metallicity and high-redshift galaxies.
Acknowledgements.
We thank Nanyao Lu for his help in processing and understanding the ISOPHOT observations that were used in this paper.References
- [Abergel et al. 1996] Abergel, A. et al. 1996, A& A, 315, L329
- [Allamandola, Hudgins, & Sanford 1999] Allamandola, L. J., Hudgins, D. M., & Sanford, S. A. 1999, ApJL, 411, L115
- [Arendt et al. 1998] Arendt, R. G., et al. 1998, ApJ, 508, 74
- [Bouchet et al. 1985] Bouchet, P., Lequeux, J., Maurice, E., Prévot, L., Prévot-Burnichon, M. L. 1985, A&A, 149, 330
- [Boulanger, et al. 1988] Boulanger, F., Beichman, C., Desert, F. X., Helou, G., Perault, M. and Ryter, C. 1988, ApJ, 332, 328
- [Boulanger et al. 1996] Boulanger, F. et al. 1996, A&A, 315, L325
- [Boulanger et al. 1998] Boulanger, F., Boissel, P., Cesarsky, D., & Ryter, C. 1998, A&A, 339, 194
- [Cesarsky, C. et al. 1996] Cesarsky, C. et al. 1996, A&A, 315, 32
- [Cesarsky, D. et al. 1996] Cesarsky, D., Lequeux, J., Abergel, A., Perault, M., Palazzi, E., Madden, S., & Tran, D. 1996, A&A, 315, L309
- [Cleary, Haslam, & Heiles 1979] Cleary, M. N., Haslam, C. G. T., & Heiles, C. 1979, A& AS, 36, 95
- [Contursi et al. 1998] Contursi, A., et al. 1998, A& A, 336, 662
- [Cornett et al. 1997] Cornett et. al 1997, AJ 113, 1011
- [Dwek et al. 1997] Dwek, E., et al. 1997, ApJ, 475, 565
- [Dufour et al. 1982] Dufour, R. J., Shields, G. A., Talbot, R. J. 1982, ApJ, 252, 461
- [ and Clayton 1998] Gordon, K. A., & Clayton, G. C. 1998, ApJ, 500, 816
- [Israel et al. 1993] Israel, F. P. et al. 1993, A&A, 276, 25
- [Joblin et al. 1996] Joblin, C., Tielens, A. G. G. M., Geballe, T. R., & Wooden, D. H. 1996, ApJL, 460, L119
- [Kessler et al. 1996] Kessler, M. et al. 1996, A&A, 315, 27
- [Lemke et al. 1996] Lemke, D., et al. 1996, A& A, 315, L64
- [Lequeux et al. 1994] Lequeux, J., Le Bourlot, J., Pineau des Forêts, G., Roueff, E., Boulanger, F., Rubio, M. 1994, A&A, 292, 371
- [Lequeux et al. 1982] Lequeux, J., Maurice, E., Pr/’evot-Burnichon, M.-L., Prévot, L., & Rocca-Volmerange, B. 1982, A& A, 113, L15
- [Lu 1998] Lu, N. 1998, ApJL, 498, L65
- [Mathis, Mezger, & Panagia 1983] Mathis, J. S., Mezger, P. M., Panagia, N. 1983, A&A, 128, 212
- [Okumura 1993] Okumura, K. 1993, Ph. D. Thesis, Université Paris Sud
- [Reach et al. 1996a] Reach, W. T. et al. 1996a, in Unveiling the Cosmic Infrared Background, ed. E. Dwek (AIP: New York), p. 37
- [Reach et al. 1996b] Reach, W. T. et al. 1996b, A&A, 315, L381
- [Rubio et al. 1993] Rubio, M. et al. 1993, A&A, 271, 1
- [Rubio et al. 1996] Rubio, M. et al. 1996, A&AS, 118, 263
- [Ryter, Puget and Perault 1987] Ryter, C., Puget, J. L. and Perault, M. 1987, A& A, 186, 312
- [Sauvage et al. 1990] Sauvage, M., Thuan, T. X., & Vigroux, L. 1990, A&A, 237, 296
- [Savage & Mathis 1979] Savage, B. D., & Mathis, J. S. 1979, ARA& A, 17, 73
- [Schwering & Israel 1991] Schwering, P. B. W., & Israel, F. P. 1991, A& A, 246, 231
- [Uchida, Sellgren, & Werner 1998] Uchida, K. I., Sellgren, K., & Werner, M. 1998, ApJ, 493, L109
- [Wheelock et al. 1994] Wheelock S. L., Gautier, T. N., Chillemi, J., Kester, D., McCallon, H., Oken, C., White, J., Gregorich, D., Boulanger, F., and J. Good 1994, IRAS Sky Survey Atlas: Explanatory Supplement. (JPL/Caltech: Pasadena)