The emission nebula associated with V1974 Cyg: a unique object?
Through a program of narrow band imaging, we have observed the changing structure of the H emission line around Nova Cyg 1992 (V1974 Cyg) at regular intervals from 1996 to 1999. Between 1994 and 1996, the nebular boundary advanced to the southwest at nearly the speed of light, implying that the nebula was created by an expanding wave of radiation originating in the explosion interacting with surrounding material. The expansion speed dropped to 0.35 during 1996-1999. We have taken spectra of the nebula in 1998 and 1999. Only Balmer lines are detected, no He I, [O III], [O II], [N II], or [S II]. There is also no trace of the high excitation nova lines (He II, NeV, etc). The Balmer lines are unresolved in velocity (FWHM100 km s-1). These spectra show that the nebula is not a reflection nebula, a conventional H II region, or a shock involving motions of the gas. The integrated H luminosity of the nebula between 1996 and 1999 is in the range 1.3-2.2 1035 erg s-1.
The Balmer decrement is normal for recombinations of a lightly reddened plasma. The lack of forbidden emission lines can only be understood if the electron temperature is low. This condition results if the energies of the ejected photoelectrons are shared among electrons, protons, and neutrals in a partially ionized medium. The He I lines are suppressed if the flash ionizing spectrum is truncated at or below the He0 ionization edge. The ionized material is on the front face of neutral sheets. The density is poorly determined, but is probably very large ( cm-3) in order to explain the brightest region of the nebula. The dynamical timescale is about a year and the recombination timescale of the same order. Bright patches are observed to fade in these times. The energy required to ionize the nebula is the bolometric luminosity of the nova for 30 days, smaller than the time during which the temperature of the nova photosphere was in the right range to produce the ionizing photons.
We have also undertaken sensitive surveys of H nebulae around recent novae but find no evidence of other such nebulae, so this type of object must be rare.
Key Words.:
Stars: novae, cataclysmic variables – ISM: jets and outflows1 Introduction
Nova Cyg 1992 (V1974 Cyg) erupted in February 1992 and was the brightest nova in the 24 years between V1500 Cyg 1975 and Nova Velorum 1999. It has been the object of detailed and frequent observations in all wavelengths from radio to gamma rays. It reached visual maximum V=4.4 on February 22.5 (Rafanelli et al. 1995). The lightcurve was characterized by time of decay by 2 magnitudes t2=25 d (Kolotilov et al. 1994) which implies, according to the maximum magnitude vs. rate of decline relationship (Della Valle and Livio 1995), an absolute magnitude at maximum of . Color excesses in the range from (Rosino et al. 1996) to 0.35 (Paresce et al. 1995) give distances in the interval kpc (see also Chochol et al. 1993). We adopt hereafter d = 1.8 kpc. Immediately following the outburst, the photosphere was at an effective temperature 20000 K (see Hauschildt et al. 1994). Then the photosphere shrunk at constant bolometric luminosity while the ejecta were gradually becoming ionized. The effective temperature reached 300000 K 252 days after the outburst and a maximum T590000 K at day 511 (Balman et al. 1998). At this point the effective temperature rapidly decreased to T 380000 K at day 612, and it was again as low as T 20000 K after two more years (Shore et al. 1996). Not every nova appears as a supersoft X-ray source after the outburst (the reason is not quite clear). N Cyg belongs to the few novae in which the very hot central star emerged at some point (see Orio et al. 2000).
A nova outburst, specially one followed by a supersoft X-ray phase, can cause an expanding reflection nebula, or its ionizing radiation can ionize the surrounding interstellar medium (ISM), including cold, neutral remnants of former outbursts. This paper deals with the first spectral and temporal observations of a transient extended nebula surrounding a post-nova and its ejected shell. We still do not know how common transient nebulae around classical novae might be. The technical capabilities of modern instruments and telescopes (fields of view of at least several arcminutes, with good sensitivity) prompted us to start a search for nebulae around known nova remnants. We were interested both in reflection and ionization nebulae.
Only one transient nebula is surely known to have been associated with a nova: the first superluminal astrophysical object, GK Per. This was a reflection nebula (another reflection nebula is suspected to have been around N Sgr 1936 for some time, Swope 1940). The spectacular GK Per nebula was discovered at Yerkes Observatory in Wisconsin in 1901 (Ritchey 1901), six months after the nova outburst. Partial rings of reflected light centered around the nova appeared at a maximum angular distance of about 6 from the nova, corresponding to approximately 3 pc. These features were seen moving outwards from the nova at the apparent speed of 11 per year. Later, when the distance to the nova was known, it was understood to imply an amazing expansion velocity of 4.7. The fascinating story of the light echoes of GK Per, so much resembling those of SN 1987a, and how difficult they were to understand, can be found in popular science article by Felten (1991) summarizing early observations and discussions by Ritchey (1901 and 1902) Perrine (1901a, 1901b, 1903) and others, and the controversial issues they raised. The case of GK Per remained unique among explosive variables until it was reproduced in the light echo of SN 1987a.
For novae appearing as hot supersoft X-ray sources in X-ray telescopes, one might expect an extended ionization nebula. The discovery of a ionization nebula would let us understand better the history of the system and the presence and composition of remnant material from previous outbursts. One such nebula, around CAL 83, has been detected (Pakull & Motch 1989; Remillard et al. 1995), and the physics is described by Rappaport et al. (1994). However, these models are not applicable to classical novae because of the timescales involved. Novae seem to turn into transient supersoft X-ray sources lasting only for few years, rather than into steady sources like CAL 83 (see Orio et al. 2000 and references therein).
The chances to find nebulae around novae in the past were slim due to the low sensitivities of the instruments and of the photographic plates. Later, the odds reduced again because the use of small format CCDs was preferred to photographic plates that have much larger fields of view. The last systematic search for novae nebulae we are aware of was done by van den Bergh (1977) with negative results. Therefore we still do not know how common transient nebulae around classical novae might be. V1974 Cyg, as a known supersoft X-ray source, was the ideal candidate to start our search.
2 The discovery of the nebula through imaging
The nebula was discovered almost simultaneously by two groups in which the coauthors of this paper were taking part, both through spectroscopy and through imaging. An extended nebulosity was discovered scanning spectra taken in 1994-1995 perpendicular to the direction of dispersion in the H line (Rosino et al. 1996). The diameter of the upper boundary of the emission region was about 3.00.2 in July 1994, 3.50.1 in May and 3.950.1 in October 1995. Since this angular velocity of expansion is consistent with the speed of light at the estimated nova distance, Rosino et al. (1996) suggested that the nebula was due to ISM excited by the ultraviolet radiation emitted shortly after the February 1992 outburst. The nebula after the initial heating was roughly symmetric.
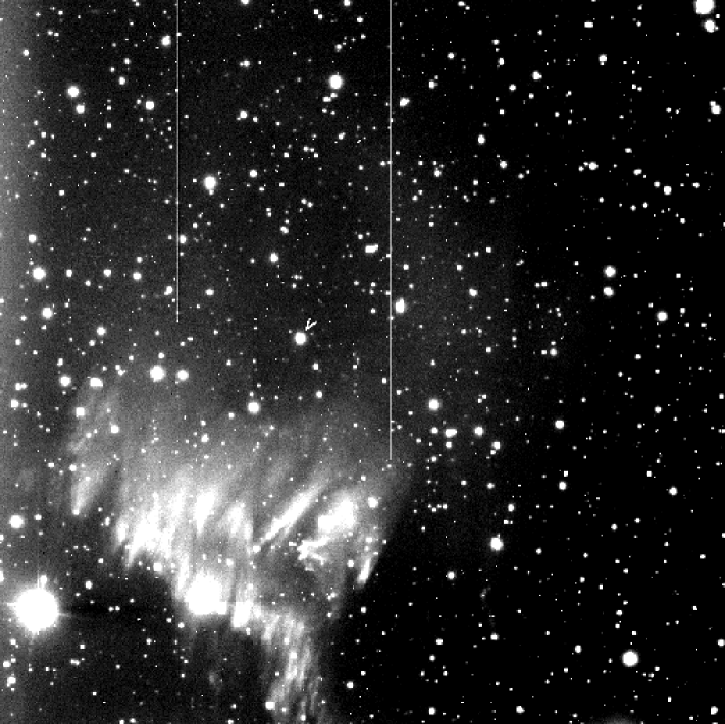
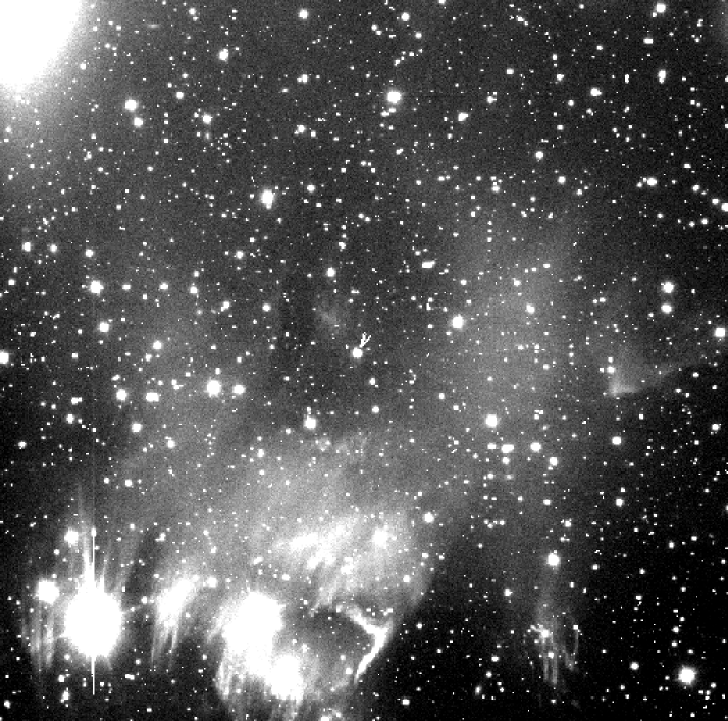
In 1996 the nebula was imaged using the WIYN telescope111The WIYN Observatory is joint facility of the University of Wisconsin-Madison, Indiana University, Yale University, and the National Optical Astronomy Observatories. at Kitt Peak equipped with 6.8 field CCD camera. The WIYN is a 3.5m f/6.5 telescope with an effective diameter of 3.2m (because of obstruction by the secondary mirror). On 27 May 1996 a diffuse emission was detected in narrow band H around V1974. This emission appeared to extend 125 north, 190 south, 140 west and 142 east (Balman et al. 1996; see also Fig. 1). The nebula did not appear to be filled but to have an elliptical cavity extending 100 north, 21 south, 35 west, and 38 east. The H luminosity of the nebula had a peak in the southwest with what Balman et al. (1997) described as long, thin, chevron like filamentary structures (like in the latter image in Fig. 1). We also imaged the nebula with an [O III] ( 5008) narrowband filter and did not detect any nebulosity, with an upper limit to the flux 10-13 erg cm-2 sH.
On 16 June 1996, the H nebula showed no substantial changes; the narrowband H luminosity of the nebula in this second observation was 2-3 times that of the nova, which also showed a shell diameter of 0.8 with an extension to the northwest. Very precise determinations of the flux for the images of May and June 1996 were not possible because the CCD was found to be non-linear at low levels. However, in Table 1 we give an estimate for May 1997 which should be correct to within 15%. The method of measuring the flux is discussed in detail in the next section. At a distance 1.8 kpc (see Introduction), the size of the nebula implied that the bright region had extended at a significant fraction of the speed of light at the outburst. The rapid extension indicated a nebula soon after “turn on” of the ionizing source, differing greatly from the nebula discovered around CAL 83 (Remillard et al. 1995).
Since 1995, the nebula seemed to have extended more towards South by May-June 1996 and to have lost its almost spherical symmetry. The expansion in direction South-West continued in the following years of our monitoring (see Fig. 2). The expansion southwards must have been 37 between October 1995 and May 1996, approximately consistent with the rate of expansion in 1994-1995.
The nova was monitored with the WIYN telescope from 1996 through the end of 1999. Additional and complementary observations were performed in 1997-1998 with the 1m REOSC reflector at the Turin Observatory in Italy, using an 11 field CCD camera. Meanwhile, Garnavich & Raymond (1997) found that between October 1996 and May 1997 the brightest emission region, about 2 southwest of the nova, appeared displaced by 10 to the southwest while another feature appeared to have shifted in southeast direction by 30 over a 200-day interval, consistently with a speed 0.5 assuming a distance 1.8 kpc.
| DATE | Flux (erg cm-2 s-1) |
|---|---|
| May 1997 | 4.56 |
| July 1998 | 3.83 |
| July 1999 | 3.37 |
| November 1999 | 5.7 |
3 Flux estimates and astrometry
We observed the nova shell in H (and in the R filter for comparison) with the WIYN telescope and a linear CCD camera on 16 November 1996, 1 June 1997, 8 August 1997, 15 July 1998, 18 and 19 August 1998, 18 July 1999, 8 and 9 November 1999. Fig. 1 shows the H nebula detected in July 1998. The field of view of these images is 6.8 arcmin. On 15 September 1997 and 23 December 1997 we obtained additional large scale images (11 arcmin field of view) with a CCD camera and the 1m REOSC reflector at the the Torino Observatory. The REOSC images did not provide a S/N ratio good enough to estimate the flux, but their large size allowed us to choose the boundaries of the emission features for the flux integration. At the WIYN telescope we imaged the nova field also with the [S II] filter (centered around 6718 Å) in August 1997, and did not detect any emission. The upper limit is about 0.001 times the measured H intensity.
We calibrated and analyzed the images using the IRAF software. The main problem was separating the contributions of the nebulosity from the background and stellar light. To remove the latter, a PSF fitting and subtraction was applied, with excellent results on non-saturated stars. The flux of saturated or non-subtracted stars was then subtracted, setting an upper threshold for the average intensity of the nebula pixels. The background was measured in sky zones of the images that are far from the nebulosity. To determine the borders of the nebula, we measured the gradient of the intensity in 10 x 10 pixel windows, and defined the boundary as the loci of pixels which had the mean intensity in the window with the largest gradient.
The nebulosity might extend to a larger area than the boundaries we have defined. However, the intensity in these regions is very low compared to that measured inside the area chosen for the integration. We estimate that no more than 10% of flux is excluded. We computed the total flux by setting a lower threshold based on the gradient and a higher threshold based on saturation limits, and then counting the total number of pixels that were spatially within the borders. Because of the flux in the very low S/N area as well as other unavoidable uncertainties, the measurements in Table 1 can be considered lower limits, while the total flux might be up to 20% higher.
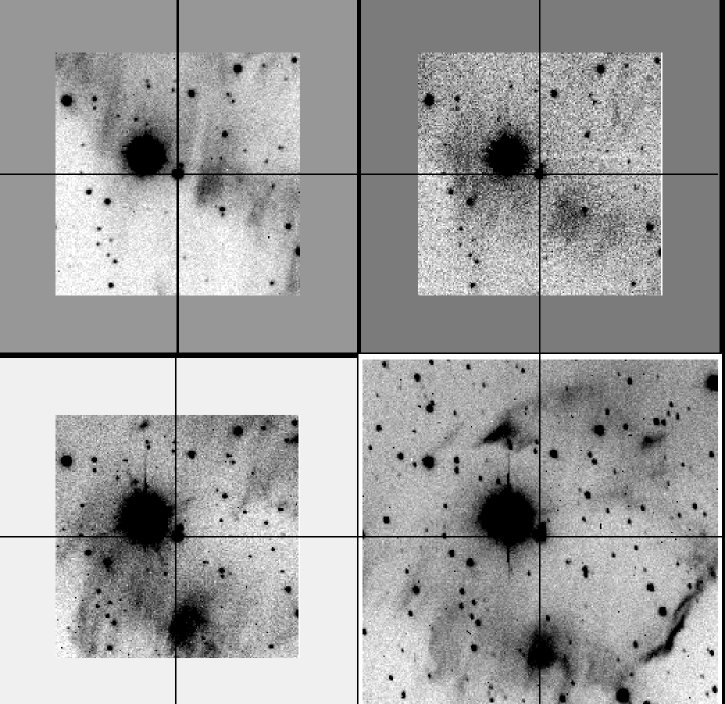
Fig. 2 shows the comparison between the bright knots in the South-West boundary of the nebula images at different epochs. We give integrated fluxes at the different epochs in Table 1.

We obtained astrometric information on the clearly visible knot south of the nebula and on the boundary itself, defined as before. The position of the area in the knot with maximum counts (averaged on a 10x10 pixel box) was measured. The boundary was fitted with a straight line. The reference frame was set using three stars (whose centers were determined with a gaussian fitting). Fig. 2 shows positions of the nebular front in June 1996 (upper left), June 1997 (upper right), August 1998 (lower left) and July 1999 (lower right). The positions of the nebular boundary and of the knot give the same speed. Fig. 3 is a plot of the displacement against time. It shows that the motion was almost constant (0.034/day) over three years, which projects to 0.35 at an assumed distance of 1.8 kpc. This contrasts with the rate of expansion (c) found by Rosino et al. (1996) that most likely continued between December 1995 and our first observations in May 1996.
4 Spectroscopy of the nebula
In November 1998 we took three sets of 90 spectra of the bright knot shown in Fig. 2 and 25 loci northwards and southwards of it. We used the Hydra multi-fiber positioner with a bench spectrograph and the DensePak fiber optic bundles at the WIYN telescope. The bundles scanned an area extending about 35. Because of difficulties in the absolute calibration of each individual fiber, we cannot be precise about the relative intensities of the lines, but there is little variation in them. The various spectra differ in flux. The line widths in the nebula are FWHM 5.9 Å, perhaps slightly larger than those of the night sky (FWHM 5.4 Å), implying an upper limit of thermal FWHM of 100 km s-1.
A year later, on October 2, 1999, a spectrum of the region around Nova Cyg 1992 was taken with the RC spectrograph on the Kitt Peak National Observatory 4m telescope. The KPC-10A grating was used with a 4000 Å width, 2 x 300 slit with 7 Å resolution. The useful spectral range is from about 3700 to 7500 Å. Two 750 s spectra were taken. Their sum is shown in Fig. 4.
Because spectral features of the nova are located across the entire slit, we used a scaled spectrum of another object to remove sky features. We then extracted the spectrum, wavelength calibrated it with an FeAr comparison spectrum, and flux calibrated with the star BD+28 4211. Since we are unable to do an exact sky subtraction, the absolute calibration is only approximately correct, but the relative fluxes between the hydrogen emission lines are secure. The line flux ratios derived are 4.3 for H/H and 2.1 for H/H. If these lines are produced by recombinations, as we believe them to be, these ratios imply an interstellar extinction of = 0.8, which is reasonable.
As already noted by Garnavich & Raymond (1997), the nebular spectra shows only the Balmer lines series, with no other lines present, in both our observations taken with the WIYN Densepak fiber array in November 1998 and in the long slit 4-m spectrum from Sept 1999. The ratio [N II](6583)/H 0.03 (3 ). For comparison, its value is 0.14 in the Orion Nebula (Esteban et al. 1998), 0.18 in M 17(Esteban et al. 1999), and 0.4 in the brightest diffuse galactic emission (Haffner et al. 1999). The upper limit to He I 5876/H is 0.03 (3 ). The spectrum is completely different from that of the nova itself at any stage in its history. The nova had a strong continuum in its early stages and strong, broad permitted lines of H I, N II, N III, and Fe I in its early stages (Rafanelli et al. 1995) and forbidden lines of [O III], [Ne III], [Ne V], and He II later (Rosino et al. 1996). Therefore, the reflection nebula hypothesis can be ruled out.
Some parts of the nebula definitely faded with time. An obvious example is the patch just to the right and below the reference star in Fig. 2. It was bright in the first frame (July 1996) and had disappeared by the last (July 1999). The production of a spectrum that lacks forbidden lines, and especially collisionally excited emission from low ionization potential species such as S+ (IP10.36 eV), requires most unusual conditions in the nebula.

5 Geometry of the nebula
If there were a uniform spatial distribution of interstellar material surrounding the nova, we would see the portion of the nebula that is ionized by the flash to be expanding at speed . However, we have shown that in 1996 – 1998 bright regions appeared as the wave swept past them with an apparent rate of expansion of 0.35. This indicates that dense material of the ISM, which appears brighter than the surrounding tenuous gas after illumination, is not uniformly distributed in space. There is a sheet of dense material inclined to the line of sight such that the projected speed of the illuminated region is reduced. There is so little absorbing material between the sheet and the nova that the pulse of radiation reaches it with considerable intensity.
We can determine the distance from the star of newly illuminated material by using its angular displacement and the time delay of the arrival of its radiation. The apparent rate of expansion of the boundary gives the difference in distances along the boundary, or equivalently the angle of the boundary relative to the line of sight or to the nova.
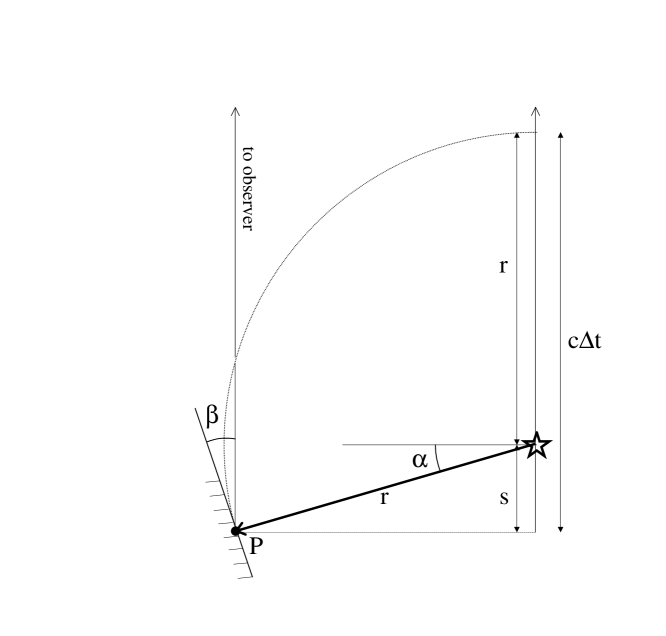
The geometry is shown in Figure 5. The observer is assumed to be at distance vertically upwards in the figure. Consider the point at the edge of the nebula, which begins to emit its radiation when the pulse of ionizing radiation from the nova arrives. The intensity along the line of sight to increases abruptly when the ionizing flash reaches . Let be the time interval between the arrivals of the light to us from the nova and from (this is not the same as the time since the explosion, since is not at the same distance as the nova). The distance of from the nova is and its projection along the line of sight is . Then we have
| (1) |
where .
Consider the bright knot with = 3.1 in July 1998, 6.4 years after the explosion. Then = 6.4 light years (ly) and = 5.3 ly, yielding = ly, ly, and . Thus, the knot is almost the same distance as the nova. The errors in and are based on the uncertainties in and . The uncertainty of arises from guessing when the ionizing pulse broke out of the nova’s shell, relative to the beginning of the brightening of the star. Another contribution is the length of the ionizing pulse, since the knot integrates the incident ionizing radiation over time. The uncertainty of arises from the error in , which is . Our guess at the spatial thickness of the wave of ionizing photons is 3 light months, and that the flash was emitted relatively soon after the outburst. The justifications of these assumptions will be given in Section 7.2.
The rate of expansion of the bright edge of the nebula provides an estimate of the tilt of the edge with respect to the line of sight. We have a diagram very similar to Fig. 5, but considering two points and the difference in time of arrival of their radiation. Let be the angle of their separation (i.e., of the leading edge of the knot) relative to the line of sight, measured away from the direction of the nova. Then some geometry yields in terms of the rate of expansion of the nebula:
| (2) |
With = 0.35, the expansion speed of the nebula, .
6 Search for other nebulae
We searched for H emission in the fields of other recent and old novae. We chose a sample that were bright in outburst and are still relatively bright at quiescence, and which exploded at very different epochs. We included two recurrent novae. We observed Novae V603 Aql 1918, DK Lac 1950, HR Del 1967, QU Vul 1984, Sgr 1993, Cas 1993 and 1995 and the recurrent nova RS Oph with the R and H filters with the WIYN telescope. The field of view was 6.8. In all cases we set upper limits on the order few times 10-18 erg cm-2 s-1 arcsec-2 for the H intensity. With the 1m REOSC reflector at the Torino Observatory we observed 11 radius fields around Novae V1500 Cyg 1975, CT Ser 1948, U Leo 1855, and the recurrent nova T Cr Bor. In this case, the upper limits on the H flux were two orders of magnitude higher. While the results of this survey will be presented more in detail in a forthcoming paper, we want to stress that the nebula around N Cyg 1992 must be a rare phenomenon and the product of special conditions.
7 Explaining the spectrum
Our spectra of the nebula show only Balmer recombination lines. It is almost impossible to believe that the bright material is poor in heavy elements relative to the ISM in general. If anything, previous nova outbursts from the system should have slightly enriched the circumstellar medium. The lack of the collisionally excited lines in the spectrum can be understood in two ways:
(a) The nebula has been photoionized by Lyman continuum radiation from the nova, similar to ordinary H II regions except that the excitation is much lower and the nebula is not in a steady state. In this case, , the electron temperature in the ionized nebula, must be relatively low (3300 K), thereby suppressing the collisional forbidden lines and increasing the emissivity of the Balmer lines.
(b) Perhaps the nova released a flood of Lyman line emission that impinged upon the neutral nebular cloud. In this case, the Balmer lines are produced by fluorescence following absorption and subsequent cascades of the Lyman line photons.
We consider the Lyman-line fluorescence scenario very unlikely. The observed Balmer decrement is remarkably like recombination with a modest and plausible amount of interstellar reddening ( 0.8 mag). By contrast, it seems difficult to produce this spectrum with Lyman lines incident from the outside of a slab. The Lyman decrement would heavily favor Ly over Ly and higher members of the series because of the scattering of the lines in both the nova shell emitting them and in the cold nebula absorbing them. Following each scattering there are conversions into Ly and a Paschen photon. This process is why “Case B”, in which the Lyman lines are all converted into Ly plus members of higher series, is adopted in almost all standard nebular analyses.222In the case we consider, Ly is not relevant because it cannot produce a Balmer line following its absorption. Another difficulty with this scenario would be that it is difficult to suppress the Lyman continuum radiation from the nova shell if the Lyman lines escape readily. The escaping Lyman continuum would ionize and heat the nebula in exactly the way we suggest in the recombination scenario outlined above. Still another problem is that the absorption of the Lyman lines would be very inefficient because the width of the nova lines would be 2100 km s-1 (Rafanelli et al. 1995) in the early stages and 1600 km s-1 somewhat later. By contrast, the absorption lines in the neutral material are observed to be relatively narrow (FWHM 100 km s-1. They probably have a thermal plus turbulent width of 10 – 20 km s-1, typical for the ISM. Thus, the absorption of Lyman lines by the neutral material would be very inefficient. Each Lyman line requires almost as much energy as a Lyman continuum photon, so this inefficiency greatly increases the energy required from the nova. Lyman continuum photons produce narrow recombination lines regardless of the velocity spread of the continuum source.
7.1 Physics of flash ionization
The very strange spectrum of the nebula – Balmer emission lines, together with the absence of forbidden lines – requires very unusual conditions. The forbidden lines cannot be wholly suppressed by de-exciting collisions without encountering physical inconsistencies. The brightest forbidden line expected is [N II]6563. Its “critical density”, at which the rates of collisional and radiative de-excitations from the upper level are equal, is cm-3. Suppressing it below its observed upper limit requires 10 times this density if = 5000 K and 200 times at = 10000 K. At these densities, recombination of H would take place within 40 days for = 5000 K. In order to suppress the forbidden lines, we require two conditions: (a) a rather soft ionizing spectrum, and (b) a substantial fraction of neutral H atoms mixed with the ionized.
When the ionizing radiation impinges upon the cold neutral nebula, it creates photoelectrons that collide with their neighboring electrons, protons, and neutral atoms, with timescales decreasing in that order. The collisional processes are discussed in Spitzer (1978). All such times are short: minutes to a few days; the slowest is the exchange between H+ and H0. Thus, there will be only one temperature shared by all particles.
The incident ionizing radiation must be relatively soft so that the ejected photoelectrons do not have excessively large energies after ionizing the H0. We envision the incident radiation to be distributed between the ionization edges of H (13.6 eV) and of He0 (24.6 eV), or possibly of Ne0 (= 21.6 eV). The softness of the incident spectrum is shown by the observed absence of any He I recombination lines in the spectrum, indicating that He is much less ionized than H. Presumably, photons at higher energies were absorbed by the large amounts of Ne, He, and O that were present in the ejecta, preventing the escape of their ionizing radiation.
7.2 A partially ionized nebula
In a highly ionized nebula, the photoionization heating from the ionizations will be shared between only the ions and electrons. If the ionizing spectrum extends up to even 22 eV, a fairly low threshold, the nebula will be hot and the usual optical forbidden lines will be strong. For instance, if the mean energy of an ionizing photon is 18 eV (as for a uniform photon intensity between 13.6 and 22 eV), the mean kinetic energy of each particle, including He0 but neglecting H0, is 2.0 eV, and K. The [N II] and [S II] would be comparable to H. Lowering [N II]6583/H to 0.030, 3 above the observed limit, requires 3300 K.
We must appeal to partial ionization of the nebula. The low can be achieved by having H0 atoms share the deposited energy. He0 is far from sufficient to provide these neutrals. The required fraction of H+, , depends rather sensitively on , the mean energy of the ionizing photons, because the mean photoelectron energy is ( eV). If = 18 eV, ; if = 16 eV, because fewer neutrals are needed to share the energy.
The low level of ionization can be achieved when a burst of ionizing radiation impinges on dense neutral material. Since the photoionization cross section , the harder radiation penetrates more deeply into the neutral gas and deposits the more energetic photoelectrons into regions with more neutrals to share their energy. With sufficient neutral density, the ionization fraction can be made low enough to avoid high temperatures.
The electron (or H+) density is poorly known. The mean H intensity of erg cm-2 s-1 sr-1 within the bright knot of emission 30 across shown near the bottom of the lowest frames in Fig. 2. This translates to an emission measure of cm-6 pc, or 120 cm-3 in the ionized part of the sheet.
We feel that 120 cm-3 is a severe lower limit. Let us calculate how many surfaces of ionized material would be required to provide the observed average intensity of H within the bright patch. The thickness, , of the ionized region normal to the radius to the nova (not along the line of sight) is , where is the absorption cross section of H averaged over the ionizing spectrum. For 18 eV, this gives L = 3.4/n() , cm, subtending only 0.12 at 1800 pc if = 100 cm-3. Our spectra and images might contain the emission from many unresolved surfaces, as is suggested by the rippled structure in the nebula seen in Fig. 1 and 2. The H intensity normal to each nebular surface is , where is the emissivity of H. Each surface produces an emission measure of cm-6 pc in the direction normal to it, where is the total H density. We have estimated above that in order to provide the low temperature. If cm-3, so that 100 cm-3, we would require sheets of emitting material to provide the observed H along the line of sight! If we assume that no more than a few surfaces are pierced, say 20 ripples each pierced twice, the becomes cm-3. This large density, needed to explain the highest surface brightness, has only a very marginal effect on [N II].
Interstellar extinction is not a barrier to seeing through several folded sheets of material. The absorption cross section of H0 at the Lyman edge is times the extinction cross section at . The nebular sheets can have very a low optical depth to dust at all wavelengths.
Let us consider cooling following the deposition of the kinetic energy of the photoelectrons into the gas. Dynamical effects have a timescale, , of ( is the adiabatic speed of sound) = years at 3300 K. At the very large densities we estimated above, year. In this case, part of the cooling will arise from the expansion of the newly ionized matter and part from radiation. The main contributions to the radiative cooling are from free-free emission and recombinations. Collisional cooling from far-infrared fine structure lines is largely suppressed by the high , and the optical forbidden lines by the low (by design). The main forbidden lines will be [N II]6583 and [S II]6717, the dominant species of their respective elements independently of the level of ionization of H.
The cooling processes in the nebula are not able to suppress the forbidden lines within the timescale of a year. Without the charged particles sharing the liberated photoelectric energy with neutrals, the expansion would have to cool from about 15000 K to 3300 K, a factor of 4.5, requiring an expansion by a factor of 4.51.5 = 10, requiring a few times . Most of the emission would arise in the dense regions that have not had time to expand (). Dynamical effects cannot suppress the optical forbidden lines until more than a year after the flash unless there is a large fraction of neutrals in the plasma. The radiative rate of cooling for = 18 eV, neglecting expansion, is K yr-1, so the total radiative cooling of the nebula since the flash is not large.
The very high density needed to avoid too many emitting surfaces leads to a recombination timescale of years, comparable to the dynamic timescale, since there is not a continuous supply of ionizing photons.
The timescale of the ionizing flash was probably two or three months. The nova atmosphere started cold ( 20000 K) but reached very high temperatures ( K) a few months later (Balman et al. 1998). Since the initial bolometric luminosity was almost constant at erg s-1, the radius of the star was decreasing rapidly as increased (). The result of the rapidly decreasing radius and shift of the spectrum to higher energies is a rapid drop in the luminosity in H-ionizing photons. The ionizing burst was, presumably, emitted while its temperature was 35000 – 60000 K, when the peak of the blackbody emission is in the range of H ionization energies. The observed very hard photons (in the supersoft X-rays phase at maximum) must have also produced some ionization in the surrounding medium, but the relative numbers of the softer H-ionizing photons was probably vastly greater.
The total energy required in the ionizing burst is
, where is the column density of ions or electrons in
a slab perpendicular to the radius from the nova and is the
distance of the slab to the nova, 5.4 ly for the patch we discussed in
§5. The column density is the local density, , times the path
length, . This gives
. With = 18 eV, cm-2. The
total energy of the burst, if it was isotropic, was
erg, or the bolometric
luminosity of the nova for 4 weeks. This is, obviously, a very
substantial energy requirement. It could be avoided by assuming
clumping in the nova envelope so that the ionizing radiation covered
less than steradians. The explanation of the Balmer lines by
fluorescence of Lyman radiation would require much more energy because
of the inefficiency of absorption of the wide Lyman lines.
The mass of the illuminated portion of the nebula is , where (= 1.4) is the mean mass per H nucleus. Then for = 18 eV and 0.10 for 16 eV. This could be material compressed by a previous outburst. The mass included in a 5 ly sphere is (ISM) M⊙ , so we would expect to find the required nebular mass from the ISM in the Cygnus spiral arm. Its composition should be heavily dominated by the ISM material swept up by a previous expanding shell.
If the dense sheets are the results of the “snowplow” phase of a
previous outburst, the radial momentum in the previous outburst equals
the nebular mass times the turbulent speed (reflecting the pressure)
of the shell;
. The present outburst consisted of (2 –
5) M⊙ (Woodward et al. 1997) at 2000 km s-1.
If we assume that it was typical, the snowplow phase would end when = (4 – 10) km s-1, which is
satisfactory. However, the illuminated nebular mass is near the upper
end of the value that can be explained, and we would expect that much
of most of the nebular material has not been illuminated.
Compressing of the ISM into the dense sheets by the snowplow phase does not explain why this object is so unusual, although V1974 Cyg has exceptionally massive ejecta. Another possibility is that the sheets are the results of the ejection of a common envelope binary, in which mass exchange occurs so fast that the acceptor star cannot accrete the flow either directly or in a disk. A supergiant atmosphere forms with the binary stars contained deep within its interior. The atmosphere (up to 1 M⊙ or more) is ejected at speeds near the escape speed from a supergiant (10 km s-1). This material has much more outward momentum than the nova ejecta.
The common envelope scenario would surely be a very unusual event. Another advantage of this explanation is that the nebular mass would be expected to be much larger than just the visible, since it would include the ISM that was swept up in addition to that in the common envelope.
8 Summary
The region surrounding Nova Cyg 1992 shows an expanding region of brightened material that has the following observed characteristics:
1. The speed of expansion of the outer edge of the illuminated region was initially close to , but slowed to 0.35 by 1996. This clearly shows that the illumination is a wave of radiation expanding from the nova reaching surrounding material.
2. Spectra of the nebula taken over a period of 3 years with moderate resolution show only Balmer lines that have a recombination spectrum with moderate reddening. The 3 upper limits to [N II], [S II], and He I 5876 relative to H are 0.03. A spectrum with the KPNO 4-m telescope showed that the lines are narrow ( km s compared to the nova expansion speed (2000 km s.
3. Regions of the bright nebula have faded over a timescale of 2 years.
Our interpretation of the observations is based on an adopted distance of () pc. At this distance, the bright patch for which we have the best spectrum is 5.4 ly from the nova and 1.0 ly more distant from it.
We interpret the spectrum as recombinations of ionized H in a plasma of normal ISM composition. An alternative possibility is fluorescence following absorption of a burst of Lyman line radiation from the nova. We consider this very unlikely because (a) the spectrum would have a steeper H/H ratio than observed, (b) it would be difficult for the nova shell to emit higher Lyman lines copiously without accompanying Lyman continuum, and (c) the fluorescence would be very inefficient because of the great velocity width of the Lyman lines from the nova. The energy requirement for the burst would much larger than if the emission were in the Lyman continuum.
It is most unlikely that the illuminated material is strongly lacking the heavy elements that produce forbidden optical lines. The density will lead to collisional de-excitation of the various infrared fine structure lines and [S II], but not [N II]. A very low temperature, K, is required. The low is achieved by a sharing of the kinetic energy of the ejected photoelectrons with neutral H atoms that dominate the ion density of the partially ionized plasma by about a factor of ten. These neutrals serve as a reservoir of energy that delays cooling beyond the recombination time.
The electron density is poorly determined. We can predict the intensity of H in the direction normal to each sheet and then account for the maximum observed surface brightness. The electron density must be very high ( cm-3 unless our line of sight pierces thousands of emitting surfaces. The extinction by dust in the sheets is not important.
The ionizing radiation was probably emitted when the temperature of the nova was in the range 35000 – 60000 K, when the maximum emission is in the range of H ionization. The nova was observed to start rather cool and reach 200000 K after 6 months. The energy required by the ionization radiation, if the emission was isotropic, was the luminosity of the nova times about four weeks, barely within the plausible range. The energy requirement is much greater if the Balmer lines are produced by fluorescence of Lyman lines.
At the very high densities we envision, the dynamical timescale is about a year, and the recombination timescale is comparable. The fading of parts of the nebula within 2 years is caused by recombinations and expansion after the burst had passed.
The mass of the ionized sheets is about 0.1 M⊙ . This can barely be supplied by the snowplow phase of the previous nova ejection if it was as massive as the present one. Alternatively, it could easily be supplied if the previous phase was a common envelope binary, in which the mass exchange is so rapid that the stellar orbit occurs within a common atmosphere that is expelled at about the escape speed. This very rare event would supply more than enough momentum to compress the expelled material and surrounding ISM into sheets of neutral material.
We have also undertaken sensitive surveys of H nebulae around recent novae but find no evidence of other such nebulae, so this type of object must be rare.
Acknowledgements.
This research was initiated by the late Prof. Leonida Rosino, who was a teacher and a mentor for two of us (M.O. and M.D.V.). The work was supported by the Italian Space Agency ASI and by the Italian MURST 40% program (“cofinanziamento osservatori-università”). We thank Annette Ferguson for allowing us to take the spectra with the Kitt Peak 4m telescope during her observing run, and Samar Safi-Harb for her help in the early stage of the imaging program. We are also grateful to Takashi Ijima for discussing the early spectra with us and to Marcella Contini for critical reading of an early draft.References
- (1) Balman S., Gallagher J., Orio M., 1996, IAU Circ. 6441
- (2) Balman S., Krautter J., Ögelman H., 1998, ApJ 499, 395
- (3) Chochol D., Hric L., Urban Z., 1993, A&A 277, 103
- (4) Della Valle M., Livio M., 1995, ApJ 452, 704
- (5) Esteban C., Peimbert M., Torres-Peimbert S., & Escalante, V., 1998, MNRAS 295, 1998
- (6) Esteban C., Peimbert M., Torres-Peimbert S., & García-Rojas J., 1999, Rev. Mex. Ast. Ap. 35, 65
- (7) Felten J.E., 1991, Sky & Telescope 81, 153
- (8) Garnavich P., Raymond J., 1997, IAUC 6648
- (9) Haffner L.M., Reynolds R.J., & Tufte S., 1999, ApJ 523, 223
- (10) Hauschildt P., et al., 1994, ApJ 422, 838
- (11) Kolotilov E.N.., et al., 1994, Astron. Reports 38, 548
- (12) Orio M., Covington J., Ögelman H., 2000, submitted to A&A
- (13) Pakull M., Motch C., 1989, in Extranuclear Activity in Galaxies, ed. E.J.A. Meurs & R.A.E. Fosbury (Garching: ESO), 285
- (14) Paresce F., et al., 1995, A&A 277, 103
- (15) Perrine C.D., 1901a, ApJ 14, 249
- (16) Perrine C.D., 1901b, ApJ 14, 257
- (17) Perrine C.D., 1903, ApJ 17, 310
- (18) Rafanelli P., Rosino L., Radovich M., 1995, A&A, 294, 488
- (19) Rappaport S., Chiang E., Kallman T., Malina R., 1994, ApJ 431, 237
- (20) Remillard R.A., Rappaport S., Macri L.M. 1995, ApJ 439, 646
- (21) Ritchey G.W., 1901, ApJ 14, 167
- (22) Ritchey G.W., 1902, ApJ 15, 129
- (23) Rosino L., Iijima T., Rafanelli P., Radovich M., Esenoglu E., Della Valle M., 1996, A&A 315, 463
- (24) Shore S., et al. 1996, ApJ 490, 393
- (25) Spitzer L. Jr., 1978, Physical Processes in the Interstellar Medium (New York: John Wiley & Sons)
- (26) Swope H.H. 1940, Harvard Obs. Bull. No. 913, p. 11
- (27) van den Bergh S., 1977, PASP 89, 637
- (28) Woodward C.E., Gehrz R.D., Jones T.J., Lawrence G.F., Skrutskie M.F., 1997, ApJ 477, 817