X-RAY AFTERGLOW DETECTION OF THE SHORT GAMMA-RAY BURST 991014
Abstract
GRB 991014 is one of the shortest gamma-ray bursts detected so far with the Wide Field Cameras aboard BeppoSAX, both in -rays and X-rays. The duration is 9.6 s in 2-28 keV and 3.2 s in 40 to 700 keV (as measured between the times when 5 and 95% of the burst photons have been accumulated). We refine the InterPlanetary Network annulus of the burst, present the detection of the X-ray afterglow of GRB 991014 within this refined annulus, and discuss X-ray and -ray observations of the prompt and afterglow emission. Except for the briefness of the prompt event, no other unusual aspects were found in the prompt and afterglow observations as compared to such measurements in previous gamma-ray bursts.
1 Introduction
The Wide Field Cameras (WFCs) on board the BeppoSAX satellite have, since launch in April 1996, detected and localized over thirty gamma-ray bursts (GRBs). The accurate (within a few arcminutes) and swift (within a few hours) localizations have enabled the first-time detections of multi-wavelength afterglow emission. The optical spectra of eight such afterglows revealed red-shifted imprints of identifiable spectral features with ’s ranging between 0.43 (GRB 990712, Galama et al. 1999) and 3.42 (GRB 971214, Kulkarni et al. 1998), with one exceptional redshift of if GRB 980425 is associated with SN1998bw (Galama et al. 1998).
GRB 991014 triggered the Gamma-Ray Burst Monitor on BeppoSAX at 1999, Oct. 14.911508 UT (Tassone et al. 1999). It was simultaneously detected with WFC unit 2 at an off-axis angle of 15o in a total field of view of 40. The detection was of low significance and the satellite attitude configuration was poorly determined so that the error radius of the GRB location was relatively large at 6′. The location was communicated about 9 hrs after the burst. Within one day after the burst, a preliminary InterPlanetary Network (IPN) annulus was published (Hurley & Feroci 1999) which intersects the WFC error region and reduces the size of the error region by 65%. Optical and radio follow-up observations were performed but no afterglow was detected at these wavelengths. The sensitivity limit in the optical -band is mag for observations starting 11.2 hrs after the burst (Thorstensen et al. 1999; Uglesich, Halpern & Thorstensen 1999) and at radio wavelengths 125 Jy (8.46 GHz) and 220 Jy (1.4 GHz) for observations starting 1.68 d after the burst (Taylor, Frail & Kulkarni 1999).
GRB 991014 also triggered the Burst And Transient Source Experiment (BATSE) on the Compton Gamma-Ray Observatory (trigger no. 7803, Giblin, Kippen & Sahi 1999). As measured in 50-300 keV peak flux at 64 ms resolution, the burst is in the top 32% of the BATSE bursts. In fluence (25 keV), it ranks in the top 58%. The T90 duration (i.e., the time interval that encompasses 90% of the detected photons above the background starting from when 5% is accumulated) according to these data is s. The hardness ratio, as determined from the ratio of the fluence in BATSE channels 3 (100-300 keV nominal, fluence in erg cm-2) to that in channel 2 (50-100 keV), is .
GRB 991014 is, within the set of WFC-detected bursts, the shortest in -rays which was followed up with sensitive X-ray observations (GRB 980326 has approximately the same duration as GRB 991014 but was not followed up). Nevertheless, it is unlikely that GRB 991014 is a member of the class of short GRBs that have been recognized for many years (Norris 1984, Hurley 1992), that tend to have harder energy spectra than the long ones (Dezalay et al. 1992, 1996; Kouveliotou et al. 1993), and from which so far no afterglow has been detected in any wavelength regime. Giblin et al. (1999) identify GRB 991014 as belonging to the class of long bursts based on the BATSE-determined duration and spectral hardness.
We present -ray and X-ray measurements, both of the burst event and the afterglow of GRB 991014.
2 Instrumentation and X-ray follow-up observations
Our GRB and X-ray afterglow measurements were carried out with the following instruments on board BeppoSAX (Boella et al. 1997b). The Gamma-Ray Burst Monitor (GRBM; Amati et al. 1997 and Feroci et al. 1997) comprises 4 lateral shields of the Phoswich Detector System (PDS, Frontera et al. 1997) and has a bandpass of 40 to 700 keV. The normal directions of two shields are each co-aligned with the viewing direction of a WFC unit. The GRBM has 4 basic data products per shield for a GRB: a time history of the 40 to 700 keV intensity with a variable time resolution of up to 0.48 ms, 1 s time histories in 40 to 700 and 100 keV, and a 256-channel spectrum accumulated each 128 s (independently phased from GRB trigger times; 240 of these channels contain scientific data up to 650 keV). The WFC instrument (Jager et al. 1997) consists of two identical coded aperture cameras each with a field of view of 40 full-width to zero response and an angular resolution of about 5′. The bandpass is 2 to 28 keV. The narrow field instruments (NFI) consist of the low-energy – 0.1 to 10 keV – and the medium-energy – 2 to 10 keV– concentrator spectrometer (LECS and MECS respectively, see Parmar et al. 1997 and Boella et al. 1997a respectively), the PDS (15 to 300 keV), and the high-pressure gas scintillation proportional counter (4 to 120 keV, Manzo et al. 1997).
GRB 991014 was declared a target of opportunity (TOO) for the NFI and a follow-up observation was performed between October 15.4 (13 h after the burst) and October 16.4 UT (we will refer to this observation as TOO1). The exposure time for the MECS was 38.1 ks. Two sources were identified in MECS data that are within the combined WFC/IPN error region (In ’t Zand et al. 1999a). Neither of them showed clear variability. Therefore, a second observation was carried out (TOO2) between October 24.8 and 25.9 UT with a MECS exposure time of 48.2 ks. The X-ray afterglow was identified with the one source that had disappeared in this second observation: SAX J0651.0+1136 (In ’t Zand et al. 1999b). The burst is at a fairly low Galactic latitude with =(2025,+52).
3 Analysis
3.1 The burst event
In figure 1, the time profile of the burst is shown in various bandpasses. The profile is comparatively simple with a single peak at all energies. Within 1 s, the peak occurs simultaneous at all energies. The peak profile appears to flip from below to above 40 keV (i.e., it has a fast-rise exponential-decay profile below 40 keV and an exponential-rise fast-decay one above that). The burst lasts longest at the lowest energies. In the 2-28 keV band the T90 duration is s, while in 40 to 700 keV this is s. We generated a spectrum from the 7-s interval when the WFC signal was brightest. This spectrum can be modeled by a power law function phot s-1cm-2keV-1 with photon index assuming an interstellar absorption of cm-2 (according to an interpolation of the HI maps by Dickey & Lockman 1990). The peak flux in 1-s time resolution following this spectrum is erg s-1cm-2 (2-10 keV). We estimate the 2-10 keV fluence at erg cm-2. For 2 to 28 keV these numbers should be multiplied by 4.1.
The WFC observation on this field was ongoing for 1.15 d before the occurrence of the GRB. A total of 39.5 ksec net exposure time was accumulated. The GRB was not detected during this time, with a 3 flux upper limit of erg s-1cm-2 (2-10 keV, assuming the same spectral shape). Beyond 8 s after the burst onset, only 972 s of net exposure time were left in the observation. We could not find any signal from the burst position on time scales of 5 s, 10 s, or 972 s, and in 2-10 or 2-28 keV. The 3 upper limit for 972 s in 2-10 keV is erg s-1cm-2.
In 40 to 700 keV, the peak intensity is c s-1 in a time resolution of 1 s and twice as large, c s-1, in a resolution of 62.4 ms. The 1 s peak flux is erg s-1cm-2 and the fluence erg cm-2. This brings the X-ray to -ray fluence ratio to 11% which is relatively high though not exceptional. A Fourier power spectrum of the high time resolution data of the GRBM shows no significant features between Hz and 64 Hz.
Beyond 40 keV the burst shows no spectral evolution, although the statistical quality does not permit a sensitive analysis. The photon index as derived from a power law fit to the two-channel 1 s GRBM data shows no evolution with ranging from to over the three brightest time bins, but the longer duration in the WFC band with respect to the GRBM band suggest an overall hard-to-soft evolution. The difference in between the GRBM and WFC data suggests a break in the spectrum between the WFC and GRBM bands.
The statistical quality of the 256-channel GRBM data of GRB 991014 does not permit a sensitive spectral analysis.
3.2 A refined IPN annulus
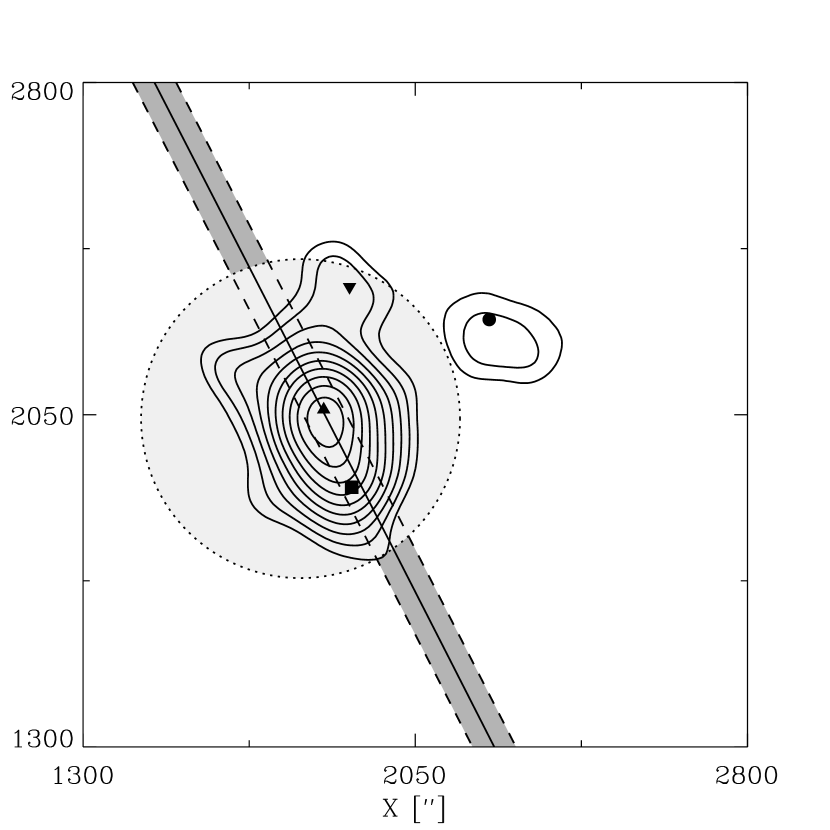
The receipt of final Ulysses ephemeris and timing data, and of the final BeppoSAX ephemeris data, has allowed us to reduce the width of the Ulysses/GRBM IPN annulus from 33 (Hurley & Feroci 1999) to 15 (3 sigma). The final annulus, fully contained within the old one, is shown in figure 2. The initial error box, formed by the intersection of the preliminary IPN annulus with the WFC error circle, had an area of 36 square arcminutes. The final error box, formed by the intersection of the refined IPN annulus with the final NFI error circle, has an area of approximately 4 square arcminutes.
3.3 The X-ray afterglow
The X-ray field around GRB 991014 is somewhat complicated. Several faint X-ray sources can be recognized in a circular field of diameter 25′ around the WFC position. Because of this complication, we carried out a maximum-likelihood analysis of the MECS imaging data. In comparison to the standard analysis methods, the maximum-likelihood method is able to fully take into account the point spread function (PSF) which 1) is critical in disentangling sources that are so close to each other that their PSFs overlap considerably, 2) ensures that all photons detected from each point source are retrieved, and 3) takes into account the Poissonian nature of the data. The maximum-likelihood analysis was performed in two steps. In the first step a map was generated of detection significance, and in the second step the flux and position of all point sources were extracted. For details we refer to the Appendix. The significance map for TOO1 data is given in figure 2.
For the combined MECS TOO1 and TOO2 imaging data, four point sources are required to satisfactorily describe the data. Their positions are indicated in figure 2. The elongated structure within the initially reported as well as refined IPN/WFC error box is explained by two point sources separated by 15. We designate the upper (most northern) source as S1 and the lower one as S2.
The photon count numbers were determined in various time intervals by maximum-likelihood fits of the 4 point source strengths – while keeping the positions fixed – and the background level. The average MECS (units 2 and 3 added) photon count rate during TOO1 is c s-1 for S1 and c s-1 for S2. We divided TOO1 in 3 time intervals to search for variability of the two sources, without a definite result (the maximum difference in photon count rate is for S1, but only at 1.4). In TOO2 the average rates are c s-1 for S1 (3 upper limit) and c s-1 for S2. From these latter numbers we identify S1 as the afterglow source of GRB 991014. S1 is equal to SAX J0651.0+1136. Its position is =6h51m02.9s, =+11o36′03″. The statistical error radius is 40″ (99% confidence) but the systematic error enlarges the final error radius to 15. The combined IPN/NFI error box is depicted in figure 2. The ratio of the upper limit in TOO2 and the average flux in TOO1 implies that the decay index is steeper than .
A spectrum was generated for the afterglow from the LECS and MECS TOO1 data by maximum-likelihood fits of the 4 point source strengths and background level in four logarithmically-sized bands between 0.2 and 2.2 keV for the LECS data and eight logarithmically-sized bands between 1.6 and 10 keV for the MECS data (2 units). A simple absorbed power law model with Galactic interstellar absorption of cm-2 (following Dickey & Lockman 1990) fits the data well ( for 6 dof) with a photon index of . The average (unabsorbed) flux is erg s-1cm-2 (2-10 keV) which is a factor of 105 smaller than the 2-10 keV peak flux of the gamma-ray burst itself. This implies that the energy emitted in the X-ray afterglow is comparable to that in the burst itself, and a decay index between the WFC and the MECS fluxes of which is not extraordinary quick when compared to other cases (e.g., Piro 2000). The data provide a constraint on : it is less than cm-2.
No signal was seen in the PDS data of TOO1. The 2 upper limit in 15-100 keV is 30 times the flux predicted by an extrapolation of the MECS-measured spectrum.
The NFI field seems complicated, with a concentration of sources near the GRB position. Actually this number of sources is not a surprise given the number of background sources expected. Giommi, Fiore & Perri (1999) have estimated log-log distributions for 2-10 keV background sources in BeppoSAX observations at high Galactic latitudes and find that for a flux limit of erg s-1cm-2 (2-10 keV) there are approximately 10 sources per square degree. The chance probability to find 3 or more sources in a 25′-diameter circle is 18%. The Galactic latitude is fairly low for GRB 991014. Therefore, one may actually expect more sources than those already counted at high Galactic latitude, particularly above 2 keV given cm-2. The concentration towards the GRB may be a selection effect because the sensitivity of the MECS increases towards the center position due to vignetting of the concentrators.
4 Conclusion
The constraints that could be derived for the indices of the spectrum and temporal decay are not unusual as compared to the X-ray afterglows of other GRBs (for a review of X-ray afterglows, see for example Piro 2000). Also, the spectrum of the prompt emission is not unusual. The upper limit on the optical afterglow is fairly faint. This is not the result of Galactic extinction which in this direction is a mild , based on HI maps by Dickey & Lockman (1990). It may be the result of extinction in a host galaxy. We remark that it is not exceptional that no optical afterglow was detected. This applies to about half of all well-localized GRBs (e.g., Kulkarni et al. 2000).
We conclude that GRB 991014 does not exhibit behavior in the prompt spectrum or the afterglow that would make it distinct from other longer bursts.
References
- (1) Amati, L., Cinti, M.N., Feroci, M., et al. 1997, SPIE Proc. 3114, 176
- (2) Band, D., Matteson, J., Ford, L., et al. 1993, ApJ, 413, 281
- (3) Boella, G., Chiappetti, L., Conti, G., et al. 1997a, A&AS, 122, 327
- (4) Boella, G., Butler, R.C., Perola, G.C., et al. 1997b, A&AS, 122, 299
- (5) Costa, E., Frontera, F., Heise, J., et al. 1997, Nature, 387, 783
- (6) Dezalay, J-P., Barat, C., Talon, R., et al. 1991, in Proc. Gamma-Ray Bursts Workshop 1991, eds. W.S. Paciesas & G.J. Fishman, AIP Conf. Proc. 265 (New York: AIP), 304
- (7) Dezalay, J-P., Lestrade, J.P., Barat, C., et al. 1996, ApJ, 471, L27
- (8) Dickey, J.M., Lockman, F.J. 1990, ARA&A, 28, 215
- (9) Eadie, W.T., Drijard, D., James, F.E., Roos, M., Sadoulet, B. 1971, “Statistical methods in experimental physics”, North-Holland Publ. Co. (Amsterdam), p. 231
- (10) Feroci, M., Frontera, F., Costa, E., et al. 1997, Proc. SPIE, 3114, 186
- (11) Feroci, M., Antonelli, L.A., Guainazzi, M., et al. 1998, A&A, 332, L29
- (12) Frontera, F., Costa, E., Dal Fiume, D., et al. 1997, A&AS, 122, 357
- (13) Galama, T.J., Vreeswijk, P.M., van Paradijs, J., et al. 1998, Nature, 395, 670
- (14) Galama, T.J., Vreeswijk, P.M., Rol, E., et al. 1999, GCN Circ. 388
- (15) Giblin, T., Kippen, R.M., Sahi, M. 1999, GCN Circ. 424
- (16) Giommi, P., Fiore, F., Perri, M. 1999, Astrophys. Lett. Comm. 39, 173
- (17) Hurley, K., 1991, in Proc. Gamma-Ray Bursts Workshop 1991, eds. W.S. Paciesas & G.J. Fishman, AIP Conf. Proc. 265 (New York: AIP), 3
- (18) Hurley, K., Feroci, M. 1999, GCN Circ. 419
- (19) Jager, R., Mels, W.A., Brinkman, A.C., et al. 1997, A&AS, 125, 557
- (20) Kouveliotou, C., Meegan. C.A., Fishman, G.J., et al. 1993, ApJ, 413, L101
- (21) Kulkarni, S.R., Djorgovski, S.G., Ramaprakash, A.N., et al. 1998, Nature, 393, 35
- (22) Kulkarni, S.R., Berger, E., Bloom, J.S., et al. 2000, in Proc. 5th Huntsville Symp. on GRBs, ed. M. Kippen, AIP Press (Melville), in press (astro-ph/0002168)
- (23) Norris, J.P., Cline, T.L., Desai, U.D., Teegarden, B.J., 1984, Nature, 308, 434
- (24) Parmar, A.N., Martin, D.D.E., Favata, F., et al. 1997, A&AS, 122, 309
- (25) Piro, L. 2000, in Proc. of ”X-Ray Astronomy ’99: Stellar Endpoints, AGN and the Diffuse X-ray Background”, September 6-10, 1999, CNR Bologna, in press (astro-ph/0001436)
- (26) Taylor, G.B., Frail, D.A., Kulkarni S.R. 1999, GCN Circ. 425
- (27) Uglesich, R., Halpern, J., Thornstensen, J., 1999, GCN Circ. 428
- (28) Tassone, G., in ’t Zand, J.J.M., Frontera, F., Gandolfi, G. 1999, IAU Circ. 7281
- (29) Thorstensen, J., Uglesich, R., Halpern, J., et al. 1999, GCN Circ. 422
- (30) in ’t Zand, J.J.M., Kuiper, L.M., Antonelli, L.A., et al. 1999a, GCN Circ. 427
- (31) in ’t Zand, J.J.M., Antonelli, L.A., Kuiper, L.M., et al. 1999b, GCN Circ. 429
APPENDIX
The image analysis is based on maximum-likelihood ratio (MLR) tests performed at certain user-defined grid points in a sky field around the object of interest, to search for point sources on top of a flat background. At each grid point () one determines the maximum likelihood under two hypotheses: is a description of the data in terms of the flat background model only and a description in terms of the flat background model and a point source at (). Under , the number of counts expected in a measured sky pixel is given by :
| (1) |
where and represent the (flat) background level and source strength respectively, and the number of source counts in pixel from a source at () (see Boella et al. 1997a). The measured number of counts in pixel is .
By minimizing the natural logarithm of the likelihood under , given by , with respect to its free scale parameters, and , one can derive the flux and flux uncertainty from and its error for a putative source at position (). From optimizations under and one can determine the likelihood ratio defined as . This quantity is distributed as for 1 degree of freedom for a known source position (e.g., Eadie et al. 1971) and yields the source detection significance. The maximum-likelihood ratios evaluated at the grid points () constitute the MLR map.
The MLR map for the MECS TOO1 imaging data (8″ grid point spacing; no energy selection applied) is given in figure 2. The maximum value corresponds to a detection significance, and is located within the cross section of the WFC and IPN error regions. From the map it is clear that multiple sources contribute to the observed excess. For instance, the excess is elongated and suggestive of two or more close point sources. In order to determine the minimum number of point sources on a flat background that are required to satisfactorily describe the measured data, we applied a maximum-likelihood source-fitting procedure. In this procedure the data are described in terms of a flat background model and a number of sources each with a free position. One starts with a model composed of the flat background model and a single source at an arbitrary free position and optimizes the likelihood with respect to the background level, source strength and source-position parameters simultaneously (4 free parameters). Next one determines the likelihood improvement with respect to the zero hypothesis that the data are described in terms of a flat background model only (1 free parameter). If the improvement exceeds the threshold for 3 d.o.f. one continues and compares the optimized likelihood of a model composed of a flat background and 2 sources at arbitrary positions with the optimized likelihood for the previous model with 1 source at an arbitrary position. This process is repeated until the likelihood improvement is below the threshold for 3 d.o.f. At each iteration one obtains the optimum background scaling parameter and for each source its strength and position together with uncertainty estimates on each free parameter.