Pair-Instability Supernovae, Gravity Waves, and Gamma-Ray Transients
Abstract
Growing theoretical evidence suggests that the first generation of stars may have been quite massive (). If they retain their high mass until death, such stars will, after about 3 , make pair-instability supernovae. Theoretical models for these explosions have been studied in the literature for about four decades, but very few of these studies have included the effects of rotation and none ever employed a realistic model for neutrino trapping and transport. Both turn out to be very important, especially for those stars whose cores collapse into black holes (helium cores above about 140 ). We consider the complete evolution of two zero-metallicity stars of 250 and 300 . Despite their large stellar masses, we argue that the low-metallicities of these stars result in negligible mass-loss. Evolving the stars with no mass-loss and including angular momentum transport and rotationally induced mixing, these two stars produce helium cores of 130 and 180 respectively. Products of central helium burning (e.g. primary nitrogen) are mixed into the hydrogen envelope, which can dramatically change the expansion of the envelope, especially in the case of the 300 model. Explosive oxygen and silicon burning cause the 130 M⊙ helium core (250 star) to explode, but explosive burning is unable to drive an explosion in the 180 helium core and it collapses to a black hole. For this star, the calculated angular momentum in the presupernova model is sufficient to delay black hole formation and the star initially forms a 50 M⊙, 1000 km core within which neutrinos are trapped. Although the star does not become dynamically unstable, the calculated growth time of secular rotational instabilities is shorter than the black hole formation time, and such instabilities may develop. The estimated gravitational wave energy and wave amplitude would then be and , but these estimates are very rough and depend sensitively on the non-linear nature of the instabilities. After the black hole forms, accretion continues through a disk. The mass of the disk depends on the adopted viscosity, but may be quite large, up to 30 when the black hole mass is 140 . The accretion rate through the disk can be as large as 1-10 . Although the disk is far too large and cool to transport energy efficiently to the rotational axis by neutrino annihilation, it has ample potential energy to produce a jet driven by magnetic fields. The interaction of this jet with surrounding circumstellar gas may produce an energetic gamma-ray transient, but given the redshift and time scale, this is probably not a model for typical gamma-ray bursts.
1 Introduction
Simulations of the collapse of primordial molecular clouds suggest that the first generation of stars (Ostriker & Gnedin 1996) contained many extremely massive members, from one hundred to several hundred solar masses (e.g. Larson 1999; Bromm, Coppi, & Larson 1999; Abel, Bryan, & Norman 2000). While details of the mass function and the interaction of these stars with their environment have yet to be worked out, up to 1 % of the baryonic mass of the universe might have participated in this generation of stars (Abel, private communication). Such stars (M 100 ) will reach carbon ignition with helium core masses in excess of about 45 and will encounter the electron-positron pair instability, igniting carbon and oxygen burning explosively (e.g., Barkat, Rakavy, & Sack 1967; Woosley & Weaver 1982; Bond, Arnett & Carr 1984; Carr, Bond, & Arnett 1984; Glatzel, El Eid, & Fricke 1985; Woosley 1986; Heger and Woosley 2000). If explosive oxygen burning provides enough energy, it can reverse the implosion in a giant nuclear powered explosion. As the mass of the helium core increases, so does the strength of the explosion and the mass of synthesized. Indeed masses of ejecta over 40 and explosion energies approaching are possible, with light curves brighter than for several months. Truly these are “hypernovae” (Woosley & Weaver 1982; Paczynski 1998). But they have not hitherto been associated with gamma-ray transients (GRTs) because no relativistic matter is ejected.
However, going to still more massive helium cores (over 140 ) a new phenomenon occurs as a sufficiently large fraction of the center of the star becomes so hot that the photodisintegration instability is encountered before explosive burning reverses the implosion. This uses up all the energy released by previous burning stages, and, instead of producing an explosion, accelerates the collapse. A massive black hole is born inside the star. This has been known for some time, but here we consider what might occur if, in addition to its high mass, the helium core is endowed with a moderate amount of rotation. We follow zero metallicity stars from the main sequence where they are assumed to rotate rigidly with a ratio of surface centrifugal force to gravity of 20 % - comparable to what is seen in O-stars today. By combining the angular momentum transport physics described in Heger, Langer, & Woosley (2000) up until stellar collapse with the two-dimensional rotating core-collapse code developed by Fryer & Heger (2000), we are able to follow the entire life and death of this rotating 300 star. Bond et al. (1984) discussed the effects of rotation on the collapse of these massive stars and we compare our simulations with their estimates for neutrino emission and gravitational wave emission.
Because of their high angular momentum, such massive helium-depleted cores do not immediately collapse to black holes, but instead form a hot dense, neutronized core of 50 which continues to accrete matter for nearly 1 before collapsing inside its event horizon. Although this “proto-black hole” is not dynamically unstable, it rotates sufficiently rapidly to develop secular instabilities that may cause it to break into multiple cores, each of which collapses to a black hole and then merges with the rest. Even without this fragmentation, the collapse of a 300 star turns out to be a strong source of gravitational waves with energies and wave amplitudes of: and .
After black hole formation and following the collapse of roughly another 100 , the outer layers of the helium core have sufficient angular momentum to hang up in a disk which accretes onto the black hole at rates in excess of 1 . This black hole accretion disk system may produce a new class of collapsar-like (MacFadyen & Woosley 1999; MacFadyen, Woosley, & Heger 2000) GRTs. Although neutrino annihilation is too inefficient to produce polar outflows in such large stars, if magnetic fields can extract % of the rest mass of the accreted material and focus it into % of the sky, the equivalent isotropic energy of these GRTs could approach .
2 Pre-Collapse Evolution of 250 and 300 Stars
2.1 Population III Stars
It has long been thought that the first generation of stars after the Big Bang might be characterized by an initial mass function skewed to more massive stars (e.g., Silk 1983; Carr & Rees 1984). More recently Abel, Bryan, & Norman (2000) have studied the formation and fragmentation of primordial, zero metallicity molecular clouds using a three-dimensional code with adaptive mesh. Dark matter dynamics, hydrodynamics, and the relevant chemical and radiative processes were followed down to a scale of 0.5 . They concluded that the typical mass of the first-generation stars is . Based upon the amount of energy released by hydrogen fusion, the need to re-ionize a significant fraction of the universe prior to red shift 5 using the light of such stars, and a crude estimate of the ionization efficiency of a given ultraviolet photon, one estimates that roughly 0.01 % to 1 % of the baryonic mass of the universe was incorporated into such stars. For a galaxy this corresponds to to massive stars, an estimate that probably exceeds the rates of merging double neutron star binaries or black hole binaries in the Milky Way, per 10 (Fryer, Woosley, & Hartmann 1999). There is thus ample theoretical basis for assuming the formation of an appreciable number of primordial stars having mass up to several hundred .
2.2 Mass Loss
Because of their short lifetime, there are no nearby examples of these zero-metallicity, high-mass stars formed in the first generation of stars. Indeed, because the initial mass function of population I and II stars is skewed much more toward low-mass stars, there are few examples of any nearby massive stars. Unfortunately, this makes determining the mass loss of these stars from observations very difficult.
Mass loss in such heavy stars today is dominated by radiative processes (Appenzeller 1986) and the stars probably lose most of their mass before dying. For zero metallicity, however, as would have characterized these first stars, radiative mass loss is probably negligible (Kudritzki 1999). However, one must still consider mass loss driven by nuclear pulsations. The critical mass for the onset of the nuclear pulsational instability (Schwarzschild & Harm 1959) is very uncertain ( for stars of solar metallicity; Appenzeller 1986), and the resulting mass loss rate, even more so. For very low metallicity, both the temperature dependence of hydrogen burning and the gravitational potential at the surface of the star would be different. Appenzeller’s (1970) estimate that a 130 star would lose during its main sequence lifetime is probably an overestimate for Pop III stars. What the value would be for stars of 200 and 300 is unknown, but preliminary calculations by Baraffe, Heger, & Woosley (2000) suggest that it could be small. These same new calculations also suggest that, at solar metallicity, opacity and ionization instabilities are more important in driving mass loss than hitherto realized.
2.3 Presupernova Evolution of 250 and 300 , Z = 0 stars
We thus consider the evolution of two massive, rotating, Population III stars of 250 and 300 evolved at constant mass. By “Population III”, we mean that the initial composition is 76 % H and 24 % He with no initial abundance of anything heavier. The evolution of these stars is followed using a one-dimensional hydrodynamic stellar evolution code, KEPLER (Weaver et al. 1978), from central hydrogen ignition until core collapse. Stellar rotation is included as described in Heger et al. (2000). That is, mixing and redistribution of angular momentum induced by convection, shear, Eddington-Sweet circulation, etc., are followed, but the centrifugal force terms are not included in the stellar structure equations. Semiconvection is treated as in Woosley & Weaver (1995), but no overshoot mixing is assumed. So long as the ratio of centrifugal force to gravity remains small, as it did during the epoch followed by KEPLER, this should be an accurate approximation. For the initial angular momentum of the rotating ZAMS stars we assumed rigid rotation with a velocity 20 % Keplerian at the equator, comparable to the typical value of observed O-stars.
More details of the evolution of these stars and many other Population III models will be given elsewhere (Heger & Woosley 2000). Here we note only those characteristics relevant to forming black holes and producing jets and gravity waves. After central helium depletion, () the masses of the helium cores in the 250 and 300 models are 130 and 180 , respectively. The hydrogen envelopes are also appreciably enriched in helium and products of helium burning with , , for the 250 model and , , (mostly CNO) for the 300 model. The luminosities of the two stars are 3.8 and 5 , respectively, and the central carbon abundance, 6.0 % and 4.8 %, by mass.
An interesting characteristic of these two stars is their production of primary nitrogen. As a consequence of both the initial CNO-deficiency and helium-rich nature of their envelopes (resulting from rotationally induced mixing), the hydrogen burning shell is characterized by a relatively shallow entropy gradient. Thus the envelope remains compact and rapidly rotating with only a small entropy barrier separating it from the helium core. During the growth of the helium-burning convective core, traces of carbon and oxygen are mixed into the hydrogen-burning shell by meridional circulation. An increase of CNO mass fraction to as little as is sufficient to significantly increase the nuclear energy generation rate and make the hydrogen burning shell convective. More significantly, during late stages of helium burning the shear between the hydrogen shell and the core becomes large enough to lead to a significant dredge-up of the helium core, i.e., helium and large amounts of helium burning products - carbon, oxygen, and neon - are mixed into the envelope. Because of the short time remaining in the life of the star at this point, only part of the carbon and oxygen are processed into nitrogen. For the 250 star, this major mixing event happens at a central helium mass fraction of 25 % while in the 300 star it occurs only at the end of central helium burning. In the 250 star, the mass fraction of primary nitrogen in the envelope is 7.75 % (i.e., a total of 9.48 ), while carbon and oxygen have mass fractions of 0.26 % and 7.97 %, respectively. Since in the 300 star the dredge-up occurs only towards the end of central helium burning, the material mixed into the envelope shows a clear signature of elements produced at the end of hot helium burning. For the 300 star, the mass fractions are: nitrogen - 1.28 % (i.e, a total of 1.56 ), carbon - 0.033 %, oxygen - 5.68 %, neon - 0.964 %, and magnesium - 0.395 %.
The increased energy generation afforded by the (suddenly) larger abundance of CNO leads to the formation of red supergiants in both stars. The radius of the 250 model expands from 2.3 to by the time it encounters the electron-positron pair instability; the 300 model, from 4 to 1.5 . The mixing events occur before core collapse in the 250 model and before collapse in the 300 model. Note that all these estimates of mixing, nitrogen nucleosynthesis, and time-scales are sensitive to the highly uncertain physics of convection and rotational instabilities.
The new large radius and high metal content in this supergiant phase can cause significant mass loss and may remove the envelope, particularly if the star is in a binary. Once the helium core is revealed, unless a small amount of hydrogen remains, an even more pulsationally unstable situation may be created. Appenzeller (1986) summarizes evidence that bare helium cores above 16 may be unstable to nuclear driven pulsations. However, especially for the 300 model, the time remaining until the star dies is very short. If the core can avoid losing an additional 40 of helium (i.e., 0.004 y-1), a black hole will form.
3 Collapse and Black Hole Formation
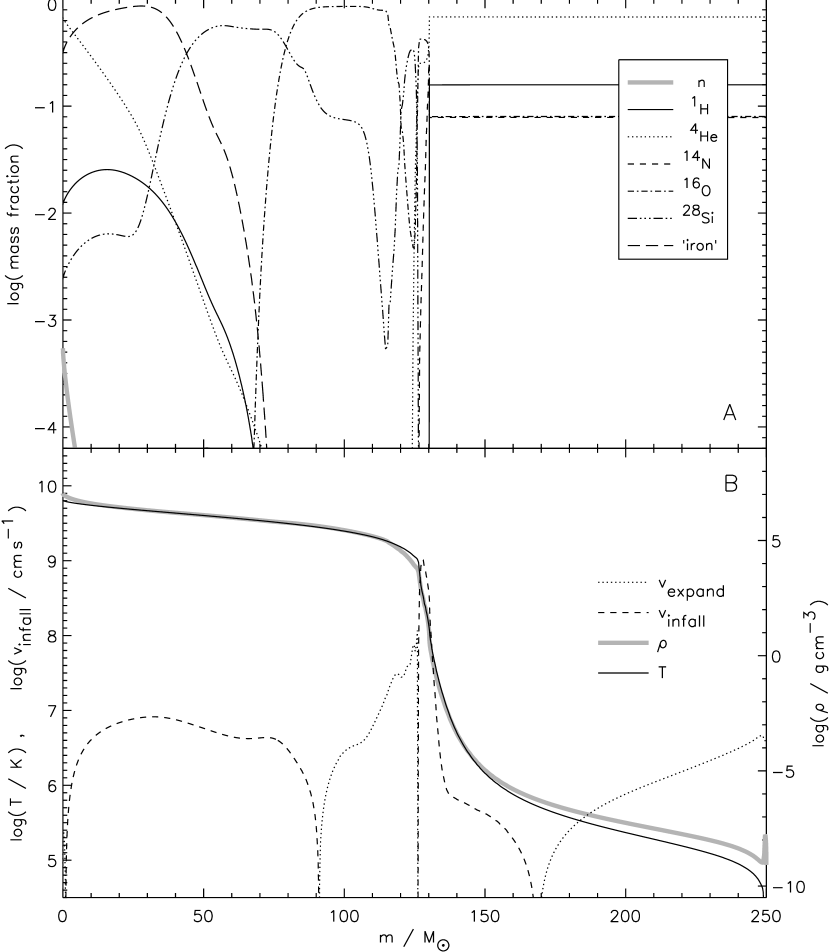
Following helium depletion, both the 250 and 300 stars encounter the electron-positron pair instability. The 250 star experiences a very deep bounce, penetrating into the pair-unstable region, then violently rebounds because of the excess energy created by explosive oxygen and silicon burning. The peak temperature and density during the bounce are 6.37 and 1.08 (Fig. 1). So much of the core is heated to temperatures in excess of that 43.0 of is synthesized. We estimate that this is very nearly the maximum mass that can explode by nuclear burning alone and so represents a nearly maximal mass of 56Ni and explosion energy, 9 of kinetic energy at infinity, almost 100 times that of an ordinary supernova. Heger et al. (2000) have calculated a peak luminosity for this model of () lasting for about 150 days. Roughly the same peak luminosity and duration characterizes the event with and without the hydrogen envelope, but in the case of the helium core the peak is delayed about 100 days and completely powered by decay. Since the kinetic energy of the explosion is so high, the interaction with circumstellar matter might also be quite brilliant. These are truly “hypernovae” (Woosley & Weaver 1982), but no strongly relativistic matter is ejected and this explosion will not produce a GRT.
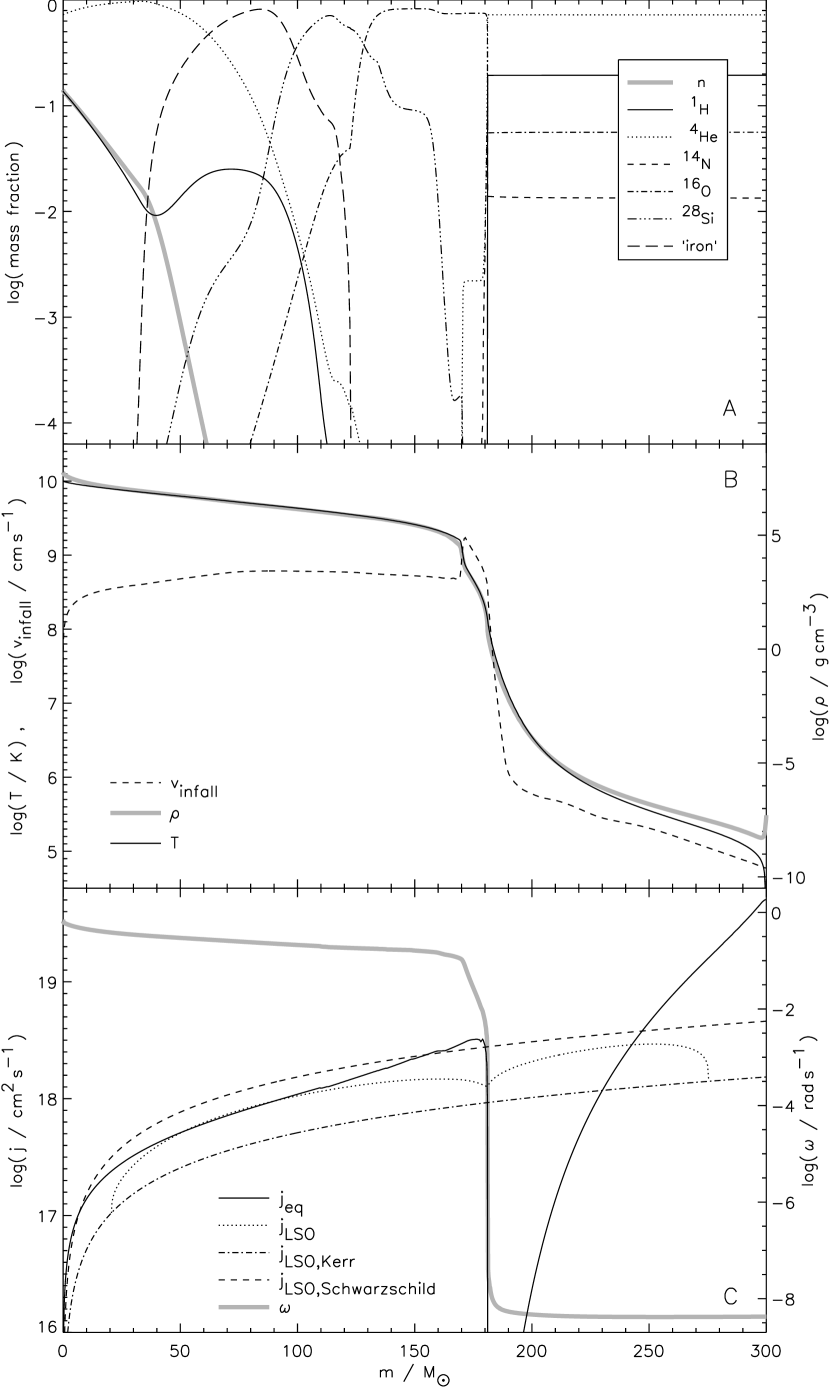
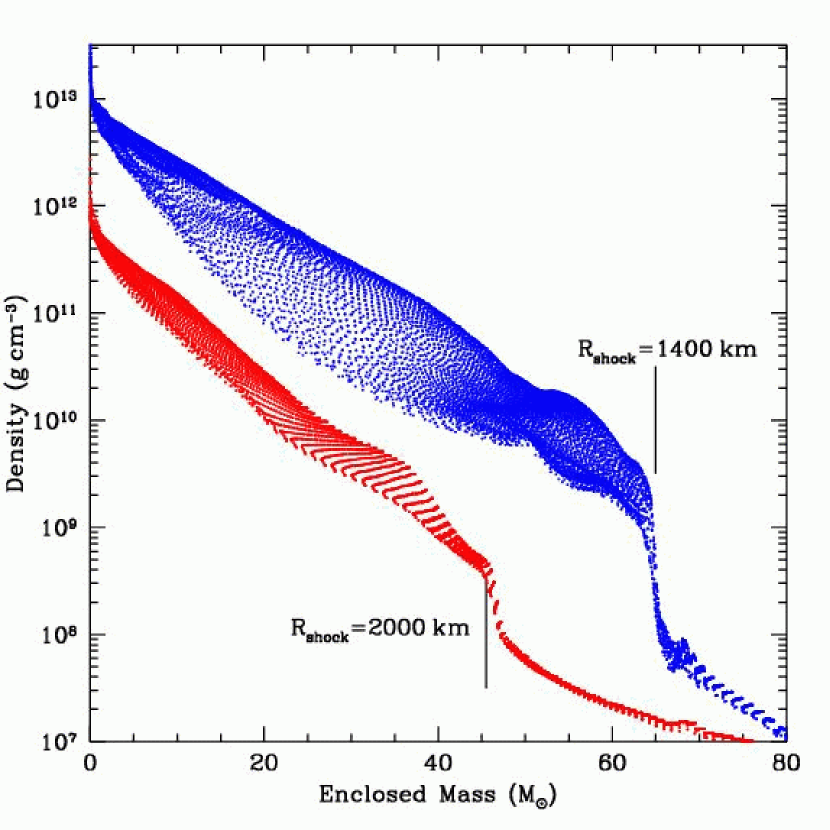
The 300 model (180 helium core) on the other hand is so tightly bound and gains so much kinetic energy prior to oxygen burning that even the fusion of the entire core to silicon and iron is unable to reverse its infall. It must make a massive black hole. At the latest time reliably calculated with KEPLER, the central temperature had reached and the nuclei in the center of the star had photodisintegrated to 72 % alpha particles and 28 % nucleons ( = 0.50). Unlike what is seen in ordinary supernova models, even though temperature dependent partition functions were included in the calculation, the higher entropy of these models results in complete photodisintegration of heavy elements. The density at this point is 5.5 , the total kinetic energy of infall, 5.8 , and the net binding energy, . Figure 2 shows the composition, temperature and density structure, and distribution of specific angular momentum at this time. In subsequent discussions we define this to be the t = 0 collapse model.
3.1 Collapse without Rotation
Beyond this point the effects of neutrino trapping are no longer negligible and the Kepler model was mapped into a one-dimensional Lagrangian core-collapse code (Herant et al. 1994, Fryer et al. 1999) which included the effects of general relativity and neutrino transport. It is useful to compare the ensuing collapse of this 300 star to the core-collapse of an ordinary 15 supernova progenitor. Just like ordinary supernovae, as the core of the 300 star contracts, the rate of electron capture increases and the removal of electron degeneracy pressure and cooling via neutrino emission help to create a runaway collapse. However, there are several important differences between the structures of 300 and 15 stars. As noted previously, the entropy in the more massive core is larger and thus favors the more complete photodisintegration of heavy elements and alpha particles. General relativity also plays a more significant role. The collapse of a 15 core halts when its central density exceeds a few times , i.e., when nuclear forces and neutron degeneracy pressure become important. However, the core of a 300 star is so large that it collapses into a black hole before nuclear forces can affect the collapse, less than 1 after the code link at .
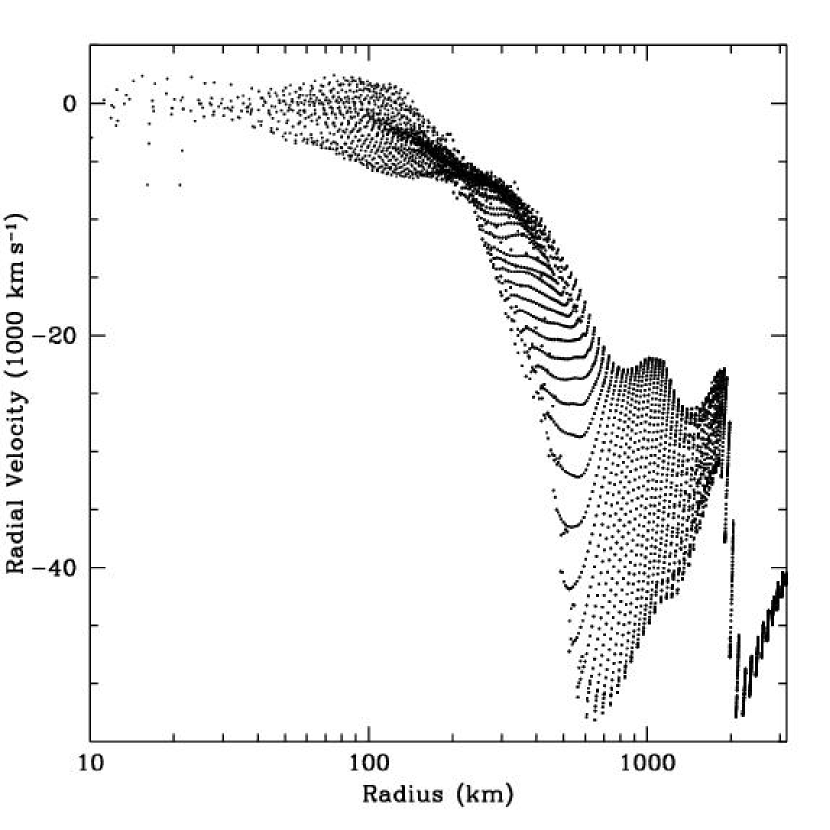
Figure 3 shows the velocity, electron fraction (), temperature and density profiles of the 300 core at times zero, 500, 800, and 930 after the code link. Before the initial collapse, the entropy of the core is per nucleon (compare to per nucleon for most core-collapse supernovae). Hence, for a given central collapse density, the 300 star is hotter and neutrino emission is more efficient. Neutrinos from electron capture stream out from the core, quickly lowering its lepton number and lowering the electron degeneracy pressure. However, because the core of a 300 M⊙ star is so much bigger than a 15 M⊙ supernova progenitor, electron neutrinos are trapped at a lower central density (Bond et al. 1984). Initially, neutrino absorption dominates the electron neutrino opacity, but as the temperature rises, pair scattering quickly becomes the most important opacity source. Although and neutrinos escape the collapsing star more easily, trapping the electron neutrinos halts the deleptonization in the core. But at this point, the collapse of the core is already inevitable. The large population of electron neutrinos in the core actually causes the central electron fraction to rise, as the core strives to reach an equilibrium between the electron/anti-electron neutrinos and the electron/proton fractions in the core (see Fig. 3).
In our simulations, we follow the collapse until a part of the star falls below its last stable orbit (for the non-rotating star this is ). We use the simplifying assumption that the core “forms a black hole” at this point. A rigorous determination of the first trapped surface would require a multi-dimensional general relativistic calculation that is beyond the scope of this paper. The exact point in the core where the initial black hole forms is also very sensitive to the neutrino transport (especially upon the and neutrinos which dominate the neutrino cooling). In our simulations, the black hole first forms at , but the entire inner 35 of the core is very close to its last stable orbit and relatively small changes in the and transport could give an initial black hole mass anywhere in the range of 15-35 . However, no matter where the black hole initially forms, without rotation, most of the helium core will very quickly become part of the black hole.
The bulk of the potential energy released during the collapse is dragged into the black hole. Without rotation to drive a dynamo, it is unlikely that a strong magnetic field will emerge during the collapse and magnetic fields will not be able to tap any of the potential energy. Likewise, a non-rotating collapse will not emit much energy in gravitational waves. Bond et al. (1984) argued that much of the potential energy could be released in a neutrino fireball. However, their analytic calculation overestimated the temperature at the neutrinosphere, which drastically overestimated the total neutrino luminosity. In our simulations, most of the neutrinos are trapped in the flow and only 1 % of the gravitational potential energy is released in neutrinos, most in and neutrinos (Fig. 4). The collapse of a non-rotating 300 star proceeds without so much as a whimper.
3.2 Collapse With Rotation
However, these stars are rotating and this plays an important role in the collapse. As with the non-rotating model, the rotating collapse is simulated by first mapping the KEPLER output into the one-dimensional neutrino transport code. The effect of rotation is included by adding a centrifugal term, , to the force equation and conserving angular momentum locally, , for each mass . We map from the KEPLER output (Fig. 2) by setting and add the equatorial force to the entire star. This approximation obviously overestimates the effect of angular momentum everywhere except in the equatorial plane, but allows us to follow the first 1.5 of the star’s collapse quickly and gives approximately the correct composition and mass distribution. Recall that in the non-rotating simulation, a black hole formed 1 after mapping from the KEPLER output into our 1D neutrino transport code. In the rotating simulation, centrifugal forces become extremely important (Fig. 5) and slow the collapse. After 1.5 , the central density of the rotating core is only .
When the centrifugal force exceeded 25% of gravity for any lagrangian zone (Fig. 5), the one-dimensional collapse calculation was halted again and remapped into a two-dimensional code based upon the smooth particle hydrodynamics prescription (Herant et al. 1994, Fryer & Heger 2000). Use of the 2D code was delayed until this point in order to make the problem computationally tractable. The rotational axis was aligned with the code’s axis of symmetry and the angular momentum of each particle was given by the rotation rate of the zones in the one-dimensional calculation: where is the angle above the plane of rotation. The net effect is to give (initially) spherical shells constant angular velocity and a total angular momentum equal to what they had in the Kepler model at t = 0.
A total of three two-dimensional simulations were performed this way, each employing a different treatment of the angular momentum. The models will be referred to by three names: A) no rotation (this is inconsistent with the assumed density structure, but calculated just for comparison); B) the star rotates with the angular momentum distribution at the end of the 1D calculation - which is the same as prescribed by the KEPLER calculation; in the continued evolution the angular momentum of each particle is conserved; and C) same as B, but with angular momentum transport between particles mediated via an alpha-disk prescription (: see Fryer & Heger 2000 for details). In the remainder of this section, we discuss the collapse of the star and the resultant black hole formation under these three assumptions. A summary of results is given in Table 1.
As might be expected from our non-rotating collapse simulation, Model A collapses directly into a black hole 250 after the beginning of the two-dimensional simulation. As before, we assume that the star has made a black hole when matter at any radius lies within its last stable orbit for the given distribution of matter. At that point, all particles inside this radius are removed and replaced by a perfectly absorbing inner boundary condition at that radius. This way, we can follow the continued accretion into the black hole (Sect. 5).
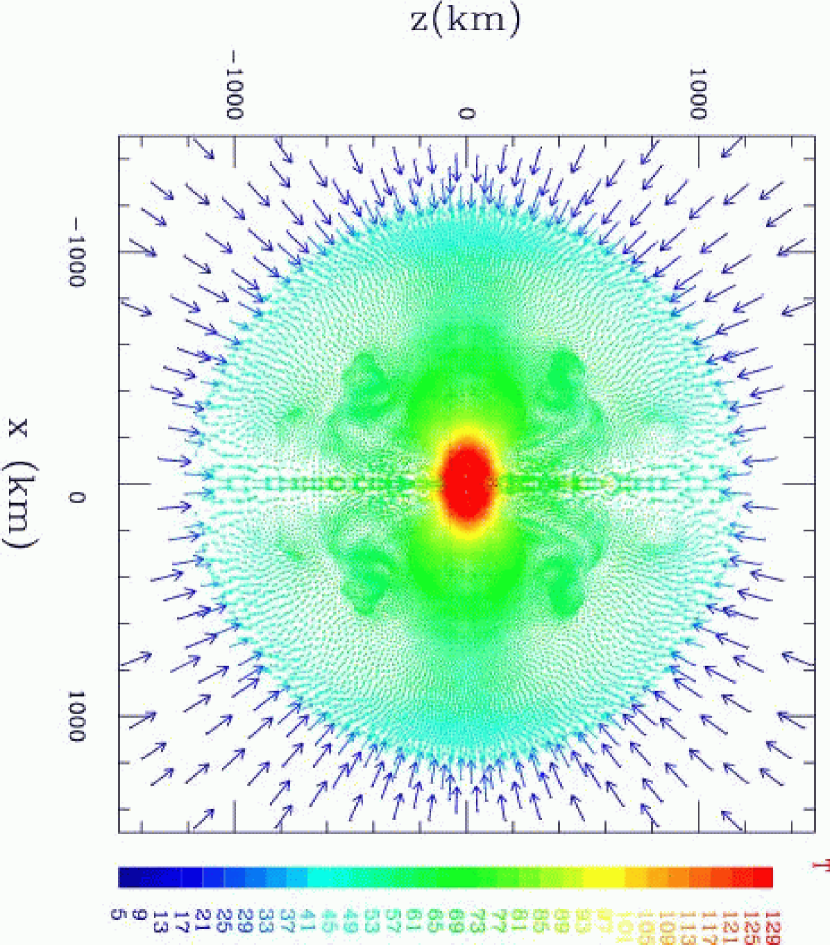
The models which include the KEPLER angular momentum distribution (Fig. 2) evolve very differently from the non-rotating case. As the star collapses, neutrinos become trapped in the flow, maintaining . The high entropy of the 300 star, along with the rapid rotation, halts the collapse of the core and even produces a weak “bounce” at a central density of only a few times (Fig. 6). The structure of the resulting core is similar to the proto-neutron star cores encountered in ordinary core-collapse supernovae, but here it is much larger. Usually, in lower mass supernovae, after nuclear forces and neutron degeneracy pressure halt the collapse, the core bounces, sending a shock into the star. When the bounce shock stalls, it forms a proto-neutron star core capped by the accretion shock produced as the remainder of the star falls onto the core. In the case of core-collapse supernovae, the proto-neutron star has a mass of roughly 1 and a radius of . In the present simulations of the 300 star, our weak “bounce” yields a 50 “proto-black hole” with a radius of 1000 (Fig. 7). By proto-black hole, we mean a hot dense neutronized core that has not contracted inside its event horizon, but which would do so if lost its internal entropy.
Material continues to accrete onto this core through a shock at a rate of 10-100 . By 1.1 after the beginning of the two-dimensional simulations (2.6 after the initial collapse in Fig. 2), the proto-black hole mass has increased to nearly 70 (Fig. 8). Neutrino emission, dominated by and neutrinos (since the electron neutrinos are trapped), cools the proto-black hole and the radius of the accretion shock slowly shrinks. From Fig. 9, we see that the total neutrino luminosity is well above during much of the simulation. Such high neutrino luminosities suggest the possibility of a supernova-like explosion or perhaps a GRB (Fuller & Shi, 1999).
However, inside the proto-black hole, scattering and absorption dominate the neutrino opacity and beyond the 1000 neutrinosphere, the density of neutrinos is too low to allow significant numbers to annihilate. The neutrino density is roughly , over an order of magnitude lower than the lowest neutrino density considered by Popham, Woosley, & Fryer (1999) for black hole accretion disks. In addition, the bulk of the neutrinos emitted by the 300 model are a) traveling radially and the neutrino cross-section is only large for head-on collisions and b) and neutrinos which have lower neutrino annihilation cross-sections. Combining all of these effects, neutrino annihilation injects less than into the infalling material. Given that the binding energy of the material piling up at the accretion shock is over , we conclude that neutrino annihilation does not drive an explosion. Neutrinos interacting with nucleons and scattering on electrons were also included in the calculation and these too provided totally insufficient energy to reverse the infall.
However, shortly after the black hole forms, the accretion shock moves inwards and angular momentum becomes more important. An accretion disk will eventually form and that may produce an explosion. Thus, it is important to determine when the black hole forms. As the proto-black hole contracts, its inner core is slowly compressed down to the event horizon. As with the non-rotating model, we follow the collapse until the material is compressed down to the radius of the marginally stable circular orbit (e.g., Shapiro & Teukolsky 1983):
| (1) |
where
| (2) |
| (3) |
and and are the dimensionless angular momentum and mass of the black hole. At any given radius in the proto-black hole, we calculate both and and can thus determine when that radius falls below the marginally stable orbit. When this happens, we stop the simulation and remove all of the particles within that radius. The total mass of these particles forms the initial black hole mass. In this manner, although we do not physically model the collapse to a black hole, we get roughly both the correct time of collapse and the correct initial black hole mass (Table 1).
Or do we? Recall that our collapsing star has a large amount of angular momentum. As it collapses, local conservation of angular momentum causes it to spin up. As long as the rotational energy is less than of the gravitational potential energy, the proto-black hole is stable against triaxial deformation. However, when , instabilities can occur (e.g. Shapiro & Teukolsky 1983). By plotting the energy ratios () as a function of radius for the proto-black hole 0.5 , and 0 before black hole collapse, we see that much of the rotating proto-black hole is unstable to triaxial deformations (Fig. 10). The growth time for such instabilities is (Schutz 1983):
| (4) |
where is the rotational velocity at radius . Figure 10 also shows the instability growth time versus mass 0.5 and 0 before the collapse of the proto-black hole. According to our analysis, instabilities would have time of grow in our rotating models, possibly forming smaller clumps which would collapse and then merge to form the central black hole (Bond et al. 1984). By comparing the growth time to the time to collapse for both our rotating models, we can estimate the range of masses in the proto-black hole which might develop these instabilities (Table 1). Equation (4) is not sufficiently accurate to decisively prove that such instabilities will develop before the proto-black hole collapses and such verification awaits three-dimensional simulations which can model the star over tens to hundreds of orbits. Even if these instabilities occur, they will not affect the accretion onto the black hole significantly (Sect. 5) because the individual clumps will merge and form a central black hole at roughly the same time as our assumed stable model.
Although the qualitative picture we have described is the same for both rotating models (B and C), the actual formation time of the black hole differs considerably. This is because in Model C, angular momentum is transported out of the core using the -disk prescription. This lowers the spin of the black hole () which increases the radius of the marginally stable orbit () and ultimately causes the black hole to form more quickly. By choosing a high disk viscosity (), our Model C estimates the extreme effect of viscosity and the true answer probably lies between Models B and C. Fortunately, these differences do not affect our quantitative estimates of gravitational wave emission or GRT energies (Sections 4 and 5).
4 Gravitational Waves
Even if the core does not break into several pieces, because exceeds the secular instability criterion (), the star may still develop a bar-like configuration. Gravitational wave emission for rotating bodies in the context of supernova collapse has been studied in great detail (see Zwerger & Müller 1997 or Rampp, Müller, & Ruffert 1998 for reviews). We will use here the expressions derived by Zwerger & Müller for the quadrupole wave amplitude, the gravitational wave field () and the total gravitational energy emitted (equations 20-22 of Zwerger & Müller 1997). In all of our simulations, peaks near 1.5 , nearly 4 orders of magnitude greater than most of the simulations of core-collapse supernovae by Zwerger & Müller (1997). The amplitude of the corresponding waveform is also high: . Recall that 300 stars are only likely to form at very high redshifts (), corresponding to distances beyond 7.5 for . For most of these stars, . The total energy emitted in gravitational waves during the first few seconds of collapse is . During this time, a 100 black hole forms and roughly % of its rest mass energy is converted into gravitational waves. Like the neutrino emission, our calculation of the energy lost to gravitational waves is much smaller than that predicted by Bond et al. (1984). However, if the core of the proto-black hole breaks up into pieces, the gravitational wave emission could be much larger.
We have only scratched the surface of our understanding of the collapse of these massive stars, but already they show some potential as sources of powerful gravitational waves. Unfortunately, the development of secular instabilities requires the ability to model the proto-black hole over many orbital periods in three dimensions. While we can follow the collapse all the way to black hole formation in two dimensions, the development of instabilities (and a more accurate estimate of gravitational wave emission) awaits future three-dimensional simulations. We would be happy to provide any of our models to researchers who would like to attempt this problem.
5 Black Hole Accretion and Gamma-Ray Transients
Once a black hole has formed, the rest of the dense inner core quickly collapses inside, but in the rotating models, some material along the equator is slowed by centrifugal force. If there is sufficient angular momentum to form an accretion disk, this material will be slowed and pile up outside the hole. The disk that forms would be similar to those studied by Popham et al. (1999). Such black hole accretion disk systems are believed to power gamma-ray bursts, either through neutrino annihilation or magnetic field powered jets. To assess whether the collapse of 300 stars might produce some sort of gamma-ray transient, we must first calculate the disk and black hole properties.
We follow the accretion into the black hole by placing an absorptive inner boundary in the core at the marginally stable orbit. As particles move inside the marginally stable orbit (), their mass and angular momentum is added to the black hole. The boundary condition corresponding to the last stable orbit also expands as the black hole gains mass. For the non-rotating model, almost all of the potential energy of the accreting material was carried into the black hole (recall Fig. 4). Even in the rotating models, much of the star collapses onto the black hole before a stable accretion disk can form. When angular momentum is conserved locally (Model B, Fig. 11), a stable disk forms only after roughly 140 of the star has accreted (Fig. 11).
To produce a GRT, energy generated in the disk and transported, either by neutrino emission or magnetohydrodynamical processes to matter above and below the black hole along the rotational axis, must generate sufficient pressure and momentum to reverse the implosion of material accreting along the poles (MacFadyen & Woosley, 1999). The evolution of the polar accretion and disk accretion rates and the efficiency for this transport thus dictate if and when an explosion is likely to occur. Figure 12 shows the total accretion rates for our three simulations along with an analytic estimate assuming the mass falls in at the free-fall time:
| (5) |
This analytical estimate does not take into account pressure forces or angular momentum, both of which affect the accretion rate. The accretion rate in the non-rotating model shows a large dip in the accretion rate over the mass range between . This occurs because nuclear burning injects energy into the collapsing material and slows its infall. This effect is not seen in the rotating models because the material in the proto-black hole burns into iron elements before the formation of the black hole. Later, after black hole formation, the material does not have this additional reservoir of energy. The accretion rate decreases at lower black hole masses in the rotating models because some of the material has enough angular momentum to support itself in a disk.
In both of our rotating simulations, a disk forms in a wedge extending up to 35-40∘ above the equator. When we include angular momentum transport (Model C), the angular momentum in the outer layers of the helium core increases (as these layers gain angular momentum from the core), and the disk in Model C is initially larger both in extent and mass than in the conserved case (Model B). Although the material in the disk falls much slower into the black hole than along the poles, the density in the disk quickly becomes so much higher than in the polar regions that it dominates the accretion onto the black hole (beyond a black hole mass of 120 , disk accretion makes up of the black hole accretion). By the time the total accretion rate drops below 10 , the accretion along the polar region (the entire region beyond the 40∘ disk) accretes less than 3 and this rate is dropping rapidly. Unfortunately, our limited resolution makes it difficult for us to follow the accretion rate when it falls below a few . In Model B (where the angular momentum is locally conserved), the accretion rate in the disk will drop as abruptly as the rate in the poles as the disk becomes entirely supported by centrifugal forces. However, when we include angular momentum transport (Model C), the disk will continue to accrete at a rate of (for an ) until the entire disk has accreted onto the black hole.
It is unlikely that any jet will form before the polar regions clear and the accretion rate along the poles drops below some critical rate. This critical rate depends upon the mechanism used to power the explosion. For the neutrino-driven mechanism, the accretion rate in the polar region must drop below 1-10 so that the infalling material is optically thin to neutrinos. When the total accretion rate falls below 10 , corresponding to an accretion rate in the 50∘ polar region of 2-3 , the conditions around the black hole may drive a GRB explosion. At this time, we can compare the properties of our black hole accretion disk systems with those models produced by Popham et al. (1999). The black hole mass and spin for both our rotating models are listed in Table 1. The total disk mass available for rapid accretion is roughly .
Popham et al. (1999) considered black hole masses between 3 and 10 . The efficiency at which neutrino annihilation converts the gravitational potential energy released into fireball energy drops dramatically as the black hole mass increases. As the event horizon increases, a) the density and temperature in the disk decreases, decreasing the total neutrino flux and neutrino energy and b) the volume of the annihilation region increases, reducing the neutrino density. From Popham et al. (1999) we find that the neutrino annihilation conversion efficiency goes roughly as where is roughly 2-3. Even if the disk accretes at a rate of 10 , the energy deposited by neutrino annihilation will not be high enough to drive an explosion. Note that in our simulations, the accretion rate through the disk in all of our simulations is less than 10 when the polar region has cleared.
Jets driven by magnetic fields may produce a strong explosion though. It is difficult to make any quantitative predictions about magnetic-field driven GRBs, simply because the exact mechanism is not well understood. However, by the time the total accretion rate has dropped below 10 , a well-defined disk has formed, which is required for most of the GRB engines driven by magnetic fields. The total potential energy available to drive an explosion is , where the potential efficiency of the accretion disk () is for . Assuming that the efficiency of our magnetic field driven explosion () is 0.1, the yield from Models B and C are 6 and , respectively. Beamed into 1 % of the sky, these bursts would have inferred isotropic explosion energies of nearly , easily visible at redshift 10 and roughly an order of magnitude more energetic than ordinary collapsars.
The time scale for these bursts can be crudely estimated from the -disk model (Shakura & Sunyaev 1973), , with , the disk viscosity parameter, , the Keplerian angular velocity, and and the radius and thickness of the disk, respectively. For (Fig. 11) and , the time scale is very roughly 10 , but there is considerable uncertainty in both and the other parameters of this equation. That this value is approximately equal to the duration of many common GRBs is probably coincidental, especially given the large redshift and time dilation we expect for 300 stars at death (Sect. 2). However, it does suggest the possibility of other forms of GRTs with time scales of perhaps minutes and a hard x-ray spectrum. Such an energetic jet would also likely disrupt the star in a gigantic “hypernova” explosion.
If it does not, then the outer part of the hydrogen envelope will accrete in about a day and has enough angular momentum to form a disk (Fig. 2). This may make an even longer fainter transient of some sort and may be an important source of X-ray photons in the early universe.
References
- (1) Abel, T., Bryan, G. L., & Norman, M. L. 2000, ApJ, in press, astro-ph/0002135
- (2) Appenzeller, I. 1970, A&A, 5, 355
- (3) Appenzeller, I. 1986, in Luminous stars and associations in Galaxies, eds. H. J. G. L. M. Lamers, C. W. H. De Loore, Reidel, Dordrecht, p. 55
- (4) Barkat, Z., Rakavy, G., & Sack, N. 1967, Phys. Rev. Lettr., 18, 379
- (5) Bond, J. R., Arnett, W. D., & Carr, B. J. 1984, ApJ, 280, 825
- (6) Bromm, V., Coppi, P. S., & Larson, R. B. 1999, ApJL, 527, L5
- (7) Carr, B. J., Bond, J. R., & Arnett, W. D. 1984, ApJ, 277, 445
- (8) Carr, B. J., & Rees, M. J. 1984, MNRAS, 206, 315
- (9) Fryer, C.L., Benz, W., Herant, M., Colgate, S.A., 1999, ApJ, 516, 892
- (10) Fryer, C.L., Woosley, S.E., & Hartmann, D.H., 1999, ApJ, 526, 152
- (11) Fryer, C.L., & Heger, A., 2000, ApJ, 541, 000 in press
- (12) Fuller, G. M., & Shi, X. 1998, ApJL, 502, L5
- (13) Glatzel, W., El Eid, M. F., & Fricke, K. J. 1985, A&A, 149, 413
- Heger et al. (2000a) Heger, A., Langer, N., Woosley, S. E. 2000, ApJ, 528, 000, in press
- Heger et al. (2000b) Heger, A., & Woosley, S. E. 2000, ApJ, in preparation
- Herant et al. (1994) Herant, M., Benz, W., Hix, W.R., Fryer, C.L., Colgate, S.A. 1994, ApJ, 435, 339
- Kudritzki (1999) Kudritzki, R.-P. 1999, in The First Stars, eds. A. Weiss, T. Abel and V. Hill, Proceedings of the 2nd ESO/MPA conference, Springer, Heidelberg, in press
- Larson (1999) Larson, R.B., to be published in the ESA Special Publications Series (SP-445), edited by F. Favata, A. A. Kaas, and A. Wilson, astro-ph/9912539
- MacFadyen, & Woosley (1999) MacFadyen, A., & Woosley, S. E. 1999, ApJ, 524, 262
- MacFadyen, Woosley, & Heger (1999) MacFadyen, A., Woosley, S. E., & Heger, A. 2000, ApJ, submitted, astro-ph/9910034
- Ostriker & Gnedin (1996) Ostriker, J. P., & Gnedin, N. Y. 1996, ApJL, 472, L63
- (22) Paczynski, B. 1998, ApJL, 494, 45
- (23) Popham, R., Woosley, S. E., & Fryer, C. 1999, ApJ, 518, 356, astro-ph/9807028
- (24) Rampp, M., Müller, E., & Ruffert, M. 1998, A&A, 332, 969
- (25) Schutz, B.F. 1983, Lectures in Applied Mathematics, 20, 99, ed. N.R. Lebovitz
- (26) Schwarzschild, M., & Härm, R. 1959, ApJ, 129, 637
- (27) Shapiro, S.L., & Teukolsky, S.A. 1983, “Black Holes, White Dwarfs, and Neutron Stars”, Wiley & Sons, Inc., New York, p. 357
- (28) Shakura, N. I. & Sunyaev, R. A. 1973, A&A, 24, 337
- (29) Silk, J. 1983, MNRAS, 205, 705
- Weaver et al. (1978) Weaver, T. A., Zimmerman, G. B., & Woosley, S. E. 1978, ApJ, 225, 1021
- (31) Woosley, S. E. 1986, in Nucleosynthesis and Chemical Evolution, 16th Advanced Course, Saas-Fe, eds. B. Hauck, A. Maeder, & G. Meynet, (Geneva Observatory: Switzerland), p. 1
- (32) Woosley, S. E., & Weaver, T. A. 1982, in Supernovae: A Survey of Current Research, eds. M.J. Rees and R.J. Stoneham, Dordrecht: Reidel, p.. 79
- (33) Woosley, S. E., & Weaver, T. A. 1995, ApJS, 101, 181
- (34) Zwerger, T., & Müller, E. 1997, A&A, 320, 209
| ModelaaModel A neglects rotation. Model B assumes the initial rotation of the progenitor model and conserves locally the angular momentum for the duration of the simulation. Model C uses the same initial rotation as Model B, but evolves the angular momentum using an -disk prescription (). | bbTime elapsed after the simulation is mapped from the KEPLER output. | |||||||
|---|---|---|---|---|---|---|---|---|
| () | (s) | () | () | (s)ccThe “disk” quantities (last 3 columns) refer to the time, black hole mass, and black hole rotation at which the accretion rate drops below 10 . | ()ccThe “disk” quantities (last 3 columns) refer to the time, black hole mass, and black hole rotation at which the accretion rate drops below 10 . | ccThe “disk” quantities (last 3 columns) refer to the time, black hole mass, and black hole rotation at which the accretion rate drops below 10 . | ||
| A | - | 1.75 | 13 | 0 | - | - | - | - |
| B | 5-40 | 3.7 | 35 | 0.73 | 90 | 3.5 | 136 | 0.74 |
| C | 12-35 | 2.8 | 13 | 0.55 | 70 | 3.6 | 122 | 0.72 |