The Nature of the Hard X-ray Background Sources: Optical, Near-infrared, Submillimeter, and Radio Properties
Abstract
With recent Chandra observations, at least 75 percent of the X-ray background in the keV energy range is now resolved into discrete sources. Here we present deep optical, near-infrared, submillimeter, and 20 cm (radio) images, as well as high-quality optical spectra, of a complete sample of 20 sources selected to lie above a keV flux of erg cm-2 s-1 in a deep Chandra observation of the Hawaii Deep Survey Field SSA13. The 13 galaxies with have redshifts in the range 0.1 to 2.6. Two are quasars, five show AGN signatures, and six are luminous early galaxies whose spectra show no obvious optical AGN signatures. The seven spectroscopically unidentified sources have colors that are consistent with evolved early galaxies at .
Only one hard X-ray source is significantly detected in an ultradeep submillimeter map; from the submillimeter to radio flux ratio we estimate a millimetric redshift in the range . None of the remaining 19 hard X-ray sources is individually detected in the submillimeter. These results probably reflect the fact that the 850 m flux limits obtainable with SCUBA are quite close to the expected fluxes from obscured AGN. The ensemble of hard X-ray sources contribute about 10% of the extragalactic background light at submillimeter wavelengths.
From the submillimeter and radio data we obtain bolometric far-infrared luminosities. The hard X-ray sources have an average ratio of bolometric far-infrared to keV luminosity of about 60, similar to that of local obscured AGN. The same ratio for a sample of submillimeter selected sources is in excess of ; this suggests that their far-infrared light is primarily produced by star formation.
Our data show that luminous hard X-ray sources are common in bulge-dominated optically luminous galaxies with about 10% of the population showing activity at any given time. We use our measured bolometric corrections with the keV extragalactic background light to infer the growth of supermassive black holes. Even with a high radiative efficiency of accretion (), the black hole mass density required to account for the observed light is comparable to the local black hole mass density.
Subject headings:
cosmology: observations — galaxies: distances and redshifts — galaxies: evolution — galaxies: formation — galaxies: active — quasars: general1. Introduction
After more than 35 years of intensive work, the origin of the hard X-ray background (XRB) is still not fully understood. The XRB photon intensity, , with units photons cm-2 s-1 keV-1 sr-1, can be approximated by a power-law, , where is the photon energy in keV. The HEAO1 A-2 experiment (Marshall et al. 1980) found that the XRB spectrum from keV is well described by a photon index , and this result has been confirmed and extended to lower energies by recent analyses of ASCA (Chen, Fabian, & Gendreau 1997; Gendreau et al. 1995; Miyaji et al. 1998; Ishisaki et al. 1998) and BeppoSAX (Vecchi et al. 1999) data. At soft ( keV) X-ray energies, 70 to 80 percent of the XRB is resolved into discrete sources by the ROSAT satellite (Hasinger et al. 1998). Most of these sources are optically identified as unobscured active galactic nuclei (AGN) with spectra that are too steep to account for the flat XRB spectrum (Schmidt et al. 1998). Thus, an additional population of either absorbed or flat spectrum sources is needed to make up the background at higher energies.
XRB synthesis models, constructed within the framework of AGN unification schemes, were developed to account for the spectral intensity of the XRB and to explain the X-ray source counts in the hard and soft energy bands (e.g., Setti & Woltjer 1989; Madau, Ghisellini, & Fabian 1994; Matt & Fabian 1994; Comastri et al. 1995; Zdziarski et al. 1995; Gilli, Risaliti, & Salvati 1999; Wilman & Fabian 1999; Miyaji, Hasinger, & Schmidt 2000). In the unified scheme, the orientation of a molecular torus surrounding the nucleus determines the classification of a source. The models invoke, along with a population of unobscured type-1 AGN whose emission from the nucleus we see directly, a substantial population of intrinsically obscured AGN whose hydrogen column densities of cm-2 around the nucleus block our line-of-sight.
A significant consequence of the obscured AGN models is that large quantities of dust are necessary to cause the obscuration. The heating of the surrounding gas and dust by the nuclear emission from the AGN and the subsequent re-radiation of this energy into the rest-frame far-infrared (FIR) suggests that the obscured AGN should also contribute to the source counts and backgrounds in the FIR and submillimeter wavelength regimes (Almaini, Lawrence, & Boyle 1999; Gunn & Shanks 2000).
Due to instrumental limitations, the resolution of the XRB into discrete sources at hard energies had to wait for the arcsecond imaging quality and high-energy sensitivity of Chandra. Deep Chandra imaging surveys are now detecting sources in the keV range that account for 60 to 80 percent of the hard XRB (Mushotzky et al. 2000, hereafter MCBA; Giacconi et al. 2001; Garmire et al. 2001), depending on the XRB normalization. The mean X-ray spectrum of these sources is in good agreement with that of the XRB below 10 keV. Furthermore, because of the excellent X-ray positional accuracy of Chandra, counterparts to the X-ray sources in other wavebands can be securely identified (MCBA; Brandt et al. 2000; Giacconi et al. 2001). In this paper we determine spectroscopic redshifts and optical, near-infrared (NIR), submillimeter, and radio properties of a complete hard X-ray sample drawn from the MCBA deep Chandra observations of the Hawaii Deep Survey Field SSA13. We take km s-1 Mpc-1 and use a , cosmology throughout.
2. Sample and Observations
The present study is based on a 100.9 ks X-ray map of the SSA13 field that was observed with the ACIS-S instrument on the Chandra satellite in December 1999 and presented in MCBA. The position RA(2000), Dec(2000) was placed at the aim point for the ACIS-S array (chip S3). Two energy-dependent images of the back-illuminated S3 chip and the front-illuminated S2 chip were generated in the hard ( keV) and soft ( keV) bands. MCBA chose the hard band energy range to be keV to facilitate comparisons with ASCA data. In the present paper we likewise use the keV range. Other recent Chandra studies of the XRB have used either the keV range (Brandt et al. 2000; Hornschemeier et al. 2000) or the keV range (Fabian et al. 2000; Giacconi et al. 2001) to minimize the backgrounds.
We provide here a detailed description of the data reduction techniques that were employed by K. Arnaud in December 1999 to analyze the SSA13 Chandra image for the MCBA paper. Improved X-ray data analysis techniques will be presented in Arnaud et al. (2001).
The X-ray images were prepared with xselect and associated ftools at GSFC. ACIS grades 0, 2, 3, 4, and 6 were used, and columns at the boundaries of the readout nodes, where event select does not work properly, were rejected. For the S3 chip the light curve was examined and times with high backgrounds were rejected, giving a total exposure of 95.9 ks; for the S2 chip the full time of 100.9 ks was used. The images were examined in chip coordinates to identify and remove bad columns and pixels. For S3 the spectrum of the entire chip was extracted and the Si fluorescence line was used to determine the gain. For the front-illuminated S2 chip radiation damage caused a systematic change in gain and spectral resolution across the chip. An observation from the Chandra Archive of the in-flight calibration sources was analyzed to determine an approximate correction for the spatial gain dependence. The PHA values were divided by (1-CHIPY*0.0002) to correct the gross gain variation. The remaining systematic changes on the fluxes are small compared to statistical uncertainties. The calibration sources were also used to determine the conversion from adjusted PHA to energy.
Once the images in the keV and keV energy bands were generated for the chips, a simple cell detection algorithm was used to find the sources. The field area was stepped through in steps, and the counts within a diameter aperture (chosen to maximize the enclosed source counts throughout the image without becoming substantially background dominated) were measured, together with the background in a radius annulus around each position. The average background was 4.7 counts in a cell in the keV S3 image and 1.5 counts in the keV S2 image. The distribution of counts is Poisson. A cut of 17 counts in the keV S3 image and 10 counts in the S2 image ensures that there is less than a 20% probability of a single spurious source detection in the entire sample. The background subtracted counts were searched for all positions within of the optical axis that satisfied the appropriate count criteria. The source counts were next corrected for the enclosed energy fraction within the aperture; the correction is small for this choice of off-axis radius and was determined from a second-order polynomial fit to the ratio of the to diameter aperture counts as measured from the brighter sources in the hard and soft band images. The final positions were obtained with a centroiding algorithm that determined the center of light of the X-ray sources.
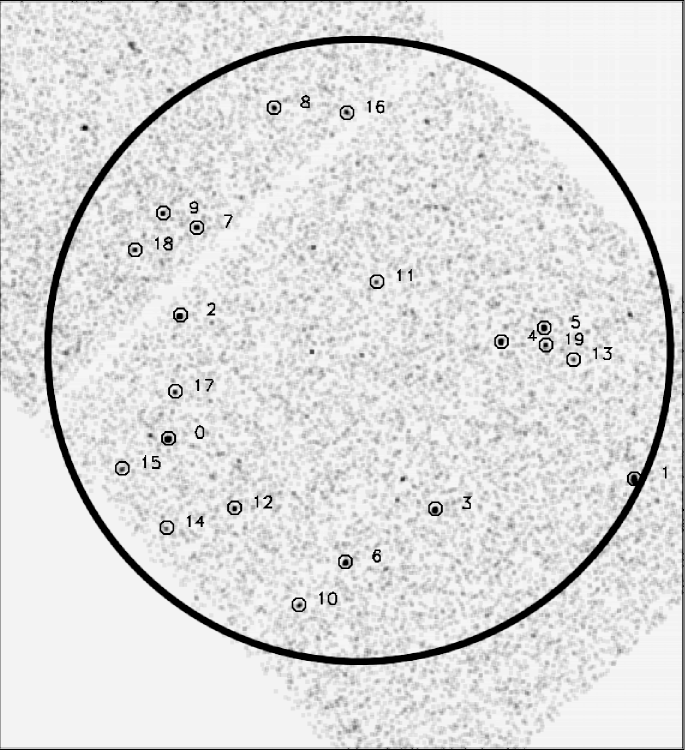
The initial source positions were determined from the Chandra aspect information, but with a plate scale of per pixel. The absolute pointing was then refined using the 10 sources with radio counterparts (see § 2.4). The offsets are W and N with no roll angle correction. With the offsets applied, the dispersion between the radio and X-ray positions for the 10 sources is . The present positions should be more accurate than those given in MCBA. Figure 1 shows the Chandra hard band image of SSA13 with the source positions identified by the small circles. The large circle illustrates the radius region used in this paper.
The conversion from counts to flux depends on the shape of the source spectrum. For a power-law spectrum with a photon index , the counts [photons s-1] in an energy band to are given by , where is the effective detector area at energy . Once the normalization of the spectrum, , is determined from the observed counts, the flux in the keV band is where . The energy index is .
Often (typical of unabsorbed soft band sources) is assumed; however, in the absence of a correction for the actual opacity, such a procedure underestimates the average conversion of counts to hard X-ray flux. An alternative approach is to determine the value of for each source from the ratio of soft to hard band counts, . We adopt this approach here; however, because there is substantial uncertainty in the individual source values, we use the counts-weighted mean photon indices of 1.2 (hard) and 1.4 (soft) to determine the hard and soft band fluxes. Our procedure has the advantage of giving the correct conversion for the ensemble of sources and therefore a correct comparison with the hard XRB, but it will result in errors in individual source determinations. The typical error is not large; for example, a source with an actual spectrum would have its keV flux overestimated by a factor of 1.35. A subsequent paper (Arnaud et al. 2001) will give the derived fluxes using the best fit spectral parameters to the individual sources.
For the S3 chip, the final flux calibrations were made using an array of effective areas versus energy at 12 positions. For the S2 chip a single conversion factor of erg cm-2 count-1 was used in the keV band and erg cm-2 count-1 in the keV band.
To check our conversion of counts to flux, we extracted the public ASCA and Chandra observations of G21.5, a compact crab-like supernova remnant with a well-determined simple spectrum. The vast difference in angular resolution between ASCA and Chandra means that we can only make direct source flux comparisons for small () or point sources. We can also only make direct comparisons of data from instruments with different spectral resolutions for a simple spectrum source since there the transformation from source counts to flux is less model-dependent than it would be for a complex spectrum source. We derived the column density and power-law index for G21.5 from the Chandra S3 data and found that the values agreed well with the ASCA values. The measured Chandra flux was within 10% of the ASCA flux. At present there are no other time-stable compact or point sources with simple spectra in the public database that can be used for such a comparison.
We selected all sources that were more than from the chip edges and that have keV fluxes greater than erg cm-2 s-1, corresponding to the above counts cut-offs and the appropriate calibrations. This detection threshold is slightly higher than the value quoted in MCBA ( erg cm-2 s-1) in order to obtain a complete flux-limited sample that is uniform over our radius area on the S2 and S3 chips. Table 1 details the 20 sources in the resulting 57 arcmin2 area, ordered by decreasing hard X-ray flux. The first six columns in Table 1 include the source identifications (the MCBA identifications are given in parentheses), RA(2000), Dec(2000), keV flux, keV flux, and the value of required to match the ratio of the soft to hard X-ray fluxes in the absence of opacity. The remaining entries in Table 1 are discussed in subsequent sections.
While the low total X-ray source counts of most of our sources precludes a detailed analysis on an object-by-object basis, all of our sources are consistent with the Chandra PSF. They also all have rather hard X-ray spectra that are consistent with power-law or keV thermal spectra (Arnaud et al. 2001). Thus, the sources are not likely to be emission from groups of galaxies. The size constraints on the sources are not sufficiently restrictive to discriminate between X-ray binaries, hot gaseous atmospheres, or AGN as the source of the X-ray emission. We note that an improved comparison between the expected and observed images shows that object CXO J131159.3+123928 (source 1 in the present sample), which was thought to be extended by MCBA, is in fact consistent with being a point source.
2.1. Optical and Near-infrared Imaging
We used the Low-Resolution Imaging Spectrometer (LRIS; Oke et al. 1995) on the Keck 10 m telescope in March 1997, February 1998 and 1999, and February and March 2000 to obtain -band and -band images that cover the Chandra SSA13 field.
Wide-field and deep observations were obtained over a number of runs using the University of Hawaii Quick Infrared Camera (QUIRC; Hodapp et al. 1996) on the 2.2 m University of Hawaii (UH) telescope and the 3.6 m Canada-France-Hawaii Telescope. The ( m) filter is described in Wainscoat & Cowie (2001). The astrometry for the image was established by fitting a linear solution to the 75 VLA sources (see § 2.4) with bright counterparts in the NIR image. The solution has a plate scale of per pixel and a rotation of deg from a standard N-E orientation. The dispersion of the radio and NIR positions is . Using a large overlap sample of sources in the optical and NIR images, a third-order polynomial fit to the distortion in each LRIS and image was determined. Using the 90 VLA sources with bright counterparts in the corrected image, we find a dispersion of between the radio and optical positions.
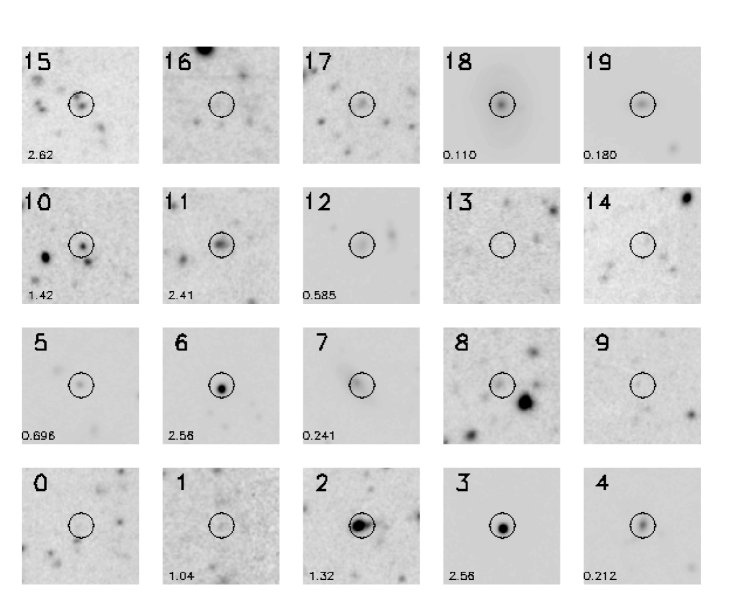
The excellent X-ray positional accuracy permits the secure identification of the optical counterparts to the X-ray sources. Figure 2 shows thumbnail -band images of all 20 hard X-ray sources listed in Table 1. (Thumbnail -band images can be found in MCBA.) In selecting the optical counterparts, we considered only sources within a radius of the nominal X-ray position. The optical separations are given in column 10 of Table 1. Sixteen of the sources have one such counterpart, and none has more than one. None of the offsets exceed , and the dispersion of the offsets is . Monte Carlo simulations with a randomized sample show that the average number of spurious identifications with an optical counterpart within is 0.5. At 95 percent confidence, less than 2 of the 16 identifications are spurious. For the 16 sources the magnitudes were measured at the optical center; for the remaining sources, the magnitudes were measured at the nominal X-ray position. For most of the sources the magnitudes were measured in diameter apertures and corrected to approximate total magnitudes using an average offset (Cowie et al. 1994); henceforth, we refer to these as corrected diameter magnitudes. However, for the bright extended sources (7, 18, 19) we used diameter aperture magnitudes and applied no correction; these magnitudes may be as much as a magnitude brighter than the corrected diameter magnitudes given in MCBA. The , , and magnitudes are given in columns 7, 8, and 9 of Table 1. The limits are approximately and . The limits for the magnitudes are not uniform over the field and are given individually in parentheses after the magnitudes in Table 1.
2.2. Keck Spectroscopy
We obtained high quality optical spectra for 19 of the 20 hard X-ray sources using LRIS slit-masks on the Keck 10 m in March and April 2000. Source 14 was not observed because of mask design constraints. For the sources with counterparts, we positioned the slit at the optical center. For the remaining sources, we positioned the slit at the X-ray centroid position. We used wide slits and the 300 lines mm-1 grating blazed at 5000 Å, which gives a wavelength resolution of Å and a wavelength coverage of Å. The wavelength range for each object depends on the exact location of the slit in the mask but is generally between and 10000 Å. The observations were 1.5 hr per slit mask, broken into three sets of 0.5 hr exposures. Fainter objects were observed a number of times; the longest exposure was 6 hrs. Conditions were photometric with seeing FWHM. The objects were stepped along the slit by in each direction, and the sky backgrounds were removed using the median of the images to avoid the difficult and time-consuming problems of flat-fielding LRIS data. Details of the spectroscopic reduction procedures can be found in Cowie et al. (1996).
We successfully obtained redshift identifications for all 13 sources brighter than mag; the spectra are shown in Fig. 3, and the redshifts are given in column 11 of Table 1. We classify the spectra into three general categories: (i) quasars (broad-line sources), (ii) AGN (narrow and weak-line sources), and (iii) optically ‘normal’ galaxies (no AGN signatures in the optical). Henceforth, we denote these categories by q, a, and n, respectively. We also denote spectroscopically unidentified sources by u and our one source with a millimetric redshift (see § 6.1) by m.
Two sources (sources 3 and 6) are the quasars previously known to be in the field (Windhorst et al. 1995; Campos et al. 1999). Their spectra are very similar, and both coincidentally lie at . These quasars are radio quiet.
Five sources (1, 2, 5, 11, and 15) show emission line characteristics that may be indicative of AGN activity. Sources 1 and 5 show [O II], Ne III], and weak Ne V] emission, along with Ca H and K and G-band absorption. Sources 11 and 15 show narrow Ly and CIV emission. Source 2 shows a P-Cygni profile in Mg II and broad absorption in Fe II.
Six sources (4, 7, 10, 12, 18, and 19) show no indication of an active nucleus in their optical spectra. We call these ‘normal’ galaxies since they have absorption and emission line properties which are common in optically selected field samples. Source 4 shows H and weak [O II] and [O III] emission and H absorption. Source 7 shows H, [O II], and [O III] emission and H absorption. Source 10 shows narrow [O II] emission and Mg II absorption. Source 12 has weak [O II] and H emission and strong [O III] absorption. There may be hints of NeIII] and NeV]. Source 18 is rather unusual in that it has no H while N II and S II are in emission. A high N II/H ratio has been used to classify objects as AGN (Keel et al. 1985), but the absence of H in source 18 is difficult to understand: in Veilleux & Osterbrock (1987) the highest ratio of NII to H is 3:1, and no photoionization models (Ferland & Netzer 1983) have ratios larger than 2:1. Source 19 has H emission but otherwise only absorption features.
Optically ‘normal’ X-ray luminous galaxies were thought to be relatively rare, unusual objects, perhaps explained by beaming (Elvis et al. 1981; Moran et al. 1996; Tananbaum et al. 1997). They are hard to find by association since small X-ray error boxes are required to be certain of their identification (e.g., discussion in Schmidt et al. 1998). The very large surface density of such sources in our sample, deg-2, indicates that they are common. In fact, in our sample they are much more common than quasars. There are two plausible explanations for the lack of observed optical AGN characteristics: i) absorption due to dust and gas or ii) an actual lack of ultraviolet/optical emission, as is the case in many low luminosity objects (Ho et al. 1999). The line of sight column densities inferred from the X-ray spectra in § 3.1 are sufficiently large to obscure the optical AGN signatures, but the extent will depend on the geometry.
2.3. Submillimeter Observations
The submillimeter observations were made with the SCUBA instrument (Holland et al. 1999) on the James Clerk Maxwell Telescope. SCUBA jiggle map observations were taken in mostly excellent observing conditions during runs in February 1999 (7 observing shifts), February 2000 (0.5 shift), and May-June 2000 (3.5 shifts). The maps were dithered to prevent any regions of the sky from repeatedly falling on bad bolometers. The chop throw was fixed at a position angle of 90 deg so that the negative beams would appear on either side east-west of the positive beam. Regular “skydips” (Lightfoot et al. 1998) were obtained to measure the zenith atmospheric opacities at 450 and 850 m, and the 225 GHz sky opacity was monitored at all times to check for sky stability. The median 850 m optical depth for all nights together was 0.185. Pointing checks were performed every hour during the observations on the blazars 1308+326 or cit6. The data were calibrated using diameter aperture measurements of the positive beam in beam maps of the primary calibration source Mars and the secondary calibration sources OH231.8, IRC+10216, and 16293-2422.
The data were reduced in a standard and consistent way using the dedicated SCUBA User Reduction Facility (SURF; Jenness & Lightfoot 1998). Due to the variation in the density of bolometer samples across the maps, there is a rapid increase in the noise levels at the very edges. The low exposure edges were clipped from our images.
The SURF reduction routines arbitrarily normalize all the data maps in a reduction sequence to the central pixel of the first map; thus, the noise levels in a combined image are determined relative to the quality of the central pixel in the first map. In order to determine the absolute noise levels of our maps, we first eliminated the real sources in each field by subtracting an appropriately normalized version of the beam profile. We then iteratively adjusted the noise normalization until the dispersion of the signal-to-noise ratio measured at random positions became . Our noise estimate includes both fainter sources and correlated noise.
We centered on the positions of the hard X-ray sources and measured the submillimeter fluxes using beam-weighted extraction routines that include both the positive and negative portions of the chopped images, thereby increasing the effective exposure times. The 850 m submillimeter fluxes and uncertainties are summarized in column 12 of Table 1. For most of the objects the level is in the mJy range; however, for the two sources in the region where there is an ultradeep SCUBA image (Barger et al. 1998) the detection threshold is mJy.
2.4. Radio Observations
A very deep 1.4 GHz VLA radio map of the SSA13 region was obtained by Richards et al. (2001) using an 100 hr exposure in the A-array configuration. The primary image covers a diameter region with an effective resolution of and a limit of 25 micro-Jansky (Jy). The radio fluxes were measured in boxes centered on the X-ray positions; these fluxes are given in column 13 of Table 1. Of the 20 hard X-ray sources, 16 are detected in the radio above a threshold of 15 Jy, including 10 of the 13 sources with spectroscopic redshifts. The radio-X-ray offsets are given in column 14 for the 10 sources with radio detections within of the X-ray source. The absolute radio positions are known to rms. The dispersion between the radio and X-ray positions is , and the maximum separation is . The radio to optical ratios for the hard X-ray sources are consistent with the sources being radio quiet. The radio properties will be discussed in more detail in Richards et al. (2001).
3. X-ray Properties of the Hard X-ray Sample
3.1. Optical Depths

With the exception of two ‘normal’ galaxies with , the photon indices given in Table 1 range from to . The two quasars have and , consistent with most unabsorbed soft band sources, whereas most of the remaining sources have photon indices that suggest substantial line-of-sight optical depths.
If we generate counts-weighted mean photon indices for each population separately, we find 0.8 for the ‘normal’ galaxies, 0.9 for the AGN, 1.8 for the two quasars, and 1.2 for the spectroscopically unidentified sources. The ‘normal’ galaxies are presumably those where the AGN are the most highly obscured. Since the effective column density, , for observed-frame absorption in a source is related to the true hydrogen column density, , by , flux corrections for absorption effects become less important with increasing redshift. The spectroscopically unidentified sources are likely higher redshift analogs of the ‘normal’ galaxies (see § 4.2) but have softer spectra because of this redshift dependence of the absorption.
In Fig. 4 we plot the logarithm of the ratio of the soft to hard X-ray fluxes versus redshift. Throughout the paper we use the notation of filled diamonds for quasars, filled triangles for galaxies with AGN signatures, filled squares for galaxies with apparently ‘normal’ spectra, and open squares for spectroscopically unidentified sources. We overlay on the data fixed curves which we generated assuming an intrinsic power-law spectrum and photoelectic cross sections computed for solar abundances by Morrison & McCammon (1983). Over the energy range keV, which determines the correction for these column densities and redshifts, the cross-section, , can be well-approximated by a single power-law
with in keV. For all but one of the spectroscopically identified galaxies the X-ray flux ratios can be described by a rather narrow range of neutral hydrogen column densities from cm-2 to cm-2, although more sophisticated models with scattering could permit higher opacities. The values and the true power-law indices are best determined directly from the X-ray spectra, as shall be discussed in a subsequent paper (Arnaud et al. 2001).
Could the absence of sources with column densities above cm-2 be a selection effect? This is possible at low redshifts since the ratio of the absorbed to the actual keV flux drops rapidly for cm-2; however, at high redshifts this corresponds to larger values of than are observed (see Fig. 4). Even if we place all of the spectroscopically unidentified sources at , at most 3 of the 14 objects with have column densities above cm-2. The simplest interpretation of Fig. 4 is that we are seeing most of the obscured AGN in the present sample. However, Compton-thick sources might be missed completely from the keV sample, and these sources may be needed to explain the 30 keV peak in the XRB. Unfortunately, this issue cannot be decided until either more precise information is obtained on the energy distribution of the individual sources, which, in principle, could deviate from power-law behavior, or until we can analyze the hardness of even fainter keV sources.
3.2. Redshift Distribution

The redshift distribution of the spectroscopically identified sample is shown in Fig. 5, where we we plot the surface density of the sources in redshift bins (filled squares) with uncertainties. Below the data are consistent with a constant surface density. If we also include the unidentified sources spread uniformly through the to redshift interval (open squares), then the constancy with redshift becomes even more evident. The surface density is sources per square degree per bin or sources per square degree per unit redshift.
The present data sample is too small to justify a detailed examination of the luminosity function. However, the redshift distribution of the hard selected sample is very similar to that of previous soft selected samples with similar limiting sensitivities. We illustrate this in Fig. 5 by overplotting the redshift distribution of the Lockman Hole ROSAT sample of Schmidt et al. (1998) (filled diamonds). The limiting flux of this sample is erg cm-2 s-1 ( keV) which, for a source with , would correspond to a limiting flux of erg cm-2 s-1 ( keV), similar to our limiting flux of erg cm-2 s-1 ( keV). The absolute surface density of the soft sample is far below that of the hard sample, indicating that most of the hard X-ray sources are substantially obscured; however, the redshift distributions are rather similar. The luminosity function evolution of soft X-ray samples has been extensively analyzed and shows a rapid rise between and , followed by relative constancy at higher redshifts (Miyaji et al. 2000). While a proper analysis of the evolution of the keV luminosity function must await larger samples and a better understanding of the optical depths and K-corrections, the first impression is that the behavior will be similar to that inferred from the soft samples but with a much higher normalization of the luminosity function (about 7 times higher).
3.3. Luminosities
The intrinsic flux, , is related to the observed flux, , by
For an unabsorbed spectrum with the K-correction vanishes. An unabsorbed spectrum may be appropriate at the higher energies where opacity effects are not important. However, we believe that we can obtain a slightly improved estimate for the keV luminosities by allowing for the average effects of the opacity as follows. In calculating our hard X-ray luminosities, we normalized the flux at 4 keV for the spectrum to the flux at 4 keV calculated over the keV energy range for a spectrum with counts-weighted mean photon index (see § 2). Then
where is the keV flux of Table 1 computed with the same assumption. Our hard X-ray luminosities are given in column 3 of Table 3.3. If we had instead used , the computed keV fluxes would be lower by a factor of 1.35 and our X-ray luminosities would be lower by a factor of 1.15. The X-ray luminosities of Fabian et al. (2000) and Hornschemeier et al. (2000) were based on ; in later comparisons with their luminosities, we ignore this difference since it is small compared to other uncertainties.

Figure 6 shows our hard X-ray luminosities versus redshift. Here the solid curve represents the detection limit. The open pentagons denote the ultraluminous starburst galaxy Arp 220, the ultraluminous, highly obscured AGN NGC 6240, and the radio quiet quasar PG 1543+489, in ascending order (see § 6) for comparison. The hard X-ray luminosities of the spectroscopically identified sources range from just over erg s-1 to erg s-1. Sources at low redshift () do not have the high X-ray luminosities of the sources at high redshift. To determine whether there are also low luminosity sources at high redshift will require Chandra observations that probe to much deeper flux levels.
Even though the ‘normal’ galaxies, which typically fall near the detection threshold, are systematically less luminous than the AGN and quasars, they are still extremely X-ray luminous; only the two lowest luminosity sources even overlap the local galaxy populations (Fabbiano 1989). Furthermore, the ‘normal’ galaxies are generally more luminous than the hard X-ray sources in the nuclei of nearby giant elliptical galaxies in the Virgo and Fornax clusters that were chosen for study on the basis of their black hole properties; these have keV luminosities of erg s-1 to erg s-1 (Allen, Di Matteo, & Fabian 2000).
| Number | ||||||
|---|---|---|---|---|---|---|
| ( ergs s-1) | ( ergs s-1) | ( ergs s-1) | ( ergs s-1) | ( ergs s-1) | ||
| 0 | 2.000uufootnotemark: | 1000 | 480 | 4500 | 9400 | |
| 1 | 1.048aafootnotemark: | 150 | 41 | 3600 | 4300 | |
| 2 | 1.320aafootnotemark: | 230 | 2400 | |||
| 3 | 2.565qqfootnotemark: | 930 | 28000 | |||
| 4 | 0.212nnfootnotemark: | 1.9 | 4.6 | |||
| 5 | 0.696aafootnotemark: | 28 | 140 | 800 | 1000 | |
| 6 | 2.565qqfootnotemark: | 570 | 49000 | 11000 | ||
| 7 | 0.241nnfootnotemark: | 1.3 | 8.0 | 130 | 140 | |
| 8 | 1.800mmfootnotemark: | 120 | 320 | 6500 | 5200 | 7400 |
| 9 | 2.000uufootnotemark: | 130 | 270 | 4700 | 5500 | |
| 10 | 1.427nnfootnotemark: | 59 | 520 | 1800 | 2500 | |
| 11 | 2.415aafootnotemark: | 210 | 4400 | 8200 | 14000 | |
| 12 | 0.585nnfootnotemark: | 6.5 | 160 | 220 | 400 | |
| 13 | 2.000uufootnotemark: | 130 | 94 | |||
| 14 | 2.000uufootnotemark: | 120 | 140 | 6600 | 7300 | |
| 15 | 2.625aafootnotemark: | 220 | 2200 | |||
| 16 | 2.000uufootnotemark: | 110 | 110 | 3600 | 4200 | |
| 17 | 2.000uufootnotemark: | 110 | 650 | 16000 | 18000 | |
| 18 | 0.110nnfootnotemark: | 0.12 | 23 | 27 | 51 | |
| 19 | 0.180nnfootnotemark: | 0.34 | 14 | 77 | 93 |
3.4. Contribution to the Hard XRB
The integrated keV light of the 20 hard X-ray sources in the sample corresponds to an extragalactic background light (EBL) of erg cm-2 s-1 deg-2, or between 58 to 84 percent of the keV XRB, depending on whether we assume the HEAO1 value of erg cm-2 s-1 deg-2 (Marshall et al. 1980) or more recent higher estimates of erg cm-2 s-1 deg-2 (e.g., Vecchi et al. 1999). Throughout the rest of the paper we will conservatively adopt the Vecchi et al. (1999) value.
If we include 6 of the 7 spectroscopically unidentified sources in the population (source 13 is the only source not seen in the -band and hence is the only very high redshift () candidate), then 56% of the light arises from sources. If we instead restrict to the spectroscopic sample, then 34% of the light arises from the population. The four sources with spectroscopic redshifts contribute 13% to the light, and source 13 contributes just 1%.
4. Optical and Near-infrared Properties of the Hard X-ray Sample
4.1. Magnitudes
At the time of this writing, all but one (source 13) of the hard X-ray sources was detected above the level in the NIR image, all but two (13, 16) in the -band image, and all but one (13) in the -band image. Source 13 has since been detected in the NIR using the CISCO infrared camera on the Subaru 8 m telescope (Cowie et al. 2001).
Figure 7 shows the redshift versus magnitude distribution of our spectroscopically identified hard X-ray sample (large symbols) and, for comparison, an optically selected field galaxy sample (small symbols). Hard X-ray sources with radio detections are indicated by surrounding open boxes. The tracks are from Coleman, Wu, & Weedman (1980) for an early-type galaxy (solid), an early spiral galaxy (dashed), and an irregular galaxy (dotted) with absolute magnitudes in the assumed cosmology. The ‘normal’ galaxies and AGN follow the upper envelope of the star forming field galaxy population. Thus, the hard X-ray sources predominantly lie in the most optically luminous galaxies.

4.2. Colors
Figures 8a, b show versus redshift and versus for 19 of the 20 hard X-ray sources (source 13 is excluded). The overlays are Coleman, Wu, & Weedman 1980 tracks for an early-type galaxy (solid curve) and an early spiral galaxy (dashed curve) with . The colors of the spectroscopically identified galaxies are in the range of the galaxy tracks; this is also consistent with their morphological appearance (see Fig. 2). Of the sources that were too optically faint for spectroscopic identification, the NIR magnitudes and colors for four (sources 0, 9, 14, 16) suggest that they are early galaxies in the redshift range (Fig. 8a). Crawford et al. (2000) also found a number of sources of this type in a sample of Chandra hard X-ray sources. We were able to use radio and submillimeter detections for one of the optically faint sources (source 8) to estimate a millimetric redshift with central value (see § 6.1). We used radio detections and submillimeter limits on sources 0, 9, 14, 16, and 17 to estimate millimetric redshift upper limits of 2.5, 3.0, 2.4, 2.2, and 1.4, respectively. Sources 8 and 17 are somewhat bluer than the curves in Figs. 8, but their AGN might be contributing substantially to the rest-frame optical light.


4.3. Bolometric Ultraviolet/Optical Luminosities
We estimate the AGN luminosities in the ultraviolet (UV)/optical by adopting a shape appropriate to the radio quiet AGN (e.g., Zheng et al. 1997). At frequencies below the rest-frame Lyman limit we take the spectrum to be a power-law; this steepens to a power-law at higher frequencies. Normalizing to the observed flux at the wavelength corresponding to the rest wavelength 2500 Å, , the UV/optical luminosity is then
where is the luminosity distance in cm and is in units erg cm-2 s-1 Hz-1. We have estimated for the hard X-ray sample by interpolating from the observed fluxes corresponding to the magnitudes given in Table 1 and, where available, the magnitudes at 3400 Å from MCBA. For the more extended objects we have used the corrected diameter magnitudes from MCBA rather than the diameter magnitudes of Table 1 to obtain better limits on the AGN fluxes. Many of the sources may still have substantial galaxy light contamination, so is strictly an upper limit on the AGN contribution. The inferred bolometric UV/optical luminosities are given in column 4 of Table 3.3 and are plotted versus redshift in Fig. 9.

The four sources with spectroscopic redshifts beyond are by far the most optically luminous sources in the sample. These are the two quasars (sources 3 and 6) and the two AGN (sources 11 and 15) with narrow Ly and CIV lines. The AGN are likely dominating the light in these sources at the observed optical and NIR wavelengths, as the observed colors are quite blue (see Fig. 8a).
5. An Optically Selected Sample: Hard X-ray Properties and Contribution to the Hard XRB
The foregoing section presented the optical nature of the hard X-ray sources. We now invert the approach and ask what are the hard X-ray properties of an optically selected sample. In particular, we would like to know what fraction of optical sources are significant contributors to the hard XRB and whether these are drawn from a particular subsample of the optical population.


To address this issue, we use the complete subsample of 1151 galaxies and stars within a radius of the optical axis of the Chandra pointing. The smaller radius was chosen to minimize aperture corrections to the X-ray counts so that the X-ray limits would be more uniform. For each of these sources, we extracted the X-ray counts in a radius aperture centered on the nominal optical position and converted them to keV fluxes using the procedure outlined in § 2. The X-ray fluxes determined in this way are plotted versus magnitude in Fig. 10a.
Above a hard X-ray flux limit of erg cm-2 s-1, we recover the twelve sources of Table 1 that are within the radius. Monte Carlo simulations using an equal number of sources at random positions show that with this extraction aperture and flux limit, there will be, on average, 1.4 spurious cross-identifications of optical sources with X-ray sources ( at the 95 percent confidence limit). Allowing for this contamination, we find that a fraction of the optical sources are X-ray sources, where the uncertainties correspond to the 68 percent confidence ranges. At a lower hard X-ray flux limit of erg cm-2 s-1, we find 32 sources and expect an average contamination of 10.3 ( at the 95 percent confidence limit). Here, a fraction of the optical sources are X-ray sources.
Excluding the incompletely covered edges of the S3 and S2 chips, the observed area is 47 arcmin2, and the contribution to the keV background of the 12 sources above the erg cm-2 s-1 hard X-ray flux limit is erg cm-2 s-1 deg-2 (41% of the hard XRB).
If we assume that half of the sources in the flux range erg cm-2 s-1 to erg cm-2 s-1 are real, we estimate a further contribution of only erg cm-2 s-1 deg-2; thus, increasing the X-ray sensitivity adds little to the hard XRB contribution. Indeed, summing over all the optically selected sources above erg cm-2 s-1 yields a total of erg cm-2 s-1 deg-2, where the uncertainties are the 68 percent confidence ranges based on randomized samples.
We conclude that most of the hard XRB from the optically selected sources is dominated by the small number of sources with hard X-ray fluxes above erg cm-2 s-1, as is also the case for the directly selected hard X-ray sample.
Another way to estimate the fraction of optically selected sources that are X-ray sources is to use a spectroscopic data sample. Of the 554 objects in the radius region, 172 have measured redshifts or are spectroscopically identified stars. The measured keV fluxes of these galaxies are shown versus their absolute -band magnitudes, , in Fig. 10b. Here K-corrections have been computed using the Coleman, Wu & Weedman (1980) spectral energy distribution (SED) for an early spiral galaxy.
Of the 25 galaxies with , five have hard X-ray fluxes above erg cm-2 s-1. By contrast, none of the 29 galaxies with fainter than is an X-ray source at this level. If we correct for the incompleteness of the spectroscopically identified optical sample, we find that the fraction of optically luminous galaxies that are X-ray sources is . Thus, a very substantial fraction of the optically luminous galaxies are undergoing X-ray activity at any given time.
6. Submillimeter and Radio Properties of the Hard X-ray Sample
The new population of highly obscured, exceptionally luminous sources discovered by SCUBA (Smail, Ivison, & Blain 1997; Hughes et al. 1998; Barger et al. 1998; Barger, Cowie, & Sanders 1999; Eales et al. 1999, 2000) appear to be distant analogs of the local ultraluminous infrared galaxies (ULIGs; Sanders & Mirabel 1996). There is an ongoing debate on whether local ULIGs are dominantly powered by star formation or by heavily dust enshrouded AGN, and the same applies to the distant SCUBA sources (see, e.g., Trentham 2000). If the hard X-ray sources are highly absorbed, then the rest-frame soft X-ray through NIR radiation will be reprocessed by dust and gas, and the energy will appear in the FIR. At high redshifts () the FIR radiation is shifted to the submillimeter.
Barger et al. (1999) carried out a spectroscopic survey of a complete sample of submillimeter sources detected in a survey of massive lensing clusters. Only three of the 17 sources could be reliably identified spectroscopically; of these, two showed AGN signatures. Thus, the possibility that most SCUBA sources contain AGN remains open. Several authors (Almaini, Lawrence, & Boyle 1999; Gunn & Shanks 2000) have modelled the X-ray and submillimeter backgrounds; they predict an AGN contribution to the SCUBA surveys at the level of percent.
The results of recent searches for submillimeter counterparts to Chandra X-ray sources have been mixed. In a study of two massive lensing clusters, A2390 and A1835, Fabian et al. (2000) identified three significant keV sources, but these were not significantly detected in the submillimeter (Smail et al. 1998). Likewise, Hornschemeier et al. (2000) did not see either of their keV sources in the ultradeep Hubble Deep Field SCUBA map of Hughes et al. (1998). In contrast, both of the keV sources detected by Bautz et al. (2000) in the A370 lensed field are submillimeter sources (Smail, Ivison, & Blain 1997). These two sources were previously identified spectroscopically as AGN (Ivison et al. 1998; Barger et al. 1999). The above mixed results probably reflect the fact that the 850 m flux limits obtainable with SCUBA are quite close to the expected fluxes from the obscured AGN, as we address below.
The present study has the advantage that wide-area submillimeter (Barger, Cowie, & Sanders 1999 and the present paper) and extremely deep 20 cm data (Richards et al. 2001) exist over the entire X-ray field of 57 arcmin2. An ultradeep 50 hr submillimeter map (Barger et al. 1998) also exists for one region of the field that contains two hard X-ray sources.
6.1. Submillimeter Detection of a Hard X-ray Source
With one exception, the hard X-ray sources are not detected in the submillimeter at the level. The exception is source 8, an optically faint, highly absorbed () X-ray source in the ultradeep submillimeter map.
The bolometric FIR flux is related to the rest-frame 20 cm flux through the well-established FIR-radio correlation (Condon 1992) of local starburst galaxies and radio quiet AGN. The SEDs of submillimeter sources are reasonably well approximated by the thermal black-body spectrum of the ULIG Arp 220 (Carilli & Yun 2000; Barger, Cowie, & Richards 2000), which is powered by star formation (Downes & Solomon 1998). We can therefore use the submillimeter to radio flux ratio to infer an approximate redshift of 1.8 (with estimated redshift range ) for source 8 (see Eqs. 2 and 4 of Barger, Cowie, & Richards 2000). The millimetric redshift estimation technique is expected to hold for sources dominated by star formation or for radio quiet AGN.
6.2. Spectral Energy Distributions of the Hard X-ray Sources


The two quasars are the softest sources in the hard X-ray sample. In Fig. 11a we compare their average rest-frame SED (filled squares) to the rest-frame SED of the radio quiet quasar PG 1543+489 (solid curve), normalized to approximately match the soft and hard X-ray data of the averaged quasars.
Most of the sources in the sample show much harder X-ray spectra than the two quasars and are consistent with being obscured AGN. In Fig. 11b we compare the rest-frame SED of source 8 (filled squares), based on the millimetric redshift of 1.8, with the SED of the local heavily dust obscured AGN NGC 6240 (solid curve), normalized to approximately match the hard and soft X-ray data of source 8.
6.3. Bolometric FIR Luminosities Inferred from Radio Fluxes
The sources with spectroscopic identifications are mostly at modest redshifts where radio observations provide a more sensitive route for obtaining total FIR luminosities than do submillimeter observations (Barger, Cowie, & Richards 2000). Assuming that the sources are well described by the FIR-radio correlation (which holds for both star forming and radio-quiet AGN) given in Sanders & Mirabel (1996) with , then , where is the flux at 20 cm. We calculate the FIR luminosity by relating it to the observed 20 cm flux, assuming a synchrotron spectrum with an index of ; then
where is the luminosity distance in cm and has units erg cm-2 s-1 Hz-1.
The bolometric FIR luminosities obtained by this method are given in column 5 of Table 3.3 and are plotted in Fig. 12 as open circles. Four sources are not detected above the 15 Jy () limit in the 20 cm data and their luminosities are given as upper limits based on the radio limit. For our sources without spectroscopic or millimetric redshifts, we nominally assume . It is interesting to note that three-quarters of the hard X-ray sources with radio detections in our sample would be classified as LIGs (; Sanders & Mirabel 1996) from their FIR luminosities, and half would be classified as ULIGs ().
6.4. Bolometric FIR Luminosities Inferred from Submillimeter Fluxes
By assuming an ULIG SED, we can use the 850 m data to estimate the FIR luminosity of source 8 and to place upper limits on the FIR luminosities of the remaining sources. For our non-quasar X-ray sources with redshifts, we estimate the FIR luminosities by scaling the NGC 6240 luminosity by the ratio of the 850 m fluxes (after placing NGC 6240 at the redshift of the source). For NGC 6240 we use the K cold component determined by Klaas et al. (1997), which has erg s-1. For our X-ray sources with no submillimeter detections, we use the upper limits on the submillimeter fluxes in calculating the values. For our sources without spectroscopic or millimetric redshifts, we nominally assume . Since above the luminosity distance dependence and the K-correction approximately cancel, there is a simple translation of flux to bolometric luminosity independent of redshift; thus, our procedure should give accurate upper limits for the unidentified sources as long as they are not at low redshift ().
For our two quasar X-ray sources, we estimate the FIR luminosities as above using the SED and FIR luminosity of PG 1543+489. For PG 1543+489 we calculate erg s-1 over the range m using the K grey-body model given in Polletta et al. (2000).
The bolometric FIR luminosities or upper limits obtained from the submillimeter fluxes in this way are given in column 6 of Table 3.3 and are plotted in Fig. 12 as filled squares. The radio inferred FIR luminosities or upper limits are consistent with the submillimeter inferred FIR luminosities or upper limits. It is clear from Fig. 12 that more sensitive submillimeter observations would be required to detect even the higher redshifts objects.

6.5. Bolometric Luminosity Ratios

In Fig. 13 we plot the UV/optical to FIR luminosity ratios versus the logarithm of the soft to hard X-ray flux ratios. If the X-ray sources are hardened by line-of-sight opacities and the same material extinguishes the UV/optical light, then as the opacities decrease, we would expect both the UV/optical to FIR luminosity ratios and the soft to hard X-ray flux ratios to increase. For the spectroscopically identified sources there is a broad overall trend in this sense but with large scatter.

In Fig. 14 we plot the ratios (open squares) and (filled diamonds) versus redshift. Only the two quasars and source 2 at , with its curious optical absorption line spectrum, are dominated by the UV/optical light rather than by the FIR light. The two quasars are the softest sources in the sample and have X-ray photon indices (1.75 and 1.80) consistent with no absorption. Source 2 has a harder photon index (0.9) than the quasars; thus, the dominance of the UV/optical light here is perhaps less expected and may be due to substantial contributions of stellar light. For the remaining sources the FIR light dominates.
6.6. Bolometric Correction
If we assume that the FIR light in the hard X-ray sources is reprocessed AGN light, uncontaminated by star formation in the galaxies, then we may use the present data to compute the bolometric correction from the hard X-ray luminosity to the bolometric light of the AGN. Excluding the two quasars, which have an average , the remaining sources have an average . If the sources with upper limits on are included at this level, then the average , where we have used the radio inferred FIR luminosities, and the average . If the sources with upper limits are instead assigned zero luminosity ratios, then the average and the average .
The ratios are weighted to higher values by the two lowest redshift sources. If we instead weight the averages by the hard X-ray fluxes, then the ratio drops to 33, the ratio to 42, and the ratio to 9. Because galaxy contamination of the optical light is a problem, the actual bolometric correction probably lies somewhere between the values of and . As a conservative minimum, we adopt the ratio for the bolometric correction in subsequent discussions while recognizing that this ratio could be larger by a factor of two or more.
The average ratio for the hard X-ray sources is much smaller than the -band to keV luminosity ratios seen in local early-type galaxies, whether we consider the soft components thought to arise from thermal emission in the gaseous halos (luminosity ratios in the range ) or the hard components which may be produced by X-ray binaries (luminosity ratios in the range ) (Matsumoto et al. 1997). The much higher X-ray luminosities of the present sources relative to their stellar luminosities provide strong evidence that they are powered by AGN.
It is also interesting to consider the total X-ray light. For an assumed photon index of , the total X-ray light is only weakly sensitive to the adopted energy range. For an energy range from 0.1 to 100 keV, the ratio of the total X-ray luminosity to the keV luminosity is only a factor . The total X-ray luminosities of the sources, , are still substantially smaller than the bolometric luminosities at other wavelengths, but an appreciable fraction of the AGN light (typically %) is emerging in the X-rays. values are given in the last column of Table 3.3; here again the radio determinations are used as the inputs.
6.7. FIR and Hard X-ray Luminosity Comparisons
By considering the ratio of the FIR luminosity, , to the hard X-ray luminosity, , we can eliminate any redshift or cosmology dependence and make relative comparisons of distant and local systems. Figure 15a shows the ratio versus for our data sample. Following Fabian et al. (2000), we also show on the figure the data values for the local ultraluminous infrared galaxies Arp 220 and NGC 6240 (Klaas et al. 1997; Iwasawa 1999), the radio quiet quasar PG 1543+489 (Polletta et al. 2000; Vaughan et al. 1999), and the radio loud quasar 3C 273 (Kim & Sanders 1998; Türler et al. 1999). NGC 6240 hosts a powerful AGN and is highly absorbed with an inferred column density of cm-2 (Vignati et al. 1999). On the figure we have connected with a straight line the values of calculated from the observed flux (Iwasawa 1999) and from the inferred intrinsic flux (Vignati et al. 1999) to illustrate the large effects that absorption can make for highly obscured AGN at low redshift.
Using the submillimeter inferred FIR luminosity of source 8 and the radio inferred FIR luminosities of the other hard X-ray sources, we find that the values of for all the sources are comparable to that of NGC 6240. Also shown in Fig. 15a (open diamonds) are the luminous radio quiet quasars observed in the submillimeter by McMahon et al. (1999) for which there are also X-ray detections (Kaspi et al. 2000; we converted the at 2 keV values given in their Table 2 to keV fluxes assuming ). These quasars are in the region of 3C 273 in Fig. 15a. The two gravitationally-lensed sources in the field of A370 (open triangles) detected in hard X-rays by Bautz et al. (2000) and in the submillimeter by Smail, Ivison, & Blain (1997) have higher ratios than the typical X-ray source. However, none of the hard X-ray selected sources remotely approaches the high value of Arp 220.
Figure 15b shows versus for the above submillimeter sources and for submillimeter sources in the literature that have millimetric redshifts (Barger, Cowie, & Richards 2000 and § 7) and X-ray detections or limits (Hornschemeier et al. 2000 and § 7). If most of the submillimeter sources are star-formers like Arp 220, then much deeper hard X-ray observations would be required to detect them.


7. A Submillimeter Selected Sample: Hard X-ray Properties and Contribution to the Hard XRB
The foregoing section presented the submillimeter nature of the hard X-ray sources. We now invert the approach and ask what are the hard X-ray properties of a submillimeter selected sample. We may address this by looking at the ensemble properties of submillimeter selected sources in the SSA13 field. There are twelve source detections at 850 m in the S2 and S3 chips within a radius of the optical axis. The fluxes range from just over 2.3 mJy to 11.5 mJy. The positional accuracies for the submillimeter sources are relatively poor because of the large beam size. Six of the twelve submillimeter sources have 20 cm counterparts within , and the dispersion of the offsets is (see also Barger, Cowie, & Richards 2000). In order to allow for the positional uncertainty, we determined the keV fluxes for each of the submillimeter sources in diameter apertures. The results are shown in Fig. 16. The only submillimeter source that is also a strong hard X-ray emitter is source 8 from Table 1. The submillimeter source with the second strongest hard X-ray flux in Fig. 16 is not in the hard X-ray sample but is a known soft X-ray emitter (source 28 in Table 1 of MCBA).

Because of the large apertures used, there is a significant probability of random overlap with a non-coincident X-ray source. In order to quantify this, we have again run Monte Carlo simulations using an equal number of sources at random positions. The dispersion is erg cm-2 s-1 mJy-1. Only 5% of the simulations have values in excess of erg cm-2 s-1 mJy-1. In fact, the two sources that are contributing all of the X-ray signal have 20 cm radio counterparts that are closely coincident with the X-ray sources. Thus, both of these are real identifications rather than chance contamination.
The ratio of the total hard X-ray flux in the sample to the total submillimeter flux is erg cm-2 s-1 mJy-1. We may use this ratio to estimate the fraction of the hard XRB that arises from submillimeter sources in this flux range. The EBL of the mJy source population is mJy deg-2 (Barger, Cowie, & Sanders 1999), which would contribute erg cm-2 s-1 deg-2 in the keV band or 6% of the hard XRB. This contribution would rise to 19% to 27% if we normalized to the total submillimeter background of mJy deg-2 of Puget et al. (1996) or mJy deg-2 of Fixsen et al. (1998).
However, nearly all of the X-ray signal from the submillimeter sample is coming from source 8. If this single source is removed, the total hard X-ray to total submillimeter flux ratio drops to erg cm-2 s-1 mJy-1. If we place the submillimeter sources at (consistent with the spectroscopic and millimetric redshifts from, e.g., Barger et al. 1999 and Barger, Cowie, & Richards 2000), then the lower limit on the ratio of to would be approximately 1100. This lower limit is above the obscured AGN values and approaching that of Arp 220. It therefore appears that most of the submillimeter sources, at least above 2 mJy, are star formers with a small admixture of obscured AGN. Similar conclusions have recently been reached by Fabian et al. (2000), Hornschemeier et al. (2000), and Severgnini et al. (2000).
8. A Radio Selected Sample: Hard X-ray Properties and Contribution to the Hard XRB
There are 107 20 cm sources above the radio limit of Jy that lie on the S2 and S3 chips within a radius of the optical axis. We have measured their keV fluxes using diameter apertures. Above a hard X-ray flux of erg cm-2 s-1, we recover only the 10 hard X-ray sources with radio counterparts in Table 1. Above erg cm-2 s-1, 16 sources are detected. The contribution to the hard XRB from the entire radio selected sample is erg cm-2 s-1 deg-2 (26%), nearly all of which comes from the hard X-ray sources in Table 1. The small fraction (%) of radio sources that are hard X-ray sources, and therefore AGN, is consistent with expectations that the great bulk of the 20 cm sources at these faint fluxes are due to synchrotron emission arising from supernova remnants in the interstellar medium of the galaxies rather than to nuclear activity. The radio morphologies, which will provide more insight into the nature of the hard X-ray sources, will be discussed in Richards et al. (2001).
9. Hard X-ray Contribution to the EBL
The summed contributions of our Chandra hard X-ray sources to the EBL are shown versus wavelength in Fig. 17 as the filled diamonds. These are compared with measurements of the EBL (solid curves) and with the integrated light from direct counts (large squares); the latter now lie close to the EBL at all wavelengths.

For galaxies at the X-ray power reprocessed by dust is expected to appear at submillimeter wavelengths. We computed the hard X-ray contribution to the submillimeter EBL by considering the average submillimeter properties of the whole X-ray sample and of selected subsamples. Error-weighted sums of the submillimeter sources are given in Table 9, together with the correspondingly weighted total hard X-ray fluxes for the sample and the ratios of the two. The total hard X-ray sample has a significant () submillimeter flux of 20 mJy. As expected, most of this arises in the sources and in the unidentified sources. The total 850 m flux of the sample corresponds to an EBL of mJy deg-2, or from 9 to 13% of the 850 m EBL, depending on whether the normalization of Fixsen et al. (1998) or Puget et al. (1996) is adopted. These values are similar to the obscured AGN model predictions of Almaini et al. (1999) and Gunn & Shanks (2000). However, it appears the the great bulk of the 850 m EBL must arise in sources which are too faint at keV to be seen at the current submillimeter threshold.
We computed the hard X-ray contribution to the optical/NIR EBL by summing the fluxes corresponding to the corrected diameter aperture magnitudes at these wavelengths. This light is dominated by the brighter galaxies, many of them with ‘normal’ galaxy spectra, so there is almost certainly strong contamination of the estimate of the AGN contribution by the light of the host galaxies. The optical/NIR EBL should therefore be considered strictly as an upper bound.
In summary, the hard X-ray sample contributes about 10% of the light at both UV/optical and submillimeter wavelengths. Both wavelength regimes have similar total bolometric light densities. However, because there is galactic light contamination in the optical/NIR, it is likely that the FIR is where most of the AGN light is emerging from the hard X-ray sources.
| Sample | Total | Total | keV)/ | |
|---|---|---|---|---|
| m) | keV) | m) | ||
| (mJy) | ( ergs cm-2 s-1) | ( ergs cm-2 s-1 mJy-1) | ||
| All | 1800 | |||
| 840 | ||||
| (non-QSOs) | 340 | |||
| QSOs | 290 | |||
| Unidentified | 600 |
10. Black Hole Mass Accretion
For nearby normal galaxies, there is an approximate empirical relation between the black hole mass, Mbh, and the absolute magnitude of the bulge component of the host galaxy, (bulge) (e.g., Magorrian et al. 1998; Wandel 1999; Ferrarese & Merritt 2000; Gebhardt et al. 2000). Assuming that the relation also holds at high redshift, we can estimate the black hole masses of our ‘normal’ galaxies, subject to the uncertainties in translating our observed -band magnitudes into (bulge) that would worsen the empirical relation (Kormendy & Ho 2000). The values for our hard X-ray sample are plotted versus redshift in Fig. 18. The inferred values in our ‘normal’ galaxies are in the approximate range M⊙ to M⊙.

As discussed in § 5, luminous hard X-ray sources are common in bulge-dominated optically luminous galaxies with about 10% of the population showing activity at any given time. This preferential activity of luminous sources with massive bulges presumably reflects the relation between the central massive black hole and the luminosity of the bulge. If the fraction of galaxies showing such behavior reflects the fraction of time that each galaxy spends accreting onto its massive black hole, then we require each such galaxy to be active for somewhere between 1 and 2 Gyr. This is considerably longer than the theoretically estimated accretion time of 0.01 Gyr for black hole fuelling by mergers (Kauffmann & Haenelt 2000) and therefore may suggest that the activity is being powered by smaller mergers or by internal flows within the galaxies.
We may address the issue of the total accreted mass required to account for the luminosity in each galaxy by conservatively assuming that the hard X-ray flux-weighted average of derived in § 6.6 is the ratio of the AGN’s bolometric luminosity to its keV luminosity; hereafter, we denote this bolometric correction by . The mass inflow rate is , where is the efficiency for re-radiation of the accretion energy. The total mass flow over the accretion time Gyr is
Our ‘normal’ galaxies have hard X-ray luminosities ranging from to , for which the above accretion masses are to . Thus, even for the maximum plausible efficiency, , we are seeing a substantial fraction of the growth of these supermassive black holes (Fabian & Iwasawa 1999).
We may quantify this in a fairly model-independent way as follows. The bolometric surface brightness at the present time is simply related to the keV XRB by
where the factor 0.85 is discussed in § 3.3. The bolometric EBL is related to the energy production as
where is the universal mass density of supermassive black holes, and is the mean redshift of the contributing sources. The factor reflects the adiabatic expansion loss. The hard X-ray flux-weighted mean redshift is for the spectroscopically identified sources (including source 8) and if we place the remaining sources at .
We combine the two equations and normalize to the observed keV background from Vecchi et al. (1999), erg cm-2 s-1 sr-1, to find
where we have again conservatively used . Inclusion of the bolometric optical light would raise this estimate by about 40%.
If we adopt a spheroid mass density of g cm-3, which has a plausible multiplicative error of about 2 (Cowie 1988; Fukugita et al. 1998), the black hole-bulge relation expressed in mass terms
gives a black hole mass density of g cm-3. Thus, even for high-end estimates of the radiative efficiency () we are seeing a significant fraction of the black hole accretion. Conversely, since we are probably missing some fraction of the activity from sources that are too obscured to be seen in the keV sample, we must have a high radiative accretion efficiency () or the required black hole mass density would be too high.
We may go one step further and ask when the black holes formed, since the above equations also apply to the sources divided into redshift slices. We know directly from the spectroscopic observations that at least 16% of the keV background arises below , 18% between and 2, and 13% between and 3. The remaining 21% of the keV light seen in the current sample most plausibly lies in the range. Weighting by the mean redshifts in each interval, we find that at least 10% of the observed black hole mass formation occurs at . This fraction could rise if there are more obscured hard X-ray sources missing from the keV sample which preferentially lie at low redshift.
11. Conclusions
We carried out an extensive multi-wavelength observational program to determine the nature of the hard X-ray background sources. Our major conclusions are as follows
In the 57 arcmin2 Chandra SSA13 field, we detected 20 sources with keV fluxes greater than erg cm-2 s-1.
We spectroscopically identified the 13 hard X-ray sources brighter than mag; all are in the redshift range . The spectra fall into three general categories: (i) 2 quasars, (ii) 5 AGN, and (iii) 6 optically ‘normal’ galaxies. For the latter category, the AGN are either very weak or undetectable in the optical.
The soft to hard X-ray flux ratios of the hard sample can be described by a rather narrow range of neutral hydrogen column densities from cm-2 to cm-2. At most three of the 14 sources at have column densities above cm-2, which suggests that we are seeing most of the obscured AGN in the present sample.
The hard X-ray sample is consistent with a constant surface density of sources per square degree per unit redshift. The redshift distribution is very similar to that of previous soft selected samples with similar limiting sensitivities.
The hard X-ray luminosities of the spectroscopically identified sources range from just over erg s-1 to erg s-1. All but two are more X-ray luminous than the local galaxy populations.
The integrated keV light of the 20 hard X-ray sources corresponds to an EBL of erg cm-2 s-1 deg-2, or between 58 to 84 percent of the hard XRB, depending on the XRB normalization. Most of this light is from the population.
The colors of the spectroscopically unidentified sources suggest that they are likely early galaxies at .
The ‘normal’ galaxies and AGN follow the upper envelope of the star forming field galaxy population.
Between 4 and 12 percent of galaxies with have hard X-ray fluxes above erg cm-2 s-1. Nearly all of these lie in the redshift range , for which the flux threshold corresponds to erg s-1.
Excluding the two quasars, the hard X-ray flux-weighted average bolometric optical to keV luminosity ratio for the hard X-ray sources is low (9), providing strong evidence that the sources are powered by AGN.
Excluding the two quasars, the hard X-ray flux-weighted average bolometric correction from the keV luminosity to the bolometric light of the AGN is somewhere between 33 and 42, depending on the optical light contamination by stars.
Of the 20 hard X-ray sources in our sample, only one (source 8) was significantly detected in the submillimeter. The millimetric redshift of source 8, obtained from the submillimeter to radio flux ratio, is in the range . Its rest-frame SED is similar to that of the heavily dust obscured local AGN NGC 6240.
Bolometric FIR luminosities or upper limits inferred from the radio data using the FIR-radio correlation or from the submillimeter data using the NGC 6240 or PG 1543+489 SEDs and luminosities are consistent.
The mJy submillimeter source population contributes very little to the hard XRB (6%).
Excluding the one submillimeter source that had a significant hard X-ray detection, the FIR to hard X-ray luminosity ratio for the submillimeter selected sample has a lower limit of 1100; this is above the obscured AGN values and approaching that of Arp 220. Thus, it appears likely that most of the mJy submillimeter sources are star formers.
The radio selected sample contributes 26% to the hard XRB, nearly all of which comes from the observed hard X-ray sources.
The hard X-ray sources contribute about 10% of the light at both UV/optical and submillimeter wavelengths. However, because there is stellar light contamination in the optical/NIR, it is likely that most of the AGN light is emerging in the FIR.
The masses of the black holes in our ‘normal’ galaxies are estimated from the Magorrian relation to be in the range M⊙ to M⊙.
Luminous hard X-ray sources are common in bulge dominated optically luminous galaxies with about 10% of the population showing activity at any given time. Since the hard X-ray emission is likely associated with episodes of accretion onto the central massive black holes in these galaxies, the 10% may represent the duty cycle of galaxies that are active at any given time. Even with a high-end estimate of the radiative efficiency (), the black hole mass density required to account for the observed light is comparable to the local black hole mass density.
References
- (1)
- (2) Allen, S.W., Di Matteo, T., Fabian, A.C. 2000, MNRAS, 311, 493
- (3)
- (4) Almaini, O., Lawrence, A., Boyle, B.J. 1999, MNRAS, 305, 59
- (5)
- (6) Arnaud, K.A., et al. 2001, in preparation
- (7)
- (8) Barger, A.J., Cowie, L.L., Sanders, D.B., Fulton, E., Taniguchi, Y., Sato, Y., Kawara, K., Okuda, H. 1998, Nature, 394, 248
- (9)
- (10) Barger, A.J., Cowie, L.L., Sanders, D.B. 1999, ApJ, 518, L5
- (11)
- (12) Barger, A.J., Cowie, L.L., Smail, I., Ivison, R.J., Blain, A.W., Kneib, J.-P. 1999, AJ, 117, 2656
- (13)
- (14) Barger, A.J., Cowie, L.L., Richards, E.A. 2000, AJ, 119, 2092
- (15)
- (16) Bautz, M.W., Malm, M.R., Baganoff, F.K., Ricker, G.R., Canizares, C.R., Brandt, W.N., Hornschemeier, A.E., Garmire, G.P. 2000, ApJ, 543, L119
- (17)
- (18) Bernstein, R.A. et al. 1999, Low Surface Brightness Universe, ASP Conference Series 170, Eds. J.I. Davies, C. Impey, and S. Phillipps. Astronomical Society of the Pacific (San Francisco), ISBN: 1-886733-92-9 (1999), p. 341
- (19)
- (20) Blain, A.W., Kneib, J.-P., Ivison, R.J., Smail, I. 1999a, ApJ, 512, L87
- (21)
- (22) Brandt, W.N., et al. 2000, AJ, 119, 2349
- (23)
- (24) Campos, A., Yahil, A., Windhorst, R.A., Richards, E.A., Pascarelle, S., Impey, C., Petry, C. 1999, ApJ, 511, L1
- (25)
- (26) Carilli, C.L., Yun, M.S. 2000, ApJ, 530, 618
- (27)
- (28) Chen, L.-W., Fabian, A.C., Gendreau, K.C. 1997, MNRAS, 285, 449
- (29)
- (30) Coleman, G.D., Wu, C.-C., Weedman, D.W. 1980, ApJS, 43, 393
- (31)
- (32) Comastri, A., Setti, G., Zamorani, G., Hasinger, G. 1995, A&A, 296, 1
- (33)
- (34) Condon, J.J. 1992, ARA&A, 30, 575
- (35)
- (36) Cowie, L.L. 1988, The Post-Recombination Universe, NATO Advanced Science Institute Series, Eds. N. Kaiser, A.N. Lasenby, p. 1
- (37)
- (38) Cowie, L.L., Gardner, J.P., Hu, E.M., Songaila, A., Hodapp, K.-W., Wainscoat, R.J. 1994, ApJ, 434, 114
- (39)
- (40) Cowie, L.L., Songaila, A., Hu, E.M., Cohen, J.G. 1996, AJ, 112, 839
- (41)
- (42) Cowie, L.L., et al. 2001, in preparation
- (43)
- (44) Crawford, C.S., Fabian, A.C., Gandhi, P., Wilman, R.J., Johnstone, R.M. 2000, MNRAS, submitted (astro-ph/0005242)
- (45)
- (46) Downes, D., Solomon, P.M. 1998, ApJ, 507, 615
- (47)
- (48) Eales, S., Lilly, S., Gear, W., Dunne, L., Bond, J.R., Hammer, F., Le Fèvre, O., Crampton, D. 1999, ApJ, 515, 518
- (49)
- (50) Eales, S., Lilly, S., Webb, T., Dunne, L., Gear, W., Clements, D., Yun, M. 2000, AJ, 120, 2244
- (51)
- (52) Elvis, M., Schreier, E.J., Tonry, J., Davis, M., Huchra, J.P. 1981, ApJ, 246, 20
- (53)
- (54) Fabbiano, G. 1989, ARA&A 27, 87
- (55)
- (56) Fabian, A.C., Iwasawa, K. 1999, MNRAS, 303, L39
- (57)
- (58) Fabian, A.C., et al. 2000, MNRAS, 315, L8
- (59)
- (60) Ferland, G., Netzer, H. 1983, ApJ, 264, 105
- (61)
- (62) Ferrarese, L., Merritt, D. 2000, ApJ, 539, L9
- (63)
- (64) Fixsen, D.J., Dwek, E., Mather, J.C., Bennett, C.L., Shafer, R.A. 1998, ApJ, 508, 123
- (65)
- (66) Fukugita, M., Hogan, C.J., Peebles, P.J.E. 1998, ApJ, 503, 518
- (67)
- (68) Gardner, J..P., Cowie., L.L., Wainscoat, R.J. 1993, ApJ, 415, L9
- (69)
- (70) Garmire, G.P., et al. 2001, in preparation
- (71)
- (72) Gebhardt, K. et al. 2000, ApJ, 539, L13
- (73)
- (74) Gendreau, K.C. et al. 1995, PASJ, 47, L5
- (75)
- (76) Giacconi, R., et al. 2001, ApJ, submitted (astro-ph/0007240)
- (77)
- (78) Gilli, R., Risaliti, G., Salvati, M. 1999, 347, 424
- (79)
- (80) Gunn, K.F., Shanks, T. 2000, MNRAS, in press (astro-ph/9909089)
- (81)
- (82) Hasinger, G., Burg, R., Giacconi, R., Schmidt, M., Trumper, J., Zamorani, G. 1998, A&A, 329, 482
- (83)
- (84) Hasinger, G. 2000, ISO Surveys of a Dusty Universe, Eds. D. Lemke, M. Stickel, K. Wilke (Springer), in press (astro-ph/0001360)
- (85)
- (86) Ho, L.C., 1999, ApJ, 516, 672
- (87)
- (88) Hodapp, K.-W. et al. 1996, NewA, 1, 177
- (89)
- (90) Holland, W.S., et al. 1999, MNRAS, 303, 659
- (91)
- (92) Hornschemeier, A.E., et al. 2000, ApJ, 541, 49
- (93)
- (94) Hughes, D.H. et al. 1998, Nature, 394, 241
- (95)
- (96) Ishisaki, Y., et al. 1998, Astron. Nach., 319, 68
- (97)
- (98) Ivison, R., Smail, I., Le Borgne, J.-F., Blain, A.W., Kneib, J.-P., Bézecourt, J., Kerr, T.H., Davies, J.K. 1998, MNRAS, 298, 583
- (99)
- (100) Iwasawa, K. 1999, MNRAS, 302, 96
- (101)
- (102) Jenness, T., Lightfoot, J.F. 1998, Starlink User Note 216.3
- (103)
- (104) Kaspi, S., Brandt, W.N., Schneider, D.P. 2000, AJ, 119, 2376
- (105)
- (106) Kauffmann, G., Haehnelt, M. 2000, MNRAS, 311, 576
- (107)
- (108) Keel, W.C., Kennicutt, R.C., Jr., Hummel, E., van der Hulst, J.M. 1985, AJ, 90, 708
- (109)
- (110) Kim, D.-C., Sanders, D.B. 1998, ApJS, 119, 41
- (111)
- (112) Klaas, U., Haas, M., Heinrichsen, I., Schulz, B. 1997, A&A, 325, L21
- (113)
- (114) Kormendy, J., Ho, L.C. 2000, The Encyclopedia of Astronomy and Astrophysics (Institute of Physics Publishing), in press, [astro-ph/0003268]
- (115)
- (116) Laor, A., Fiore, F., Elvis, M., Wilkes, B.J., McDowell, J.C. 1997, ApJ, 477, 93
- (117)
- (118) Lightfoot, J.F., Jenness, T., Holland, W.S., Gear, W.K. 1998, SCUBA System Note 1.2
- (119)
- (120) Madau, P., Ghisellini, G., Fabian, A.C. 1994, MNRAS, 270, L17
- (121)
- (122) Magorrian, J. et al. 1998, 115, 2285
- (123)
- (124) Marshall, F. et al. 1980, AJ, 235, 4
- (125)
- (126) Matsumoto, H., Koyama, K., Awaki, H., Tsuru, T., Loewenstein, M., Matsushita, K. et al. 1997, ApJ, 482, 133
- (127)
- (128) Matt, G., Fabian, A.C. 1994, 267, 187
- (129)
- (130) McMahon, R.G., Priddey, R.S., Omont, A., Snellen, I., Withington, S. 1999, MNRAS, 309, L1
- (131)
- (132) Miyaji, T. et al. 1998, A&A, 334, L13
- (133)
- (134) Miyaji, T., Hasinger, G., Schmidt, M. 2000, A&A, 253, 25
- (135)
- (136) Moran, E.C., Halpern, J.P., Helfand, D.J. 1996, ApJS, 106, 341
- (137)
- (138) Morrison, R., McCammon, D. 1983, ApJ, 270, 119
- (139)
- (140) Mushotzky, R.F., Cowie, L.L., Barger, A.J., Arnaud, K.A. 2000, Nature, 404, 459 (MCBA)
- (141)
- (142) Oke, J.B., et al. 1995, PASP, 107, 375
- (143)
- (144) Polletta, M., Courvoisier, T.J.-L., Hooper, E.J., Wilkes, B.J. 2000, A&A, 362, 75
- (145)
- (146) Puget, J.-L., Abergel, A., Bernard, J.-P., Boulanger, F., Burton, W.B., Desert, F.-X., Hartmann, D. 1996, A&A, 308, L5
- (147)
- (148) Richards, E.A., et al. 2001, in preparation
- (149)
- (150) Sanders, D.B., Mirabel, I.F. 1996, ARA&A, 34, 749
- (151)
- (152) Schmidt, M., et al. 1998, A&A, 329, 495
- (153)
- (154) Setti, G., Woltjer, L. 1989, A&A, 224, L21
- (155)
- (156) Severgnini, P. et al. 2000, A&A, 360, 457
- (157)
- (158) Smail, I., Ivison, R.J., Blain, A.W. 1997, ApJ, 490, L5
- (159)
- (160) Smail, I., Ivison, R.J., Blain, A.W., Kneib, J.-P. 1998, ApJ, 507, L21
- (161)
- (162) Tananbaum, H., Tucker, W., Prestwich, A., Remillard, R. 1997, ApJ, 476, 83
- (163)
- (164) Trentham, N. 2000, MNRAS, submitted, [astro-ph/0004370]
- (165)
- (166) Türler, M., Courvoisier, T.J.-L., Paltani, S. 1999, A&A, 349, 45
- (167)
- (168) Vaughan, S., Reeves, J., Warwick, R., Edelson, R. 1999, MNRAS, 309, 113
- (169)
- (170) Vecchi, A., Molendi, S., Guainazzi, M., Fiore, F., Parmar, A.N. 1999, A&A, 349, L73
- (171)
- (172) Veilleux, S., Osterbrock, D. 1987, ApJS, 63, 295
- (173)
- (174) Vignati, P. et al. 1999, MNRAS, 308, L6
- (175)
- (176) Wainscoat, R.J., Cowie, L.L. 2001, in preparation
- (177)
- (178) Wandel, A. 1999, ApJ, 519, L39
- (179)
- (180) Williams, R., et al. 1996, AJ, 112, 1335
- (181)
- (182) Wilman, R.J., Fabian, A.C. 1999, MNRAS, 309, 862
- (183)
- (184) Windhorst, R.A., Fomalont, E.B., Kellermann, K.I., Partridge, R.B., Richards, E., Franklin, B.E., Pascarelle, S.M., Griffiths, R.E. 1995, Nature, 375, 471
- (185)
- (186) Wright, E.L., Reese, E.D. 2000, ApJ, in press (astro-ph/9912523)
- (187)
- (188) Zdziarski, A.A., Johnson, W.N., Done, C., Smith, D., McNaron-Brown, K. 1995, ApJ, 438, L63
- (189)
- (190) Zheng, W., Kriss, G.A., Telfer, R.C., Grimes, J.P., Davidsen, A.F. 1997, ApJ, 475, 469
- (191)