The BeppoSAX HELLAS survey: on the nature of faint hard X-ray selected sources
Abstract
The BeppoSAX 4.5-10 keV High Energy Large Area Survey has covered about 80 deg2 of sky down to a flux of . Optical spectroscopic identification of half of the sources in the sample (62) shows that many () are highly obscured AGN, in line with the predictions of AGN synthesis models for the hard X-ray background (XRB, see e.g. Comastri et al. 1995). The X-ray data, complemented by optical, near-IR and radio follow-up, indicate that the majority of these AGN are “intermediate” objects, i.e. type 1.8-1.9 AGN,‘red’ quasars, and even a few broad line, blue continuum quasar, obscured in X-rays by columns of the order of cm-2, but showing a wide dispersion in optical extinction. The optical and near-IR photometry of the obscured objects are dominated by galaxy starlight, indicating that a sizeable fraction of the accretion power in the Universe may actually have been missed in optical color surveys. This also implies that multicolor photometry techniques may be efficiently used to assess the redshift of the hard X-ray selected sources.
KEYWORDS: X–ray: selection – background – galaxies – AGN
1. Introduction
Hard X-ray observations are the most efficient way of tracing emission due to accretion mechanisms, such in Active Galactic Nuclei (AGN). Hard X-ray selection is less affected by strong biases present at other wavelengths. For example, a column of a few times cm-2 has negligible effect in the 5-10 keV band, while it reduces by times nuclear emission below 2 keV. Soft X-ray surveys (e.g. Hasinger et al. 1998, Schmidt et al. 1998) are also often contaminated by non nuclear components, like emission from binaries and/or from optically thin plasmas in star-formation regions surrounding the nucleus. Optical and UV color selection is biased against objects with even modest extinction or an intrinsically ‘red’ emission spectrum (see e.g. Vignali et al. 2000). Sensitive hard X-ray surveys are therefore powerful tools to select large samples of AGN less biased against absorption and extinction. Our approach consists in taking advantage of the large field of view and good sensitivity of the BeppoSAX MECS instrument (Boella et al. 1997a,b) to survey tens to hundreds of square degrees at fluxes (Fiore et al. 2000a), and using higher sensitivity XMM-Newton and Chandra observations to extend the survey down to on several deg2 (at this flux the majority of the hard XRB is resolved in sources). The results on the optical identification of a sample of faint Chandra sources discovered over the first 0.14 deg2 have been published by Fiore et al. (2000b). This approach is complementary to deep pencil beam surveys ( deg2, see e.g. Mushotzky et al. 2000, Hornschemeier et al. 2000), and we cover a different portion of the redshift–luminosity plane. Our purpose is to study cosmic source populations at fluxes where a reasonably large fraction of the hard XRB is resolved (20-30% at the BeppoSAX flux limit), but where the X-ray flux is high enough to provide X-ray spectral information in higher sensitivity follow-up observations. This would allow the determination of the distribution of absorbing columns in the sources making the hard XRB, providing strong constraints on AGN synthesis models for the XRB. Furthermore, large area surveys allow the search for previously ‘rare’ AGN, like ‘red’ quasars or other minority AGN populations (Kim & Elvis 1999) and quantify their fractional contribution to the AGN family. Finally, at our X-ray flux limits the optical counterparts are bright enough to allow relatively high quality optical spectroscopy, useful to investigate the physics of the sources.
2. The HELLAS survey
The High Energy Large Area Survey (HELLAS) has been performed in the 4.5-10 keV band because: a) this is the band closest to the maximum of the XRB energy density which is reachable with the current imaging X-ray telescopes, and b) the BeppoSAX MECS Point Spread Function (PSF) greatly improves with energy, providing a 95 % error radius of 1′ in the hard band (Fiore et al. 2000a), allowing optical identification of the X-ray sources. About 80 deg2 of sky have been surveyed so far using 142 BeppoSAX MECS fielda at deg. (Fields centered on bright extended sources and bright Galactic sources were excluded from the survey, as well as fields close to LMC, SMC and M33.)
A robust detection algorithm has been used in coadded MECS1+MECS2+MECS3 (or MECS2+MECS3 for observations performed after the failure of the MECS1 unit) 4.5-10 keV images. The method consists in first convolving the X-ray image with a wavelet function, to smooth the image and increase contrast, and then in running a standard slide-cell detection method on the smoothed image, to locate count excesses above the local background. The statistics of each candidate detection is then accurately studied and the final net counts are estimated from the original (un-smoothed) image to preserve Poisson statistics. The background is calculated using source-free boxes near the source region. The detection has been run several time for each field, changing the size of the wavelet function, to a) take into account the variation of the MECS PSF with the offaxis angle, and b) to detect efficiently sources with variable extension. The quality of the detection has always been checked interactively. We used a probability threshold of 99.94 % (about 3.5 ). Sources detected in regions of radius 4, 6 or 8 arcmin around targets (depending on the target brightness) have been excluded from the sample, which includes a total of 147 sources down to a 5-10 keV flux of . Count rates were converted to fluxes using a fixed conversion factor equal to 7.8 (5-10 keV flux) per one “3 MECS count” (4.5-10 keV). This factor is appropriate for a power law spectrum with , but due to the narrow band it is not strongly sensitive to the spectral shape: for and 0.8 it is 8.1 and 7.6 respectively. The skycoverage varies from deg2 at to 6.6, 50 and 84 deg2 at fluxes of and respectively. After correcting for this skycoverage we find 16.93.0(6.4) sources deg-2 at (Fiore et al. 2000a, Comastri et al. 2000). First quoted errors are the statistical confidence interval. Errors in brackets include systematic uncertainties, due to the lack of knowledge of the real spectrum of the faint sources. This logN-logS corresponds to a resolved fraction of the 5-10 XRB equal to 20-30 %, depending on the XRB normalization (Comastri this meeting, Vecchi et al. 1999). The observed number counts are consistent, within the errors, with the extrapolations from the BeppoSAX (Giommi et al 2000) and ASCA (Cagnoni et al. 1998, Ueda et al. 1999, Della Ceca et al. 1999) 2-10 keV number counts, assuming an average power law spectrum with .
3. Hardness ratio analysis

To study the spectral variety of the HELLAS sources we have calculated for each source the softness ratio (S-H)/(S+H), S=1.3-4.5 keV, H=4.5-10 keV. Figure 1 plots (S-H)/(S+H) as a function of source total 5-10 keV flux. Sources under or close to the berillium strongback supporting the MECS window have been excluded from this analysis, because their observed softness may be systematically lower than real. The number of the remaining sources in the sample is 126. Many of the HELLAS sources have a low (S-H)/(S+H), indicating a hard spectrum. Assuming , we find that 36(5) of the 126 sources have 1.3-4.5 keV count rates lower than that expected at confidence level . Large absorbing columns densities are likely responsible for the hard spectrum of these sources. A deficit of very hard sources at fluxes is also evident in figure 1. This can be due to both an astrophysical and a technical reason. The first is a redshift effect: the observed softness ratio of sources with similar intrinsic absorbing column density increases with the redshift, as the observed cut-off energy moves toward lower energies. The second is the MECS reduced sensitivity to hard sources, due to the rapid increase of the vignetting of the telescopes with the energy and with the off-axis angle. To quantify the latter effect we have computed loci of equal 4.5-10 keV count rate for a given flux, shown by dashed lines in figure 1. The strong curvature of these lines toward low values of (S-H)/(S+H) indicate that a large part of the deficit of faint hard sources is probably due to this effect. The curves are bent toward high flux values at high (S-H)/(S+H) too, because the MECS sensitivity is reduced for very soft sources by the berillium window, which absorbs most photons below keV. The 4.5-10 keV sensitivity is maximum for an unabsorbed power law spectrum of .


4. Optical identifications
Correlations of the HELLAS source catalog with catalogs of cosmic sources provide 26 coincidences (7 radio-loud AGN, 13 radio-quiet AGN, 6 clusters of galaxies), suggesting that most of the HELLAS sources are AGN. Optical spectroscopic follow-ups have been performed on about 45 HELLAS error-boxes, providing 36 new identifications (Fiore et al. 1999, La Franca et al. 2000 in preparation). The radio-quiet AGN sample includes:
i) 28 broad line blue continuum quasars
ii) 2 broad line ‘red’ continuum quasars
iii) 14 type 1.8-1.9-2 AGN
iv) 5 sources have optical spectra typical of LINERS of starburst galaxies (all have strong [OII] emission).
| total AGN (49) | 1.20.2 | 1.0 | -0.030.05 | 0.34 |
|---|---|---|---|---|
| broad line AGN (28) | 0.80.1 | 0.7 | 0.110.05 | 0.26 |
| narrow line AGN (19) | 1.70.3 | 1.1 | -0.260.08 | 0.34 |


The number of chance coincidences in 45 error boxes is for broad line quasar and for narrow line AGN (including in this category strong [OII] emission line galaxies like LINERS and starburst galaxies).
At least 5 of the narrow emission line AGN lie in small groups and/or in interacting couples.
About 1/3 of the error-boxes studied in detail contains no ‘reasonable’ (in terms of X-ray to optical ratio of known classes of sources) counterpart to the X-ray source down to R=20.5
Optical spectroscopy indicates a wide variety of spectra, with a large fraction of “intermediate” objects (type 1.8-1.9 AGN, ‘red’ quasars).
Figure 2a) plots the luminosity of the identified HELLAS sources as a function of their redshift. We have identifications of broad line quasars up to z=2.76 and luminosity of erg s-1, and of narrow line AGN up to z=0.4 and luminosity of erg s-1. Figure 2b) plots the (S-H)/(S+H) of the identified sources as a function of their B – R color. Note as the broad line AGN are relatively well separated from the narrow line AGN in the diagram, although the scatter in both B – R and (S-H)/(S+H) is large for both class of AGN (also see Table 1). Both (S-H)/(S+H) and B – R of broad line AGN are different (at the level) from that of narrow line AGN, which, on average, have a lower (S-H)/(S+H), and are therefore likely to be more X-ray absorbed, and an higher B – R, and are therefore subjected to a greater extinction.
(S-H)/(S+H) is plotted as a function of the redshift in figure 3 for the 53 identified sources detected far from the berillium strongback supporting the MECS window. The dotted lines represent the expectation of unabsorbed power law with and 0.8. The dashed lines represent the expectations of a power law absorbed by columns of , and cm-2 respectively, in the source frame. Note that the softness ratios of constant column density models strongly increases with the redshift. Most of the narrow line AGN have (S-H)/(S+H) inconsistent with that expected from a power law model with . Absorbing columns, of the order of cm-2, are most likely implied. Note also that some of the broad line AGN have (S-H)/(S+H) inconsistent with that expected for a power law, in particular at high redshift. The (S-H)/(S+H) of the 24 broad line AGNs is marginally anticorrelated with z (Spearman rank correlation coefficent of -0.364 for 22 degrees of freedom, corresponding to a probability of 92%). The number of sources is not large enough to reach a definite conclusion, but it is interesting to note that this correlation goes in the opposite direction than expected. In fact, the ratio of the optical depth in the optical band, due to dust extinction, to that in the X-ray band, due to photoelectric absorption, should scale as . Highly X-ray obscured broad line blue continuum quasar can exist only if their dust to gas ratio or their dust composition strongly differs from the Galactic one (also see Maiolino, this meeting). Similar results have been recently found in ASCA samples by Akiyama et al. (1999) and Della Ceca et al. (this meeting). XMM-Newton and Chandra follow-up observation may easily confirm or disregard a significant absorbing column in these high z broad line quasars.
5. Spectral Energy Distribution
5.1. X-ray to optical color
Figure 4 shows the hard X-ray (5-10 keV) to optical (R band) flux ratio as a function of the X-ray flux for the identified HELLAS sources and a sample of relatively bright, nearby AGN observed by BeppoSAX (Seyfert 1 galaxies, Seyfert 2 galaxies, PG quasars with z0.4). The X-ray to optical ratio of the HELLAS sources is similar to that of the X-ray brightest objects in the local universe (with the exception of X-ray selected blazars, like the HBL, which have higher X-ray to optical ratio, but also a relatively strong radio emission). While supporting the robustness of our identifications, this suggests that roughly one third of the hard X-ray background is due to sources similar to local Seyferts and quasars.
5.2. Near infrared to optical colors
Photometric infrared and optical observations of 10 HELLAS sources have been carried out using the Telescopio Nazionale Galileo (TNG; Maiolino et al. 2000). The sample includes 4 broad line ‘blue’ quasars, 2 broad line ‘red’ quasars, 3 type 1.9 AGN and 1 LINER. The B, R and J photometry of the 2 ‘red’ quasars and the 4 narrow line galaxies is dominated by the emission from the host galaxy. AGN contribution is observed in the K band, especially in the 2 ‘red’ quasar. This means that many, if not most of the objects making the hard X-ray background cannot be distinguished from normal galaxies using optical and near-IR photometry. In fact only the 4 broad line blue quasar would have passed the color criterion of the PG catalog, thus indicating that a large fraction of the accretion power in the Universe may actually have been missed in optical color survey such as the BQS (U – B). Multicolor photometry techniques based on galaxy templates (e.g. Giallongo et al. 1998) may be efficiently used to assess the redshift of the hard X-ray selected sources. This will be more and more important when large samples of faint X-ray sources will be available from Chandra and XMM observations, and optical spectroscopic identification of all of them will not be feasible.
5.3. Radio to optical to X-ray broad band spectral indices
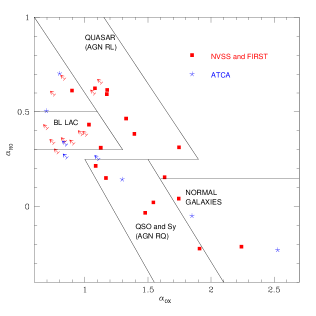
Nearly all the 147 HELLAS sources have been observed in either the NVSS and FIRST surveys or by our collaboration using ATCA. In particular, we observed with ATCA 20 sources obtaining 8 5 detections (40 % of the sample) at a 5 GHz flux limit of 0.5 mJy. This fraction is higher than in Radio follow-ups of Einstein and ROSAT X-ray surveys (Ciliegi et al. 2000 in preparation). This is mainly due to the lower radio-to-X-ray flux limit ratio in our survey. A similar fraction of radio detections was found by Akiyama et al. (2000) in their correlation of the ASCA Large Sky Survey sources with the FIRST catalog, which have a radio-to-X-ray flux limit ratio similar to ours. Figure 4b) shows the radio-to-optical broad band spectral index as a function of the X-ray-to-optical index (arrows identify sources without a R20 counterpart in the small Radio error box). Note that many of the HELLAS detections have and consistent with that of radio quiet AGN.
6. Conclusions
A large area, hard X-ray survey performed with BeppoSAX has found a population of faint obscured AGN. The X-ray data, complemented by optical, near-IR and radio follow-ups, indicate that the majority of these sources are “intermediate” AGN i.e. type 1.8-1.9 AGN, ‘red’ quasars, obscured in X-ray by columns of the order of cm-2, but showing a wide dispersion in optical extinction. The sample of identified HELLAS AGN contains higher redshift analogs of nearby Seyfert galaxies and quasars. Furthermore, we find marginal evidence for a population of X-ray obscured quasars at z showing broad lines in their optical spectra.
ACKNOWLEDGEMENTS
We thank the BeppoSAX SDC, SOC and OCC teams for the successful operation of the satellite and preliminary data reduction and screening. This research has been partly supported by ASI ARS/99/75 contract and MURST Cofin-98-032 contract.
REFERENCES
Akiyama et. al. 2000, ApJ, 532, 700
Boella, G. et al. 1997, A&AS, 122, 299
Boella, G. et al. 1997, A&AS, 122, 327
Comastri, A., Setti, G., Zamorani, G. & Hasinger, G. 1995, A&A, 296, 1
Comastri, A., Fiore, F., Vignali, C., La Franca, F. & Matt, G. 2000, in “Large Scale Structure in the X-ray Universe”, M. Plionis & I. Georgantopoulos eds., Atantisciences 2000, astro-ph/0001037
Cagnoni, I., Della Ceca, R. & Maccacaro, T. 1998, ApJ, 493, 54
Della Ceca, R., Castelli, G., Braito, V., Cagnoni, I., & Maccacaro, T. 1999 ApJ, 524, 674
Fiore, F. et al. 1999, MNRAS, 306, L55
Fiore, F. et al. 2000a, MNRAS, submitted
Fiore, F. et al. 2000b, New Astronomy in press, astro-ph/0003273
Giallongo, E. et al. 1998, AJ, 115, 2169.
Giommi, P., Perri, M. & Fiore, F. 2000, A&A in press, astro-ph/0006333
Hasinger, G. et al. 1998, A&A, 329, 482
Hornschemeier, A.E. et al. 2000, ApJ in press, astro-ph/0004260
Kim, D.-W. & Elvis, M. 1999, ApJ, 516, 9
Maiolino, R. et al. 2000, A&A, 335, L47
Mushotzky, R.F., Cowie, L.L., Barger, A.J., Arnaud, K.A. 2000, Nature, 404, 459
Schmidt, M. et al. A&A 329 495
Ueda, Y. et al., 1999, ApJL, 524, L11
Vecchi, A., Molendi, S. Guainazzi, M., Parmar, A. & Fiore F. 1999 A&A, 349, L73
Vignali, C. et al. 2000, MNRAS, 313, L11