PHOTOMETRIC REDSHIFTS AND GRAVITATIONAL TELESCOPES
We review the use of photometric redshifts in the particular context of Gravitational Telescopes. We discuss on the possible application of such a technique to the study of both the faint population of distant sources and the properties of cluster lenses. Photometric reshifts could be used to derive the redshift distribution and properties of a very faint subsample of high- lensed galaxies, otherwise out of reach. Concerning the mass distribution in lensing clusters, photometric reshifts are strongly needed to scale the mass in weak lensing analysis, and to characterize the lensing structure.
1 Introduction
Photometric redshifts (hereafter s) are a promising technique in deep universe studies. The interest for this technique has recently increased with the development of large field and deep field surveys, in particular the HDF. The relatively high number of objects accessible to photometry allows to enlarge the spectroscopic sample towards the faintest magnitudes. For this reason, s are also important when using lensing clusters as Gravitational Telescopes (GTs), for the study of both the background sources and the lenses.
One of the most widely used techniques is the SED fitting procedure. The observed photometric spectral energy distributions (SEDs) are compared to those obtained from a set of template spectra, using the same photometric system. The method is based on the detection of strong spectral features, and it has been largely applied on HDF studies . The examples presented in this paper have been produced using our public code called hyperz, which adopts a standard SED fitting method, but most results should be completely general when using other tools. hyperz is presented in a recent paper by Bolzonella et al. (2000) , and it is available on the web at http://webast.ast.obs-mip.fr/hyperz. When applying hyperz to the spectroscopic samples available on the HDF, the uncertainties are typically , and this value gives an idea of the expected accuracy of s for the purposes of this paper.
2 Photometric redshifts and background sources
The idea is to take benefit from the amplification factor in GTs to study the properties of the distant background population of lensed galaxies. The typical amplification ranges between 1 to 3 magnitudes in the cluster core. In principle, GTs are useful to build-up and study an independent sample of high- galaxies, which complements the large samples obtained in standard field surveys. The advantage is that this sample is less biased in luminosity than the field.
2.1 Redshift distribution of faint galaxies
One of the main goals of the GT is to determine the distribution of a very faint subsample of high- lensed galaxies, invisible otherwise, and this can be achieved using s. In order to prevent the biases towards or against a particular type of galaxy or redshift domain, shall be computed from broad-band photometry using a large wavelength interval, from B (U when possible) to K. This allows also to reduce the errors on (see Bolzonella et al. 2000 for a detailed discussion).
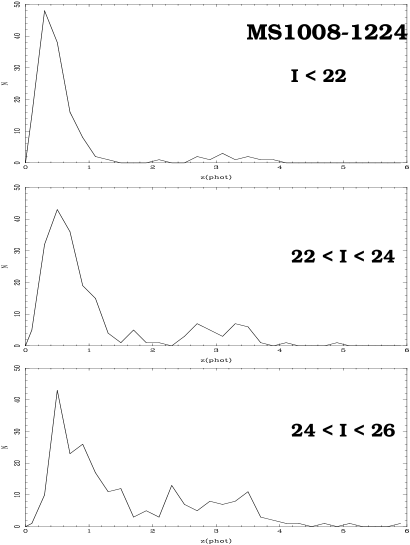
We have obtained the (photometric) N() distribution of arclets in several well known clusters (A2390, A370, Cl2244-02, AC114,…). Figure 1 displays a recent example, the distribution for different source samples in MS1008-1224, corresponding to different limits in magnitude. In this case, s were computed from VLT BVRI (FORS) and JK’ (ISAAC) public data obtained during the Science Verification phase. The sample includes 559 sources located on the central 2.5 arcminute field of ISAAC, excluding obvious cluster members. The typical number of high- sources found in the inner 1’ radius region of the cluster is to 50 at , for a photometric survey performed with the HST and different 4m class telescopes. Clusters with well constrained mass distributions enable to recover precisely the distribution of lensed galaxies, by correcting the relative impact parameter on each redshift bin.

2.2 Optimization of spectroscopic redshift surveys
An interesting issue for when using GTs for the spectroscopic study of faint amplified sources is the optimization of the survey, that is selecting the best spectral domain in the visible or near-IR bands. This means in practice to produce a criterion based in to discriminate between objects showing strong spectral features in the optical and in the near-IR.
An additional benefit of is that this technique efficiently contributes to the identification of objects with ambiguous spectral features, such as single emission lines. An example of this is given in a recent paper by Campusano et al. (in preparation, see also Le Borgne et al., this conference).
2.3 Identification and study of very high- sources
The signal/noise ratio in spectra of amplified sources and the detection fluxes are improved beyond the limits of conventional techniques, whatever the wavelength used for this exercise. An example is the ultra-deep MIR survey of A2390, and the SCUBA cluster lens survey. Number of lensed galaxies have been found recently, and these findings strongly encourage our approach, , , . Cluster lenses are the natural way to search for primeval galaxies, in order to constraint the scenarios of galaxy formation.
High- lensed sources could be selected close to the appropriate critical lines, and identified using criteria. s are computed from broad-band photometry on a large wavelength interval, from B (U when possible) to K.
Whatever the method used, a crucial test is the comparison between the photometric and the spectroscopic redshifts obtained on a restricted subsample of objects. Thanks to the magnification factor, cluster lenses could be used to enlarge the training sample towards the faintest magnitudes.
2.4 Combining photometric and lensing redshifts
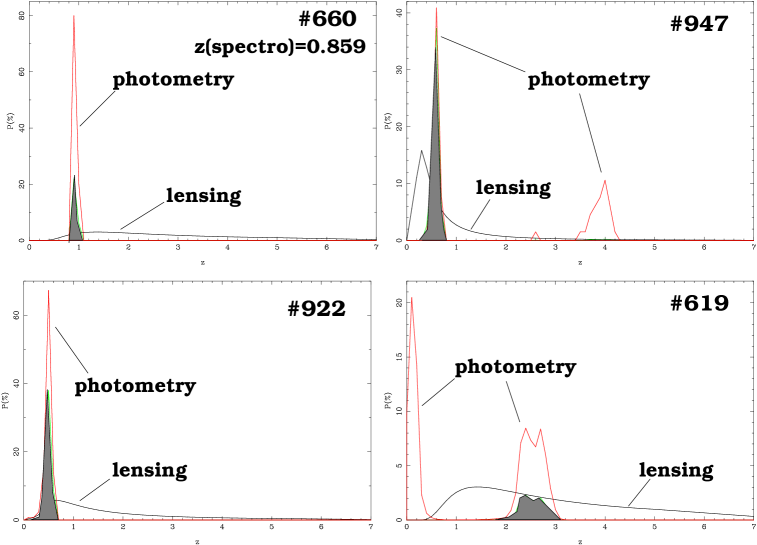
Lensing inversion and techniques produce independent probability distributions for the redshift of amplified sources. Therefore, the combination of both methods provides an alternative way to determine the redshift distribution of the faintest high- sources. Figure 2 displays the results for 4 sources in A2390, with computed from BgVrRiIJK’ photometry. When comparing the and lensing redshift () values for a subsample of 98 arclets in the core of A2390, all selected according to morphological criteria (minimum elongation and right orientation are requested), we find that about of the sample have . The discrepancy mostly corresponds to sources with , but it must be noticed that the lensing inversion technique is characterized by a trend against the identification of high- images, whereas does not show this trend. This behaviour is expected as a result of the relative low sensitivity to of the inversion method for high- values. Thus, in general, the determination is more accurate than the . Nevertheless, the combination of both distributions is particularly useful when a degenerate solution appears using , as shown in Figure 2.
3 Photometric redshifts and cluster lenses
3.1 Identification of multiple images
Cluster lenses are useful only when their mass distribution is highly constrained by multiple images, revealed by HST and multicolor photometry. The technique is useful to identify objects with similar SEDs within the errors, thus compatible with a multiple image configuration. s can be used advantageously when data span a large wavelength range, and particularly if near-IR photometry is available, because this allows to obtain accurate in the sensitive region of .
3.2 Scaling the mass in weak lensing analysis
s are particularly useful when deriving the mass from weak shear analysis: they are used to eliminate cluster and foreground galaxies from the analysis, and to scale the lensing distance modulus in order to compute the mass from the gravitational convergence. The average convergence , which corresponds to the ratio between the surface mass density and the critical value for lensing, may be obtained as a function of the radial distance using different methods (see Mellier 1999 for a review). The mass within an aperture is given by
where are the angular size distances between the cluster (), the observer () and the source (), and is the averaged convergence within the radius . Using the computed through a suitable filter set, the mean value of can be computed, thus leading to a fair estimate of the mass. This method has been recently applied to the lensing clusters MS1008-1224 and A2219 (see also Abdel Salam and Gray, this conference). Because of the small projected surface across the redshift space, the effective surface which is “seen” through a cluster lens is relatively small, thus producing a strong variance from field to field. Obtaining the distribution for each cluster could help to improve the mass determination. Nevertheless, the distortion on the distribution itself depends on the mass distribution (sect. 2.1). An iterative process is needed to reduce the error bar on the mass, which is without this second order correction.
3.3 Identification and Characterization of lensing structures
s are useful to improve the detection of clusters in wide-field surveys, and to identify the visible counterpart of complex lenses. It has been shown that including such a technique in an automated identification algorithm allows to improve significantly the detection levels for clusters, whatever the algorithm used . In general, the is improved by a factor of 3 to 6 up to , depending on the redshift and magnitude limits. The detection efficiency in the region is improved only when using a selection based on optical and near-IR filters. These comments also apply to multiple, complex and/or dark lenses, where s allow to identify the main lensing structures. Examples of composite lenses recently identified by are MS1008-1224, where a secondary lens exists at , and the multiple-quasar fields Q2345+007 and the Cloverleaf.
Cluster members could be also selected using criteria. The present version of hyperz is also able to display the probability of each object to be at a fixed redshift. This is useful when looking for clusters of galaxies at a given (or guessed) redshift. In this way, the number density and luminosity density distributions of cluster galaxies can be computed, and ratios could be estimated.
4 Conclusions and Perspectives
Concerning the lensing clusters, s appear as an essential tool for mass calibration in weak shear studies (see the recent papers on MS1008 and A2219 ). s allow to improve the identification of the “visible” counterpart of lensing structures, to determine their redshifts and to measure ratios of clusters, groups, etc.
s allow to optimize the spectroscopic surveys of faint lensed sources (visible versus near-IR domains), and to identify ambiguous spectral features (emission lines). Before the recent VLT survey on AC114 (Le Borgne et al. this conference), all spectroscopically confirmed lensed sources were “bright” (). Because a redshift accuracy of is enough for most applications, s allow to go further in magnitude when deriving the statistical properties of faint sources. Besides, combining and lensing inversion techniques provides with an alternative way to determine the redshift distribution of sources. A future development should be the study of the systematics and biases introduced by GTs when they are used to access the distant population of faint sources. The typical uncertainty in the amplification factor is 0.3 magnitudes, a value which is similar to model uncertainties when deriving intrinsic luminosities and SFRs of background sources with relatively well constrained SED ( accuracy). Only well known lenses are actually useful as GTs.
Conversely, lensing clusters could be considered as a tool to calibrate s beyond the reach of standard spectroscopy, up to the faintest limits in magnitude, thus allowing to extend the training set for s. The sample of lensing clusters available has to be enlarged, in order to obtain a weakely biased image of the averaged properties of sources along different lines-of-sight. In order to sample a statistically significant field at in the strong amplification domain (close to the corresponding caustic lines), we need to study about 10 different and well-known cluster lenses. The Ultra-Deep Photometric Survey of cluster lenses and the subsequent spectroscopic follow up of sources constitute a well defined program for 10m ground-based telescopes and the future NGST.
Acknowledgments
This work was supported by the TMR Lensnet ERBFMRXCT97 - 0172 (http : // www.ast.cam. ac.uk /IoA/lensnet), the ECOS SUD Program, the French Centre National de la Recherche Scientifique, and the French Programme National de Cosmologie (PNC).
References
References
- [1] Altieri, B., et al. A & A 343, L65 (1999).
- [2] Arnouts, S., Cristiani, S., Moscardini, L., Matarrese, S., Lucchin, F., Fontana, A., Giallongo, E., MNRAS 310, 540 (1999)
- [3] Athreya R., Mellier Y., Van Waerbeke L., Fort B., Pelló R., Dantel-Fort M., A & A submitted, astro-ph/9909518 (2000).
- [4] Bézecourt J., Hoekstra H., Gray M. E. , AbdelSalam H. M. , Kuijken K. , Ellis R. S., A & A submitted, astro-ph/0001513 (2000).
- [5] Blain, A. W., Kneib, J.-P., Ivison, R. J., Smail, I., ApJ 512, L87 (1999)
- [6] Bolzonella, M., Miralles, J.M., Pelló, R., A & A submitted, astro-ph/0003380, (2000).
- [7] Ebbels, T.M.D., et al., MNRAS 295, 75 (1998).
- [8] Fernández-Soto, A., Lanzetta, K.M., Yahil, A., ApJ 513, 34 (1999)
- [9] Franx, M., et al., ApJ 486, 75 (1997)
- [10] Frye, B., Broadhurst T., ApJ 499, 115 (1998)
- [11] Furusawa, H., Shimasaku, K., Doi, M., Okamura, S., ApJ in press, astro-ph/9912447, (2000)
- [12] Giallongo, E., D’Odorico,, S., Fontana, A., Cristiani, S., Egami, E., Hu, E., McMahon, R.G., AJ 115, 2169 (1998)
- [13] Gwyn, S.D.J., Hartwick F.D.A., ApJ 468, L77 (1997)
- [14] Kawasaki W., Shimasaku K., Doi M., Okamura S., A&AS 130, 567 (1998)
- [15] Kneib, J.-P., Alloin, D., Pelló, R., A & A 339, 65 (1998).
- [16] Kepner J., Fan X., Bahcall N., Gunn J., Lupton R., ApJ 517, 78 (1999)
- [17] Lanzetta, K.M., Yahil, A., Fernández-Soto, A., Nature 381, 759 (1996)
- [18] Mellier, Y., ARA & A 37, 127 (1999)
- [19] Mobasher, B., Rowan-Robinson, M., Georgakakis, A., Eaton, N., MNRAS 282, L7 (1996)
- [20] Olsen L.F., et al., A&A 345, 363 (1999)
- [21] Pelló, R., Leborgne, J.F., Miralles, J.M., Bruzual, G., Proceedings of the 14th IAP Meeting ”Wide Field Surveys in Cosmology” (1998).
- [22] Pelló, R. et al., A & A 346, 359, (1999).
- [23] Pelló, R., Miralles, J. M., Le Borgne, et al., A & A 314, 73 (1996).
- [24] Smail, I., Ivison, R. J., Blain, A. W., Kneib, J.-P., AAS 192, 4813 (1998).
- [25] Sawicki, M.J., Lin, H., Yee, H.K.C., AJ 113, 1 (1997)
- [26] Trager, S. C., Faber, S. M., Dressler, A., Oemler, A. Jr., ApJ 485, 92 (1997).