Searches for astronomical neutrino sources and WIMPs with Super-Kamiokande
Super-Kamiokande Collaboration, submitted by A. Okada1
1 Institute for Cosmic Ray Research, University of Tokyo, Kashiwa, Chiba 277-8582, Japan
Abstract
Searches for astronomical neutrino sources and weakly interactive massive particles (WIMPs) using the Super-Kamiokande detector have been performed. We select the neutrino-induced upward muon events for the first 4 years, which is already the world largest data sample, and look for statistically significant excesses compared to the atmospheric neutrino background. No excess has been found so far. Limits of upward muon flux from various potential sources are obtained. Also limits of upward muon flux due to annihilations of WIMPs in the Earth core, the Sun and the Galactic center are obtained as a function of WIMP masses.
1 Introduction
High energy neutrinos other than the atmospheric ones are expected to come from energetic astronomical objects, where protons and/or ionized nuclei are efficiently accelerated, and also from special places where ultra-heavy particles are rich and can decay or annihilate. Examples of the former objects are pulsars, active galactic nuclei, etc. where accelerated particles can interact with nearby gases or photons resulting in pion/kaon decays. Examples of the latter are the core of Earth, Sun, Galactic center, etc. where relic WIMPs produced at the time of Big Bang are trapped via elastic scatterings and made annihilate with each other.
To find such high energy neutrinos being excess in specified directions, upward going muons produced in rock surrounding the Super-Kamiokande via charged current interactions of neutrinos are used. Assuming the same energy spectrum as that of atmospheric neutrinos, the average energies of neutrinos are ranging around 10GeV for muons stopping inside the detector and around 100GeV for those going out through the detector, respectively, with muon track lengths 7m in the detector.
Therefore the upward going muons keep directions of parent neutrinos better than the muons produced inside the detector which have average energy of about 1GeV. As well known, higher energy neutrinos with their larger interaction cross section and longer path length of the resulting muons will compensate the disadvantage of their low flux, especially for a harder spectrum generally expected from an astronomical origin.
The most likely candidate of WIMP is the neutralino assuming the lightest supersymmetric particle of supersymmetric theories. Current LEP data and cosmological constraints impose the allowed range of the neutralino mass between 50GeV and 600GeV [1]. This mass range matches the energies of the upward going muons ( 1.6GeV).
2 Detection of upward muons
The Super-Kamiokande detector is a 50 kton cylindrical water Cherenkov calorimeter located at the Kamioka Observatory 1000 m underground in the Kamioka mine, Japan. The detector is divided by an optical barrier instrumented with photomultiplier tubes (“PMT”s) into a cylindrical primary detector region (the Inner Detector) with inward-facing 11,146 50cm PMTs and a surrounding shell of water (the Outer Detector) equipped with 1,885 20cm PMTs which allows the tagging of entering and exiting particles [4].
The cosmic ray muon rate at Super-K is 2.2 Hz. Because of this dominant background, the downgoing muons can not be used for the present analysis. The trigger efficiency for a muon entering the detector with momentum more than 200 MeV/ is 100% for all zenith angles. The nominal detector effective area for upward coming muons with a track length 7m in the Inner Detector is 1200 m2.
An event is classified as an upward going muon, if all the following criteria have been satisfied. They are a) a muon event that has a clear entering signature, b) particle track’s zenith angle cosine being less or equal to 0, and c) length of track inside the Inner detector being greater than 7m.
For each event, we obtain the arrival direction and time. After a visual scan by two independent groups and a final handfit direction, 1265 upward through-going and 311 upward stopping muons have been observed in 1138 live observing days that span between April of 1996 and Nov of 1999. The handfits agree with each other within 1.5∘. More details of the data reduction procedures can be found in [4].
The above sample is contaminated by some downward going cosmic ray muons close to the horizon due to the tracking angular resolution of the detector and multiple Coulomb scattering in the rock. The total numbers of such non- background events has been estimated to be 9.1 0.8 for the upward through-going muons and 21.4 8.8 for the upward stopping muons, all contained in the -0.1 cos 0 bin, where is the zenith angle. The contamination from photoproduced upward going pions from downward going cosmic ray muons is estimated to be [5].
3 Analysis for point source search
3.1 Sigma deviation sky map
To find out the direction(s) of the sky from which the upward muon events show statistically significant excess, a sigma excess sky map is generated. The expected noise and its standard deviation for each sky point is calculated using so called bootstrap method. In this method, the real data is used to generate faked sky maps by swapping the event time and event direction randomly. Because of an usage of the real events, all the systematics due to upward muon angular distribution, neutrino oscillation, live time unevenness in sidereal day, etc. are all taken care of automatically. However, if there is a strong astronomical neutrino source in the direction of south pole, this method of using the real data could lead to an underestimate of the source. We are under investigation of such effects by a Monte Carlo simulation.
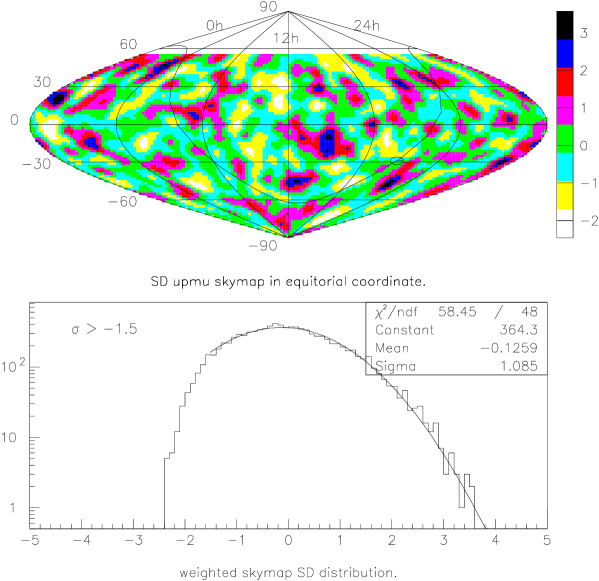
To generate sigma deviation sky map, each upward muon is smeared with a Gaussian distribution of 4 degree sigma. Here, 4 degree is the angular deviation of a typical upward through-going muon from the direction of its parent neutrino. Then, weight contributions of each event to entire sky points are calculated and summed up at each point. The resulting weighted sky map is compared with the average noise weight and its standard deviation to calculate sigma deviation of each sky point. The result is shown in Figure 1.
![[Uncaptioned image]](/html/astro-ph/0007003/assets/x2.png)
In the same figure, fit result of sigma deviation distribution to the Gaussian above 1.5 sigma deficit is also shown. As one can see in this figure, a fit to Gaussian is reasonable in this area and there is no data point above 3.6 sigma excess. Therefore, there is no sign of statistically significant excess in upward muon data in the sky.
3.2 Flux limits from neutrino point sources
Flux limits against various potential neutrino sources are obtained by the following procedure. First, the number of upward muons within 4 degree half angle cone from the sources is counted. Then, 90 % Poisson confidence limit for that number is used to calculate flux limit for the source. Table 1 shows the flux limit results for the selected potential neutrino sources, which are comparable with the latest data from the MACRO Collaboration [6]. The expected noise in this table is calculated using the same faked sky map method described above, though no noise is subtracted to calculate the flux limit in the table.
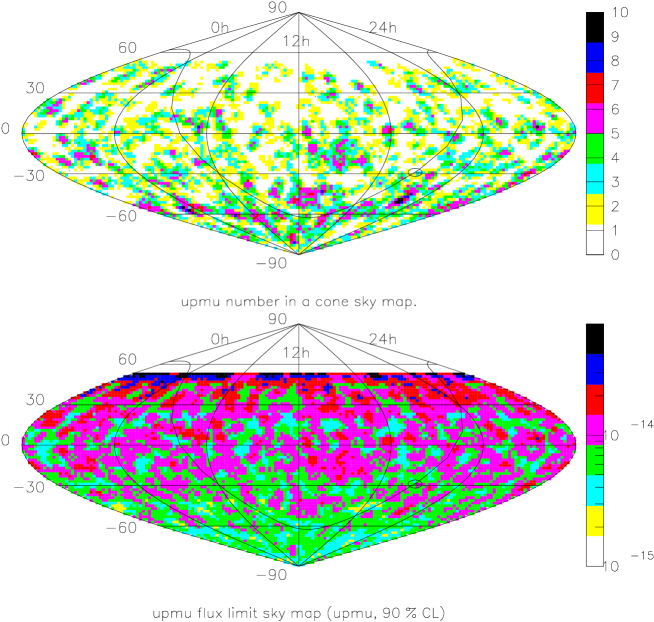
The same method is employed to obtain flux limit for each of sky points. The resulting sky map is shown in Figure 2, along with a figure showing the number of upward muons in the cone. In the Figure 3, the event number distribution of upward muons in the cone is shown with that expected from noise. This noise distribution is also obtained using the faked sky map method mentioned above. The event number distribution of upward muons is consistent with noise, hence there is no sign of astronomical neutrino source in this method either.

4 Analysis for WIMP search
Recently the WIMP search at Super-Kamiokande was reported [7]. Here updated data are presented.
4.1 Comparison of data with simulations of atmospheric neutrinos
The expected background for a WIMP search, which is due to interactions of atmospheric ’s in the rock below the detector is evaluated with 40-year Monte Carlo simulations. These simulations use the Bartol atmospheric flux [8], the GRV94 parton distribution function [9], and energy loss mechanisms of muons in rock from [10]. There is a 20 uncertainty in the prediction of absolute upward-going muon fluxes.
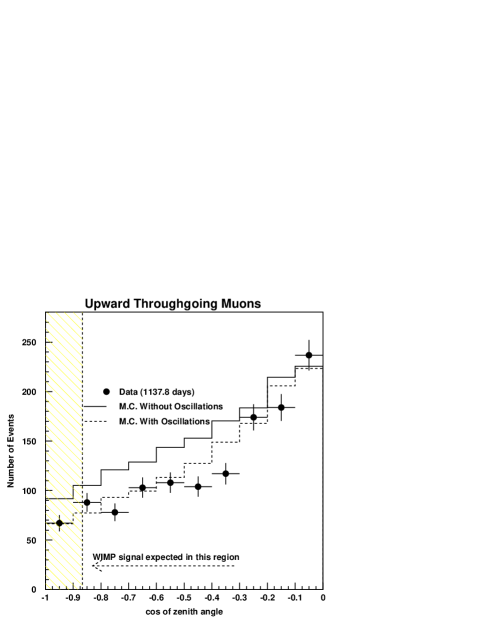
Analysis of the most recent Super-Kamiokande data [11] of upward going muons and contained events is consistent with oscillations with and being the best fit values. Therefore for evaluating our background we suppress the atmospheric muon neutrino flux due to oscillations from to . The distribution of upward through-going muons with respect to the Earth is shown in Figure 4.
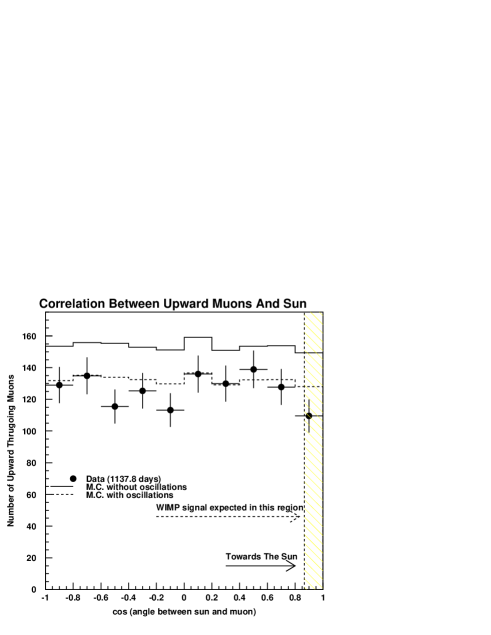
In order to compare the expected and observed distribution of upward through-going muon events with respect to the Sun and Galactic Center, each Monte Carlo event was assigned random times based on the arrival times of the observed upward through-going muon events. This procedure allows us to obtain the angle between the upward muon and any celestial object for each Monte Carlo event. The distribution of upward muons with respect to the Sun and the Galactic Center is shown in Figures 5 and 6 respectively. All the Monte Carlo events in Figures 4,5 and 6 are normalized by livetime.

4.2 Flux limits due to WIMPs
We searched for statistically significant excess of muons in cones with half angles ranging from 5 to 30 degrees. This ensures that we catch about of the signal for a wide range of WIMP masses. Thus, searching in different cone angles allows us to optimize the signal to noise ratio for various neutralino masses.
No statistically significant excess was seen in any of the half angle cones. We calculate the flux limit of excess neutrino-induced muons in each of the cones.
The flux limit is obtained from the upper Poissonian limit (90 C.L.) given the number of measured events and expected background [12] due to atmospheric neutrinos, taking into account oscillations.
We also found that varying the oscillation parameters and other normalization schemes hardly changes the flux limits close to the celestial objects. It is only in the cone with half angle that the flux limits vary within 10 for different oscillation parameters.
The comparison of Super-Kamiokande flux limits with previous estimates by other experiments is shown in Figures 7, 9, and 9 respectively. All the other experiments have muon energy thresholds around 1 GeV. The WIMP flux limits for Earth and Sun by MACRO, Kamiokande, Baksan, and IMB are in [13, 14, 15, 16] respectively. The WIMP flux limits for the Galactic Center by MACRO, Kamiokande, IMB, and Baksan are in [17, 18, 19, 20] respectively.
Once WIMPs are captured in the Sun and the Earth they settle to the core with an isothermal distribution equal to the core temperature of the Sun or the Earth [21]. The Kamiokande collaboration [14] has calculated the angular windows for Sun and Earth which contain 90 of signal for various neutralino masses. These angular windows agree quite well with those obtained by the MACRO collaboration [22] for masses down to 20 GeV. Using these windows, 90 confidence level flux limits can be calculated as a function of neutralino mass using cones which collect 90 of expected signal for any given mass. These flux limits as a function of neutralino mass are shown in Figure 10 for Earth and Sun.
Contrary to the Sun and Earth, the annihilation profile for the Galactic Center does not depend on the neutralino mass, because collisionless particle dark matter does not come into thermal equilibrium near the Galactic Center [23]. However the apparent size of the annihilation region is less than 0.05∘. Hence the Galactic Center can be considered a point source for WIMP annihilation. Thus, similar to the Sun, one can exploit the angular dependence of the charged current interaction and multiple coulomb scattering on neutrino energy to obtain the flux limits for the Galactic Center as a function of mass. The results are shown also in Figure 10 (bottom).
These flux limits can be compared with predictions from supersymmetry models. Recently, the DAMA/NaI experiment for direct detection of dark matter reported an annual modulation effect at 4 confidence level which they claim is caused by WIMP scattering in their detector [24]. Their data is consistent with a relic neutralino forming a major dark matter component of the Galactic Halo [25]. The Super–Kamiokande flux limits could be used to rule out some regions of parameter space suggested by DAMA results, These results shall be reported in a future publication.


5 Conclusions
A search for astronomical neutrino point sources was done using neutrino induced 1265 upward through-going and 311 upward stopping muon events corresponding to 1138 days of livetime. Also an indirect search for dark matter was done using the 1265 upward through-going muon events on the plausible assumption that high energy neutrinos can be produced from WIMP annihilation in the Sun, the Earth, and the Galactic Center.
We looked for an excess of upward muons over atmospheric neutrino background in the direction close to the potential celestial objects. No statistically significant excess was seen.
Flux limits from almost all directions in the sky were obtained and the definite numbers are given to various prominent astronomical objects. Also flux limits for various cone angles around the potential WIMP sources were obtained and compared with previous estimates by other detectors. These flux limits can be calculated as a function of the WIMP mass.
Acknowledgments
We gratefully acknowledge the cooperation of the Kamioka Mining and Smelting Company. The Super-Kamiokande experiment has been built and operated from funding by the Japanese Ministry of Education, Science, Sports and Culture, and the United States Department of Energy.
References
- [1] J. Ellis: Talk presented at COSMO 98, Asilomar, California, astro-ph/9903003
- [2] Super-Kamiokande Collaboration, Y. Fukuda et al.: Phys. Rev. Lett. 82, 2644 (1999)
- [3] Super-Kamiokande Collaboration, Y. Fukuda et al.: Phys. Lett. B467, 185 (1999)
- [4] Super-Kamiokande Collaboration, Y. Fukuda et al.: Phys. Lett. B433, 9 (1998)
- [5] MACRO Collaboration, M. Ambrosio et al.: Astropart. Phys. 9, 105 (1998)
- [6] MACRO Collaboration, M. Ambrosio et al.: astro-ph/0002492 (submitted to Astrophys.J.)
- [7] S. Desai, for the Super-Kamiokande Collaboration: Talk at the 4th International Symposium on Sources & Detection of Dark Matter in the Universe (2000)
- [8] V. Agrawal, T. K. Gaisser, P. Lipari, and T. Stanev: Phys. Rev. D 53, 1314 (1996)
- [9] M. Glück, E. Reya and A. Vogt: Z. Phys. C67, 433 (1995)
- [10] P. Lipari and T. Stanev: Phys. Rev. D 44, 3543 (1991)
- [11] Y. Totsuka, Invited talk at the XVth Particles and Nuclei International Conference, PANIC99, Uppsala (1999)
- [12] C. Caso et al.: Review of Particle Physics, Eur. Phys. J. C 3, 1 (1998)
- [13] D.G. Michael, for MACRO Collaboration: Talk at the 4th International Symposium on Sources & Detection of Dark Matter in the Universe (2000)
- [14] Kamiokande Collaboration, M. Mori et al.: Phys. Rev. D 48, 5505 (1993)
- [15] O.V. Suvorova: hep-ph/9911415 (1999)
- [16] IMB Collaboration, J.M. LoSecco et. al.: Phys. Lett. B 188, 388 (1987)
- [17] MACRO Collaboration M. Ambrosio et al.: astro-ph/0002492
- [18] IMB Collaboration, R. Svoboda et. al.: Astrophys. J. 315, 420 (1987)
- [19] Kamiokande Collaboration, Y. Oyama et. al.: Phys. Rev. D 39, 1481 (1989)
- [20] Baksan Collaboration, M.M. Boliev et. al.: Proc. 24th ICRC (Rome) 1, 722 (1995)
- [21] G. Jungman, M. Kamionkowski, and K. Griest: Phys. Rep. 267, 195 (1996)
- [22] MACRO Collaboration, M. Ambrosio et al.: Phys. Rev. D 60, 082002 (1999)
- [23] P. Gondolo and J. Silk: Phys. Rev. Lett. 83, 1719, (1999)
- [24] R. Bernabei et al.: University of Rome Report No.2F/2000/01 and INFN/AE-00/01
- [25] A. Bottino, N. Fornengo, F. Donato, and S. Scopel: Report No. DFTT 1/2000, IFIC/00-12, FTUV/00-11, LAPTH-779/2000, hep-ph/0001309