Stellar Populations in the Host Galaxies of Mrk 1014, IRAS 07598+6508, and Mrk 231111Based on observations made with the NASA/ESA Hubble Space Telescope, obtained from the data archive at the Space Telescope Science Institute, which is operated by the Association of Universities for Research in Astronomy, Inc., under NASA contract NAS 5-26555.
Abstract
We present deep spectroscopic and imaging data of the host galaxies of Mrk 1014, IRAS 07598+6508, and Mrk 231. These objects form part of both the QSO and the ultraluminous infrared galaxy (ULIG) families, and may represent a transition stage in an evolutionary scenario. Our imaging shows that all three objects have highly perturbed hosts with tidal tails and destroyed disks, and appear to be in the final stages of major mergers. The host galaxies of the three objects have spectra typical of E+A galaxies, showing simultaneously features from an old and a young stellar component. We model spectra from different regions of the host galaxies using Bruzual & Charlot (1996) spectral synthesis models using two component models including an old underlying population and recent superposed starbursts. Mrk 1014 has intense star formation concentrated in a large knot kpc from the nucleus, along the leading edge of the tidal tail, and in several knots scattered around the host. The starburst ages in these regions range from 180 to 290 Myr. IRAS 07598+6508 has multiple knots of star formation concentrated in two regions within 16 kpc of the QSO nucleus, with ages ranging from 30 to 70 Myr; the host galaxy shows an older population in other regions. Mrk 231 shows a wider range of starburst ages, ranging from 42 Myr in the arc 3 kpc south of the nucleus, to Myr spread on a “plateau” kpc across around the nucleus, as well as a UV bright region 12 kpc south of the nucleus, which is apparently a region of currently active star formation. Our results indicate a strong connection between interactions and vigorous bursts of star formation in these objects. We propose that the starburst ages found are indicative of young ages for the QSO activity. The young starburst ages found are also consistent with the intermediate position of these objects in the far infrared color-color diagram.
1 Introduction
There has long been considerable circumstantial evidence that at least some luminous, low-redshift QSOs are the result of strong interactions or mergers of galaxies Toomre & Toomre, 1972; Gunn, 1979; Stockton, 1982; Hutchings & Neff, 1992; McLeod & Rieke, 1994, e.g.,; see Stockton, 1999 for a review. However, a concrete suggestion for an evolutionary scenario for such objects was lacking until Sanders et al. (1988a) showed that ultraluminous infrared galaxies (ULIGs), virtually all of which are compelling examples of ongoing mergers, had bolometric luminosities and space densities similar to those of QSOs. These similarities suggested the possibility that ULIGs are dust-enshrouded QSOs which, after blowing away the dust, become classical QSOs.
If this hypothesis is correct, one should be able to observe examples of objects that are at intermediate stages of this evolutionary sequence. We are conducting a study of a sample of low-redshift objects that may be in such a transitionary state. These objects are recognized as bona-fide QSOs and are found at an intermediate position in a far infrared (FIR) color-color diagram between the regions occupied by typical QSOs and ULIGs (see Fig. 1). FIR color–color diagrams have been used as tools to detect and discriminate different types of activity in the nuclear and circumnuclear regions of galaxies. Different kinds of objects such as QSO/Seyfert, starbursts, and powerful IR galaxies, occupy fairly well defined regions in the diagram (see, e.g., Neugebauer et al., 1985; de Grijp et al., 1987; Taniguchi et al., 1988; Lípari, 1994). With deep imaging and spectroscopic observations of the host galaxies, we are attempting to construct interaction histories for each of these “transition” objects.
If strong interactions triggered the QSO activity and induced starbursts, one might expect both events to occur roughly simultaneously, since both are plausibly dependent on gas flows to the inner regions. Thus, we are placing these objects on an age sequence by measuring the time elapsed since the last major starburst event. This age sequence along with interaction histories can help us answer the question of whether the intermediate position of these objects is indicative of evolution from the ULIG to the classical QSO population, or whether it simply indicates a range of characteristics in QSOs.
Our sample is drawn from the Neugebauer et al. (1986), Low et al. (1988), and Clements (1996) samples of Infrared Astronomical Satellite22footnotemark: 2 (IRAS) objects, and it consists of those objects which have: (1) a luminosity above the cutoff defined for quasars by Schmidt & Green (1983), i.e., for km s-1 Mpc-1 (or for km s-1 Mpc-1), (2) a redshift , (3) a declination , (4) firm IRAS detections at m, m, and m, and (5) a position in the FIR color–color diagram which is intermediate between the ULIG and QSO loci (Fig. 1). Although Mrk 231 just misses the luminosity threshold given above, its active nucleus is known to suffer heavy extinction (see §5), apart from which it would clearly be a member of the sample. We know of no other objects satisfying the other criteria for which this is true. We have therefore chosen to include it for the present, although it may be approriate to exclude it from some of the analyses of the whole sample, which will be presented in a subsequent paper.
So far, we have presented results for two of the nine objects in the sample: 3C 48 (Canalizo & Stockton, 2000, hereafter CS2000), an ongoing merger near the peak of starburst activity; and PG 1700+518 Canalizo & Stockton, 1997; Stockton et al., 1998, hereafter CS97 and SCC98; see also Hines et al., 1999, where a tidally disturbed companion with a dominant 85 Myr old post-starburst population may be in the process of merging with the host galaxy. In this paper we present the results for three additional objects: Mrk 1014, IRAS 07598+651, and Mrk 231. We assume km s-1 Mpc-1 and throughout this paper, so that the projected physical length subtended by 1″ is 2.43 kpc for Mrk 1014, 2.26 kpc for IRAS 07598+651, and 0.77 kpc for Mrk 231.
2 Observations and Data Reduction
Spectroscopic observations for the three objects were carried out using the Low-Resolution Imaging Spectrometer (LRIS; Oke et al., 1995) on the Keck II telescope. For IRAS 07598+6508, we used a 600 groove mm-1 grating blazed at 5000 Å yielding a dispersion of 1.28 Å pixel-1. For Mrk 231 and Mrk 1014, we used a 300 groove mm-1 grating blazed at 5000 Å with a dispersion of 2.44 Å pixel-1. The slit was 1″ wide, projecting to 5 pixels on the Tektronix 20482048 CCD. We obtained two or three exposures for each slit position, dithering along the slit between exposures. Table 1 shows a complete journal of observations, with specification of the slit positions, and total integration times.
The spectra were reduced with IRAF, using standard reduction procedures. After subtracting bias, dividing by a normalized halogen lamp flat-field frame and removing sky lines, we rectified the two-dimensional spectra and placed them on a wavelength scale using the least-mean-squares fit of cubic spline segments to identified lines in a Hg-Kr-Ne lamp. We calibrated the spectra using spectrophotometric standards from Massey et al. (1988) observed with the slit at the parallactic angle. The distortions in the spatial coordinate were removed with the IRAF apextract routines. For each slit position, we had two or three individual frames; we averaged the spatially corrected spectra using the IRAF task scombine. We then corrected the spectra for Galactic extinction, using the values given by Schlegel et al. (1998).
Since we were aiming to observe the youngest populations in the host galaxies of these objects, we chose the slit positions based on previously obtained color maps of the host galaxies. We obtained imaging data for the three objects with the University of Hawaii 2.2 m telescope as specified in Table 2. Observations with the filter (centered at 3410 Å with a bandpass of 320 Å) sample the spectral energy distribution (SED) of galaxies on the short side of both the 4000 Å break and the Balmer limit. This region is very sensitive to the age of the stellar population, and will be brightest in regions of very recent star formation (ages Myr), as well as regions with scattered QSO continuum. Observations in band sample the region redwards of the Balmer limit, where A-type stellar populations are expected to peak, while longer wavelength optical and near infrared images will map the distribution of late-type stellar populations. The color maps will then highlight the regions of most recent star formation while will point to the somewhat older ( Myr) populations. Thus our slit positions generally cover the regions brightest in these color maps. In general, the spectra from each slit position were subdivided into regions corresponding to some of the main features observed in the optical ground-based images, and one-dimensional spectra were extracted by summing pixels corresponding to the regions of interest.
The spectra of regions close to the QSO nucleus were contaminated by scattered QSO light. The scattered light was removed by subtracting from each region a version of the quasar nuclear spectrum, scaled to match the broad-line flux. In the case of Mrk 1014, none of our slit positions went through the QSO, so we obtained a separate 200 s exposure of the nucleus.
Spectra from those slit positions which actually went through the QSO nucleus suffered from strong light scattering within the spectrograph, particularly in the spectral region around H. Therefore we were unable to obtain spectra of regions closer than ″ from the QSO nucleus for these slit positions.
HST WFPC2 images of the three objects were obtained from the HST data archive. We used three 600 s WFC2 images of Mrk 1014 in the F675W filter, one 400 s and two 600 s PC1 images of IRAS 07598+6508 in the F702W filter, and two 1100 s PC1 images of Mrk 231 in the F439W filter. Most cosmic rays were removed by subtracting a median image from each of the individual frames, then thresholding the difference at a 3 level, setting points above this threshold to the median of the difference image. Pixels near the position of the peak of the QSO were excluded from this process. The corrected difference image was then added back to the median image, giving a corrected version of the original image. The few cosmic rays within the relevant region that escaped this process were removed manually with the IRAF task imedit. In the case of Mrk 231, where only two images were available, we first subtracted one from the other, and proceeded as above. The procedure was repeated, interchanging the images. All the corrected images for each object were then averaged.
2.1 Modeling Spectra
We use Bruzual & Charlot (1996) isochrone synthesis models to fit the spectra of the host galaxies. We will see in the following sections that the three objects which are the subject of this paper show strong evidence of having undergone some major tidal interaction. As we have described in our previous work (CS97, CS2000), spectra of the host galaxies of such objects show features from both young (e.g., strong Balmer lines) and old (e.g., Mg I b absorption) stellar populations, and can usually be fitted satisfactorily by a two-component model. This model includes an old underlying stellar population, presumably the stellar component present prior to interaction, and a younger instantaneous burst model, presumably produced as a result of the interaction. A population with no age dispersion will be a reasonable approximation of the actual starburst as long as the period during which the star formation rate was greatly enhanced is short compared to the age of the population itself.
We have also noted previously (SCC98) that the age of the superposed starburst is remarkably robust with respect to the different assumptions about the nature of the older stellar component. Thus, we select a reasonable old underlying population (with certain variations as described in each section below) and assume that the same underlying population is present everywhere in the host galaxy. To this population we add instantaneous burst, Scalo (1986) initial mass function, solar metallicity models of various ages. We then perform a fit to the data to determine the scaling of each component and the age of the most recent starburst. The errors in the starburst ages that we quote are estimated by noting the youngest and oldest best fits for which changes by 15% with respect to the minimum value (see CS2000 for details).
In some cases, stellar absorption features (most often the Balmer lines) were contaminated by emission coming from the extended narrow emission line region around the QSO. In some cases, we subtracted a scaled synthetic spectrum of the recombination lines assuming Case B. However, in calculating for the model fitting, we generally excluded those lines that suffered most from contamination. All spectra are displayed as observed (i.e., without line subtraction), unless otherwise specified.
As we discussed in CS2000, because of our limited spatial resolution (generally ) and projection along the line of sight, we are likely observing the integrated spectrum of several starbursts of different ages, and the age we determine will be somewhat older than the youngest starbursts. Therefore the ages we report should be regarded as upper limits to the most recent episodes of star formation along the line of sight.
In objects with recent starbursts, the effect of reddening by dust is an obvious concern. However, studies of low-redshift AGNs and ULIGs at millimeter and submillimeter wavelengths indicate that dust is generally heavily concentrated within kpc of the nucleus (Andreani et al., 1999; Bryant & Scoville, 1996). In addition, have found (SCC98) that even in a case where the optical—IR spectral index is strongly affected by dust, the stellar ages from spectral features in the rest-frame 3200–5200 Å region remain fairly robust. This relative insensitivity to dust can be attributed to the fact that we are largely dealing with dust that is intermixed with the stars and that we preferentially observe regions with low extinction and, thus, low reddening. Even in regions where dust along the line of sight is significant, the reddening in our observed bandpass is likely to be largely compensated by blue light scattered into our line of sight.
3 Mrk 1014
Mrk 1014 () is a luminous (M), infrared loud (e.g., Sanders et al., 1988b) radio-quiet QSO which shows a luminous host galaxy. The host galaxy has two large “spiral-like arms” (MacKenty & Stockton 1984; see Fig. Stellar Populations in the Host Galaxies of Mrk 1014, IRAS 07598+6508, and Mrk 231111Based on observations made with the NASA/ESA Hubble Space Telescope, obtained from the data archive at the Space Telescope Science Institute, which is operated by the Association of Universities for Research in Astronomy, Inc., under NASA contract NAS 5-26555. and Fig. Stellar Populations in the Host Galaxies of Mrk 1014, IRAS 07598+6508, and Mrk 231111Based on observations made with the NASA/ESA Hubble Space Telescope, obtained from the data archive at the Space Telescope Science Institute, which is operated by the Association of Universities for Research in Astronomy, Inc., under NASA contract NAS 5-26555.). Its spectrum indicates a mixture of old and young stars (MacKenty & Stockton, 1984; Heckman et al., 1984; Hutchings & Crampton, 1990).
Recently, Nolan et al. (2000), in a spectroscopic survey of 26 RLQs, RQQs, and radio galaxies, observed the host galaxy of Mrk 1014 with the Mayall 4 m telescope at Kitt Peak National Observatory and with the 4.2 m William Herschel telescope at La Palma. They modeled the spectra and determined an age of 12 Gyr for the host galaxy of Mrk 1014. Their approach is exactly opposite to ours (see §2.1): they fix the age of a possible young single starburst population to 0.1 Gyr and let that of a second, older single starburst population (what we would call the “underlying population”) vary. Their reason for including the 0.1 Gyr population is to account for “the spectral shape of the blue light” which they attribute to either a recent burst of star formation or contamination of the slit by scattered light from the QSO nucleus. Their results will be discussed further in §3.1.
3.1 Stellar Populations
The host galaxy of Mrk 1014 shows stellar absorption features with redshifts remarkably close to those of the QSO broad and narrow emission lines (, as measured from our spectrum).
We have obtained and modeled spectra of different regions in the host galaxy of Mrk 1014, and we shall refer to them according to their label in Fig. Stellar Populations in the Host Galaxies of Mrk 1014, IRAS 07598+6508, and Mrk 231111Based on observations made with the NASA/ESA Hubble Space Telescope, obtained from the data archive at the Space Telescope Science Institute, which is operated by the Association of Universities for Research in Astronomy, Inc., under NASA contract NAS 5-26555.. We have chosen a 10 Gyr old population with an exponentially declining star formation rate with an e-folding time of 3 Gyr as an old underlying population. This model fits reasonably well the spectrum of a galaxy 60″ west-southwest of the QSO at the same redshift and only slightly smaller than the “bulge” (see below) of Mrk 1014. (This galaxy was in our slit while obtaining the 200 s exposure of the QSO). The assumption that the host galaxy (or parent galaxies) of Mrk 1014 had a similar star formation history to this galaxy need not be accurate as the precise model we use as the pre-existing population makes little difference in the age determination of the starburst population (SCC98). For comparison, we have tried using a generic elliptical galaxy spectrum, and a model with a longer e-folding time (i.e., 5 Gyr) as underlying populations in the modeling of the spectra in Mrk 1014. We obtain the same starburst ages, though slightly different flux contributions from the old population, regardless of the model used.
Figure Stellar Populations in the Host Galaxies of Mrk 1014, IRAS 07598+6508, and Mrk 231111Based on observations made with the NASA/ESA Hubble Space Telescope, obtained from the data archive at the Space Telescope Science Institute, which is operated by the Association of Universities for Research in Astronomy, Inc., under NASA contract NAS 5-26555. includes a color map of Mrk 1014. This image emphasizes those regions with a steeper blue continuum spectrum, peaking just redwards of the Balmer limit. These regions are concentrated mainly along the north edge of the tail (regions and in Fig. Stellar Populations in the Host Galaxies of Mrk 1014, IRAS 07598+6508, and Mrk 231111Based on observations made with the NASA/ESA Hubble Space Telescope, obtained from the data archive at the Space Telescope Science Institute, which is operated by the Association of Universities for Research in Astronomy, Inc., under NASA contract NAS 5-26555.), in a clump on the east end of the tail (), directly east of the nucleus (not covered by our slits), and southwest of the QSO nucleus ().
Spectroscopy of these regions confirms that they are indeed the youngest stellar populations we find in the host, with ages ranging from 180 Myr in region to 290 Myr in region . Figure 2 shows the spectrum of region , with the best fit of the model to the data superposed, and the relative contributions of the 200 Myr starburst and the old underlying population. The error in these ages is typically Myr. Figure Stellar Populations in the Host Galaxies of Mrk 1014, IRAS 07598+6508, and Mrk 231111Based on observations made with the NASA/ESA Hubble Space Telescope, obtained from the data archive at the Space Telescope Science Institute, which is operated by the Association of Universities for Research in Astronomy, Inc., under NASA contract NAS 5-26555. shows compact knots at the positions of regions through , and Planetary Camera HST images (Surace et al., 1998) show a larger and very bright blue knot at the position of region . Even though there are knots at the positions of and , it is evident from colors and spectroscopy that there is recent star formation all along the north edge of the tail (i.e., between and ).
Other regions of the host galaxy appear redder in the color map in Fig. Stellar Populations in the Host Galaxies of Mrk 1014, IRAS 07598+6508, and Mrk 231111Based on observations made with the NASA/ESA Hubble Space Telescope, obtained from the data archive at the Space Telescope Science Institute, which is operated by the Association of Universities for Research in Astronomy, Inc., under NASA contract NAS 5-26555.. These regions, sampled by and , appear to be dominated by an older, Gyr population, and to have very little, if any, contribution from the old underlying population (Fig. 3, top panel). It is not entirely clear whether these are truly intermediate age populations, or if they are simply, as in the case of region , dominated by an old underlying population with a very small contribution from a younger population like those found in regions through . We attempted to fit models with the latter characteristics to the observed spectra. The resulting fits are reasonable, with minimum values of 10% and 25% larger than that obtained for a dominant intermediate-age population for regions and respectively. The bottom panel of Fig. 3 shows the spectrum of region with the best fit to the data of the sum of an old underlying population and a 250 Myr instantaneous burst population. While a reasonable fit, it does show significant discrepancies in the region around the 4000 Å break and the Ca II line.
The potential presence of this intermediate age population suggests that a better fit for the younger populations might be achieved by adding a third component that accounts for this intermediate age component. However the flux of the young starburst population in those regions is so dominant (typically contributing 80% of the total flux at rest-frame 5000 Å), that a third component makes a negligible difference to the fit.
Region shows very strong emission, which almost certainly comes from gas ionized by the QSO rather than from star-forming regions. The equivalent widths of the emission lines here are greater than those of the emission lines elsewhere in the galaxy by at least a factor of 5, and at least twice those of the QSO nucleus for [O III]. The emission line ratios indicate a power-law ionizing continuum (Veilleux & Osterbrock, 1987). This region is clearly seen as a large, discrete knot in Fig. 2 of Stockton & MacKenty (1987). The gas has an approaching velocity of km s-1 with respect to the stellar absorptions in that region. The underlying spectrum is similar to that of region .
Region also shows emission lines with approaching velocities of km s-1 with respect to the stellar features, but this region shows an additional, weaker emission component clearly visible in [O II], [O III], and H, blueshifted by km s-1 with respect to the stronger component. The stellar population here seems to be dominated by an old population with a small fraction of the flux coming from younger stars.
We have added spectra from two different slit positions at region to improve the signal to noise in this very faint region. This is part of the long extension on the west side clearly seen in the high contrast image in Fig. Stellar Populations in the Host Galaxies of Mrk 1014, IRAS 07598+6508, and Mrk 231111Based on observations made with the NASA/ESA Hubble Space Telescope, obtained from the data archive at the Space Telescope Science Institute, which is operated by the Association of Universities for Research in Astronomy, Inc., under NASA contract NAS 5-26555.. We find a continuum with a red SED and a clear 4000 Å break at a redshift close to, but slightly larger than that of the main body of the galaxy.
Region , which is very bright in the image in Fig. Stellar Populations in the Host Galaxies of Mrk 1014, IRAS 07598+6508, and Mrk 231111Based on observations made with the NASA/ESA Hubble Space Telescope, obtained from the data archive at the Space Telescope Science Institute, which is operated by the Association of Universities for Research in Astronomy, Inc., under NASA contract NAS 5-26555., would appear to be an extension of the east tail. However, its spectrum shows that it is a background galaxy at . Likewise, region on the west tail is a galaxy at . A third galaxy SE of the QSO (, ″) has a similar redshift as well (), so there seems to be a group or cluster of galaxies at this redshift.
The 200 s exposure spectrum of the elongated object 92 west-southwest of the QSO shows narrow emission lines at the same redshift as the QSO superposed on a red continuum. Fig. 2 of Stockton & MacKenty (1987) shows that there is strong emission just north of this object coming from extended gas ionized by the QSO and not necessarily associated with the object. The spectrum is too noisy to distinguish stellar features, so it is unclear whether this object is interacting with the system or if it is a chance projection. The near edge-on galaxy ″ west of the QSO, on the other hand, shows [O III] emission confined to the galaxy at in a University of Hawaii 2.2 m telescope spectrum (Canalizo 2000, unpublished), as suggested by Stockton & MacKenty (1987) from their [O III] imaging.
How do our results compare to those of Nolan et al. (2000)? As mentioned above, Nolan et al. use a fixed 0.1 Gyr starburst population. They determine that this population makes up 1.1% of the total luminous mass along the line of sight, and that the rest of the flux is well characterized by a 12 Gyr instantaneous burst. In contrast, we find several regions of recent ( Gyr) star formation where the star forming mass typically amounts to 12%, and sometimes up to 30%, of the total luminous mass along the line of sight. One of our slit positions is very similar to one used by Nolan et al. (see Fig. 2 in Hughes et al. 2000), but our slit is narrower and slightly closer to the nucleus. As a way to compare, we added the flux along the slit as Nolan et al. seem to have done, including the background galaxy , which is also in their slit. Even if we add up all the flux along this slit (subtracting the QSO light, which amounted to 5% of the total flux), we still find that the star forming regions make up 8% of the total luminous mass along the line of sight. Obviously, the difference in ages will lead to a smaller percentage for their choice of parameters. So, we tried fixing our parameters to match theirs (i.e., 12 Gyr + 0.1 Gyr populations), and this yields a 5% by mass for the young population, but the fit is much inferior to the ones discussed in this section. Their slit position may have fortuitously missed the major star forming regions, thus leading to this smaller percentage. We have previously cautioned (CS2000) that different slit positions can lead to different age determinations, and we emphasize the importance of carefully selecting slit positions if one wishes (as we do) to find the major starburst regions. It is also far more difficult to obtain a reliable age for an older population in the presence of a contaminating younger population than the reverse.
3.2 Interaction History
Images of Mrk 1014 show a very prominent tail extending to the northeast, reminiscent of the tidal tail of 3C 48 (CS2000). Like the tidal tail in 3C 48, this tail has a number of small clumps (see HST image in Fig. Stellar Populations in the Host Galaxies of Mrk 1014, IRAS 07598+6508, and Mrk 231111Based on observations made with the NASA/ESA Hubble Space Telescope, obtained from the data archive at the Space Telescope Science Institute, which is operated by the Association of Universities for Research in Astronomy, Inc., under NASA contract NAS 5-26555.) of star formation, which are commonly found in merging systems. The bulk of the bright portion of the tail appears to be dominated by an intermediate age population (1 Gyr) with a very small contribution, if any, from an old underlying population; alternatively, it could be dominated by an older population, with some flux scattered from the bright star-forming regions ( through ) or fainter small regions distributed along the host. However, the north edge of the tail appears as a very sharp feature in the short wavelength images, and contains stellar populations which are as young as those of the clumps. As we find no redshift variations along this edge, it would appear that we are observing the tail nearly face-on, and that this is the leading edge where the material has been compressed, thus producing star formation. This, again, is similar to the blue leading edge observed in 3C 48 (Fig. 2 in CS2000), presumably sharper in Mrk 1014 because of the lower inclination angle.
Both the ground-based and the HST images of Mrk 1014 (Figs. Stellar Populations in the Host Galaxies of Mrk 1014, IRAS 07598+6508, and Mrk 231111Based on observations made with the NASA/ESA Hubble Space Telescope, obtained from the data archive at the Space Telescope Science Institute, which is operated by the Association of Universities for Research in Astronomy, Inc., under NASA contract NAS 5-26555. and Stellar Populations in the Host Galaxies of Mrk 1014, IRAS 07598+6508, and Mrk 231111Based on observations made with the NASA/ESA Hubble Space Telescope, obtained from the data archive at the Space Telescope Science Institute, which is operated by the Association of Universities for Research in Astronomy, Inc., under NASA contract NAS 5-26555.) show a long, low-surface-brightness extension of the bright tail on the east of the nucleus and arching towards the south (more evident after the removal of the background galaxy, ) as well a very extended faint secondary tail, rotationally symmetric to the bright (primary) tail. Each tail extends for as much as ″ or 100 kpc (note the inset in Fig. Stellar Populations in the Host Galaxies of Mrk 1014, IRAS 07598+6508, and Mrk 231111Based on observations made with the NASA/ESA Hubble Space Telescope, obtained from the data archive at the Space Telescope Science Institute, which is operated by the Association of Universities for Research in Astronomy, Inc., under NASA contract NAS 5-26555. showing the well-known local interacting system M 51/NGC 5195 at the same scale). Spectra of the secondary tail west of the nucleus indicates that the tail is made up by older stars, and this is consistent with this tail being visible in our (not shown) and images. No bright clumps of star formation are evident along the secondary tail; this absence is not unusual as tidal dwarf formation appears not to be a ubiquitous process in mergers (Hibbard & Yun, 1999). The HST image of the nucleus (see inset in Fig. Stellar Populations in the Host Galaxies of Mrk 1014, IRAS 07598+6508, and Mrk 231111Based on observations made with the NASA/ESA Hubble Space Telescope, obtained from the data archive at the Space Telescope Science Institute, which is operated by the Association of Universities for Research in Astronomy, Inc., under NASA contract NAS 5-26555.) shows a small extension on the south side which follows the direction of the secondary tidal tail. A similar extension is seen in HST NICMOS images by Scoville et al. (2000). There appears to be a “bulge” or enhanced brightness area elongated roughly along the axis connecting the beginning of both tails (i.e., NW–SE), with a half radius of kpc. Assuming a projected velocity of 300 km s-1 on the plane of the sky, the dynamical age for the tails is Myr. The tails are then older than every major post-starburst knot they contain, consistent with the idea that the latter were formed after the tails were first launched. At the same time, the tails are dynamically younger than the bulk of the stars that form them, though perhaps only slightly so if the stellar populations observed in and are truly Gyr old, instead of being Gyr with a small admixture of younger stars.
Mrk 1014 shows some striking similarities to 3C 48 (CS2000): the morphology of the (primary) tidal tail, the clumps of star formation along the tail as well as its blue leading edge, the relation of the starburst ages to the dynamical age of the tails (both ages Myr younger in 3C 48), and the clumpy extended emission line region (Stockton & MacKenty, 1987) with high velocity ( km s-1) components. As with 3C 48, the data strongly suggest that Mrk 1014 is the result of a merger of two galaxies of comparable size, both of which were disks in this case. The starbursts in the main body of the host of Mrk 1014, however, appear to be less intense and less widespread than those of 3C 48.
If the intermediate age (1 Gyr) population we see in regions and is real, it may be the relic of a starburst ignited at an initial passage of the two interacting galaxies. Indeed, we know of another system (UN J10250040; Canalizo et al., 2000) where the interacting galaxies have a difference in starburst ages of this order, possibly coincident with their orbital period. If this were the case for Mrk 1014, one might expect most of the star formation at the present to be very strongly concentrated towards the nucleus, as most of the gas would have been driven towards the center starting Gyr ago.
4 IRAS 07598+6508
The luminous, , radio-quiet QSO IRAS 07598+6508 was first detected by IRAS, identified as an AGN candidate by de Grijp et al. (1987), and spectroscopically identified as a QSO by Low et al. (1988). The optical spectrum of the QSO is dominated by extremely strong Fe II emission (Lawrence, 1988; Lípari, 1994), and the UV spectrum shows low- and high-ionization broad absorption lines (BAL) extending to blueshifts of 5200 to 22000 km s (Hines & Wills, 1995; Boroson & Meyers, 1992).
Figures Stellar Populations in the Host Galaxies of Mrk 1014, IRAS 07598+6508, and Mrk 231111Based on observations made with the NASA/ESA Hubble Space Telescope, obtained from the data archive at the Space Telescope Science Institute, which is operated by the Association of Universities for Research in Astronomy, Inc., under NASA contract NAS 5-26555. and Stellar Populations in the Host Galaxies of Mrk 1014, IRAS 07598+6508, and Mrk 231111Based on observations made with the NASA/ESA Hubble Space Telescope, obtained from the data archive at the Space Telescope Science Institute, which is operated by the Association of Universities for Research in Astronomy, Inc., under NASA contract NAS 5-26555. show, respectively, ground-based and HST images of IRAS 07598+6508 (see Boyce, 1996, for a PSF-subtracted version of the HST image). These images show two clumpy regions ″ south and southeast of the QSO, bright in the PSF subtracted image, but barely visible in -band images (not shown). The great number of knots in these regions, presumably OB associations, already argues for recent star formation.
Our slit positions cover these two regions, labeled and in Fig. Stellar Populations in the Host Galaxies of Mrk 1014, IRAS 07598+6508, and Mrk 231111Based on observations made with the NASA/ESA Hubble Space Telescope, obtained from the data archive at the Space Telescope Science Institute, which is operated by the Association of Universities for Research in Astronomy, Inc., under NASA contract NAS 5-26555., as well as some of the fainter emission surrounding the nucleus. Spectra of these regions are shown in Fig. 4. Regions and are fit by single starburst models of ages and Myr respectively. The light from these starbursts dominates the spectra as we do not find any significant contribution from an older component. Although single burst models fit the data better than two-component models, there are still some discrepancies in the fit. The observed spectra show an excess with respect to the model in the region between 3900 Å and 4100 Å , apparently because the observed continuum is steeper in this region. To test whether the discrepancy could be an indication of scattered QSO light, we subtracted QSO spectra with several different scalings from the stellar spectra, but we were unable to obtain better fits.
In contrast to and , the spectra of the regions closer to the nucleus (labeled and in Fig. Stellar Populations in the Host Galaxies of Mrk 1014, IRAS 07598+6508, and Mrk 231111Based on observations made with the NASA/ESA Hubble Space Telescope, obtained from the data archive at the Space Telescope Science Institute, which is operated by the Association of Universities for Research in Astronomy, Inc., under NASA contract NAS 5-26555.) show an older stellar population (Fig. 4, bottom panel). The SEDs of these spectra are much redder and there is a clear, though not very prominent, 4000 Å break. We detect this old population from to north of the QSO and from to south of the QSO.
We were unsuccessful in attempting to subtract the QSO scattered light closer to the nucleus because of the strong light scattering along the slit in these regions. Therefore we are unable to determine whether the populations closest to the nucleus are as old as those of and or if there might be a younger starburst concentrated around the nucleus.
Regions and have a slightly higher redshift than the fainter emission around the QSO: and , compared to for the regions closer to the nucleus, but the difference is barely significant. Measuring a precise redshift for the QSO is difficult because of the strong Fe II emission contaminating the broad emission lines, and the absence of narrow emission lines. Values in the literature include as measured from CO (Solomon et al., 1997) and as measured from broad Balmer emission lines (Lawrence, 1988); both are within 180 km s-1 (and within the errors) of the values we measure for the host galaxy.
IRAS 07598+6508 has some limited extended narrow emission as seen in the [O III] image in Fig. Stellar Populations in the Host Galaxies of Mrk 1014, IRAS 07598+6508, and Mrk 231111Based on observations made with the NASA/ESA Hubble Space Telescope, obtained from the data archive at the Space Telescope Science Institute, which is operated by the Association of Universities for Research in Astronomy, Inc., under NASA contract NAS 5-26555.. The ionized gas seems to be correlated with the stellar component: the velocity difference between emission and absorption lines in regions where both are present is never larger than 50 km (notice the profile of H in Fig. 4; emission is visible slightly redshifted with respect to the absorption).
Region shows the strongest emission and appears brightest in the [O III] image. The emission line spectrum has an underlying blue continuum with stellar features. The 2-dimensional spectrum shows that this region is broken up into two discrete clumps a little over 1″ each, having some small scale velocity structure. The line flux ratios indicate that the south clump has lower ionization, and it may be an H II region rather than gas ionized by the QSO. A second, fainter component with a velocity gradient from 0 to km apparently originating from the north clump extends 1″ towards the south.
About 11″ north of the QSO, we find another emission region (labeled ) which is visible in the [O III] image, but not in any of the broad band images. No stellar continuum is evident from the spectrum, either. This region is also broken into two discrete, somewhat larger clumps, but in this case the clump closer to the nucleus has lower ionization. Both clumps are at a lower redshift than those of region , i.e., vs. in .
Our deep image (Fig. Stellar Populations in the Host Galaxies of Mrk 1014, IRAS 07598+6508, and Mrk 231111Based on observations made with the NASA/ESA Hubble Space Telescope, obtained from the data archive at the Space Telescope Science Institute, which is operated by the Association of Universities for Research in Astronomy, Inc., under NASA contract NAS 5-26555.) shows a tidal tail extending from north to the east and arching towards the south of the nucleus for ″ or kpc. The dynamical age of this feature (assuming a projected velocity of 300 km ) is Myr, again older than the starbursts ages found for this object. We have a very faint spectrum of this tail at region . The SED of the spectrum is similar to that of and , but the spectrum is too noisy to show stellar features. An [O II] emission line is confined to this region (as seen in the 2-d spectrum) at a redshift of , which is probably close to that of the stellar component as in other regions.
This tidal tail is strongly suggestive of a merger. The fact that only one tail is evident may indicate that we are seeing the result of a merger of a spiral with an elliptical galaxy. This configuration, however, could also result from the merger of two spiral galaxies, one of which is counter rotating to the relative orbit. In mergers with such geometry, the gas and stars in the counter-rotating disk are only slightly perturbed and are not pulled into tidal bridges and tails (Toomre & Toomre, 1972; Hibbard & Yun, 1999). It is also possible that a second tail may not be evident because of projection effects.
Regions and may be part of the host galaxy with enhanced surface brightness due to the recent star formation, or they may be remnants of companion galaxies which have strongly interacted with the host galaxy. In either case it is clear that these regions are tidally disturbed and they will likely be completely mixed with the host within a few crossing times.
The two galaxies ″ south of the QSO are likely to be companion galaxies since they are bright in our [O III] image (Fig. Stellar Populations in the Host Galaxies of Mrk 1014, IRAS 07598+6508, and Mrk 231111Based on observations made with the NASA/ESA Hubble Space Telescope, obtained from the data archive at the Space Telescope Science Institute, which is operated by the Association of Universities for Research in Astronomy, Inc., under NASA contract NAS 5-26555.), but we do not have a spectrum to confirm this. The colors for the SE galaxy indicate that it may have recent star formation, if at the same redshift as IRAS 07598+6508. We find two additional objects with the same redshift as IRAS 07598+6508 that happened to fall in our slits: a faint emission line object ″ south-southwest of the QSO, and a bright galaxy with an absorption and emission line spectrum ″ southwest of the QSO.
5 Mrk 231
Mrk 231 (), often classified as a Seyfert 1 galaxy, is slightly below the luminosity cutoff for QSOs defined by Schmidt & Green (1983). However, the nucleus is heavily reddened, with an estimated of foreground extinction Boksenberg et al., 1977; Lípari, 1994; see also Goodrich & Miller, 1994, so it would be well above this threshold if it were unobscured. The central plateau of the host galaxy is off center with respect to the nucleus, and the presence of tails to the north and south, as well as a low-surface-brightness extension to the east clearly indicate a recent merger (Fig. Stellar Populations in the Host Galaxies of Mrk 1014, IRAS 07598+6508, and Mrk 231111Based on observations made with the NASA/ESA Hubble Space Telescope, obtained from the data archive at the Space Telescope Science Institute, which is operated by the Association of Universities for Research in Astronomy, Inc., under NASA contract NAS 5-26555.). Closer to the nucleus, HST imaging shows a large number of stellar associations indicating recent star formation (Surace et al. 1998; see Fig. Stellar Populations in the Host Galaxies of Mrk 1014, IRAS 07598+6508, and Mrk 231111Based on observations made with the NASA/ESA Hubble Space Telescope, obtained from the data archive at the Space Telescope Science Institute, which is operated by the Association of Universities for Research in Astronomy, Inc., under NASA contract NAS 5-26555.).
As in the case of IRAS 07598+651, the spectrum of the QSO is dominated by strong Fe II emission (Lípari et al., 1994) and shows a peculiar low-ionization BAL system with velocities up to km s-1 (Smith et al., 1995; Foster et al., 1995). Previous spectroscopy of the host galaxy indicates the presence of a young stellar population (Hamilton & Keel, 1987).
We have obtained and modeled spectra of several regions in the host galaxy as labeled in Fig. Stellar Populations in the Host Galaxies of Mrk 1014, IRAS 07598+6508, and Mrk 231111Based on observations made with the NASA/ESA Hubble Space Telescope, obtained from the data archive at the Space Telescope Science Institute, which is operated by the Association of Universities for Research in Astronomy, Inc., under NASA contract NAS 5-26555.. In regions and , we find no evidence for a significant young starburst population. A 10 Gyr-old population with an exponentially decreasing SFR and an e-folding time of 5 Gyr fits this spectrum quite well, as shown in the bottom panel of Fig. 5. Therefore we use this model as an underlying population to fit the rest of the spectra in the host galaxy.
Unfortunately, because of the poor sensitivity of LRIS shortwards of 4000 Å, and the fact that Mrk 231 has a lower redshift () than the other two objects, we were unable to obtain the near-UV portion of the spectrum, which is the most helpful region in determining the ages of post-starburst populations. We are left then with the region on the long side of 3800 Å, where more than one combination of models can give similar fits to the spectra.
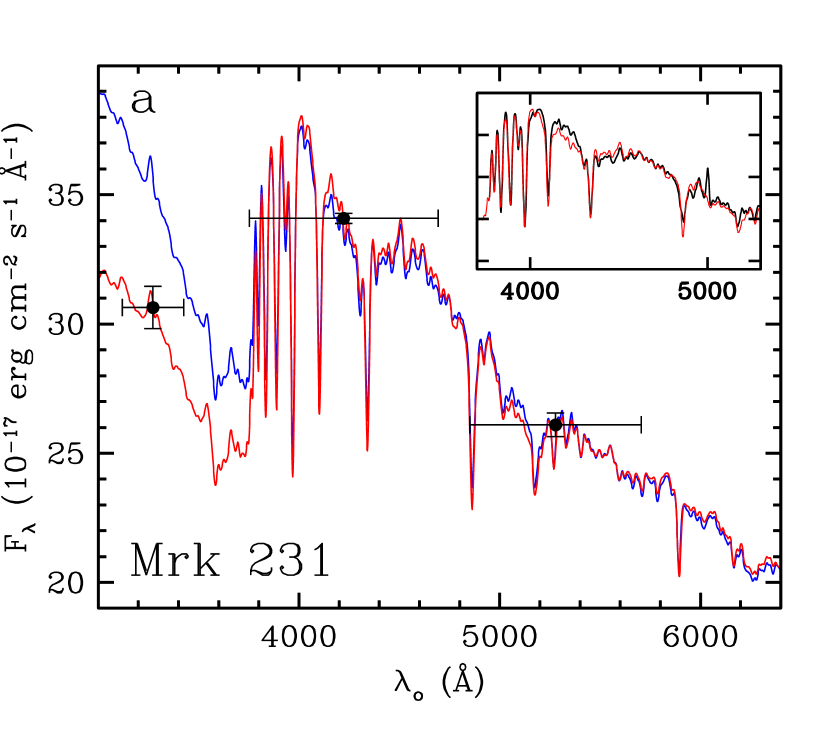
Indeed, we found degenerate fits in some regions of the host galaxy, particularly in those regions with the youngest populations and those where the absorption lines were heavily contaminated by emission so that we could not use Balmer lines to discriminate between models. In such regions we obtained two minima, generally with one corresponding to a model with a small contribution (i.e., small percentage of total mass along the line of sight) from a very young starburst, and the other to a model with a large contribution from a somewhat older starburst. We illustrate the problem in Fig. 6, where we have plotted two models resulting from a 4 Myr and a 42 Myr old populations contributing, respectively, 1% and 12% of the total luminous mass. The models are nearly identical in the spectral region redwards of 3800 Å, and both are good fits to the data (see inset in Fig. 6) with values for these models differing only by 10%. The models, however, diverge quickly at shorter wavelengths.
In order to discriminate between the two “best fits” to the data, we have measured photometry of the different regions ( through as indicated in Fig. Stellar Populations in the Host Galaxies of Mrk 1014, IRAS 07598+6508, and Mrk 231111Based on observations made with the NASA/ESA Hubble Space Telescope, obtained from the data archive at the Space Telescope Science Institute, which is operated by the Association of Universities for Research in Astronomy, Inc., under NASA contract NAS 5-26555.) from our ground-based optical images. We have been careful to measure fluxes only within the areas limited by the slits, at similar resolutions, and subtracting scattered light from the QSO where necessary. The solid circles in Fig. 6 indicate the photometry of region . Clearly, the older model (red line) is a better fit to the data. It is important to note, however, that if there is considerable reddening by dust along the lines of sight to these regions in the host galaxy, the flux values of will be depressed; therefore the photometric points can only help us to determine upper limits to the ages of the stellar populations. For consistency, the age errors quoted in this section are as defined in §2.1, and do not take into account additional constraints placed by the photometry.
Region corresponds to the west side of the arc-shaped structure (the “horseshoe”; Hamilton & Keel, 1987), ″ south of the QSO nucleus. The HST F702W image in Fig. Stellar Populations in the Host Galaxies of Mrk 1014, IRAS 07598+6508, and Mrk 231111Based on observations made with the NASA/ESA Hubble Space Telescope, obtained from the data archive at the Space Telescope Science Institute, which is operated by the Association of Universities for Research in Astronomy, Inc., under NASA contract NAS 5-26555. shows that region is formed by multiple knots, much like those of regions and in IRAS 07598+6508. However this structure, unlike those of IRAS 07598+6508, has a remarkably similar morphology from the near UV to the near IR as shown in the top right panel of Fig. Stellar Populations in the Host Galaxies of Mrk 1014, IRAS 07598+6508, and Mrk 231111Based on observations made with the NASA/ESA Hubble Space Telescope, obtained from the data archive at the Space Telescope Science Institute, which is operated by the Association of Universities for Research in Astronomy, Inc., under NASA contract NAS 5-26555.. As discussed above, we determine an age of 42 (+22, -17) Myr. This age is younger than the 225 Myr estimated from colors of this region by Surace & Sanders (2000).
While several authors have noted the blue color of the “horseshoe” (e.g., Kodaira et al., 1979; Hutchings & Neff, 1987), we find a region that is relatively much brighter at shorter wavelengths 16″ south of the QSO, labeled in Fig. Stellar Populations in the Host Galaxies of Mrk 1014, IRAS 07598+6508, and Mrk 231111Based on observations made with the NASA/ESA Hubble Space Telescope, obtained from the data archive at the Space Telescope Science Institute, which is operated by the Association of Universities for Research in Astronomy, Inc., under NASA contract NAS 5-26555.. This region appears as a bright blue extended blob dominating the color map in Fig. Stellar Populations in the Host Galaxies of Mrk 1014, IRAS 07598+6508, and Mrk 231111Based on observations made with the NASA/ESA Hubble Space Telescope, obtained from the data archive at the Space Telescope Science Institute, which is operated by the Association of Universities for Research in Astronomy, Inc., under NASA contract NAS 5-26555.. The spectrum has a very steep blue continuum, and very strong emission lines at the same redshift as the absorption lines, likely from an H II region (Hamilton & Keel, 1987). The top panel of Fig. 5 shows the spectrum of region with the Balmer emission lines subtracted as described in §2.1. We find an age for this region of 5 Myr. As such a young starburst age is comparable to the expected duration of a typical individual starburst, and we are likely observing a collection of several such starbursts, it is virtually impossible to distinguish between continuous star formation and instantaneous bursts. The age we find is, therefore, simply indicative of ongoing star formation. As in region , we find degeneracy in the modeling of this spectrum, with a second minimum at 100 Myr. The near-UV continuum of the older model, however, falls below the photometric point. Neither the deep optical ground-based images nor the HST image show evidence for stellar associations in region . This is somewhat surprising since, although the starburst population contributes only 1% to the luminous mass along the line of sight, its flux amounts to 42% of the total flux at 5000 Å(rest wavelength), and even more at shorter wavelengths.
Regions and appear as single clumps in the images and have ages of 140 (+80, 70) Myr and 180 (+60, 80) Myr respectively. The starburst populations dominate the spectra in these regions, contributing % of the total flux at rest frame 5000 Å and up to 36% of the total luminous mass along the line of sight. Regions , (Fig. 5), , and all show very similar spectra, as expected from the color maps (Fig. Stellar Populations in the Host Galaxies of Mrk 1014, IRAS 07598+6508, and Mrk 231111Based on observations made with the NASA/ESA Hubble Space Telescope, obtained from the data archive at the Space Telescope Science Institute, which is operated by the Association of Universities for Research in Astronomy, Inc., under NASA contract NAS 5-26555.), with ages between 300 and 360 Myr. The starbursts in these regions typically contribute only 50% to the total flux and % of the total luminous mass, except for region , for which these values are very similar to those of regions and .
We detect very weak continuum from the north tail (region ) at the level. The continuum is slightly blue, and there is a hint of Mg I at the redshift of the host galaxy. This region corresponds to the blue region in the color map, just before the condensation at the end of the north tail. It is possible that this region contains a knot of star formation like those found in the tail of Mrk 1014.
Lípari (1994) reports the presence of an extended Na I D BAL in the west side of the host galaxy. The only place where we see evidence for this feature is in region . The spectrum of , uncorrected for QSO scattered light, shows a wide absorption feature ( km s-1 FWHM compared to km s-1 for the QSO Na I D BAL) as well as narrow absorption and emission (see below) at the redshift of the stellar component. After correcting for QSO contamination, the feature appears narrower, but still at 6400 km s-1 with respect to the emission line. The hypothetical BAL feature is, however, much weaker than that of the QSO, and it could be an artifact of an imperfect subtraction of the QSO light.
While the evidence for extended BAL is not strong in our data, Hamilton & Keel (1987) find an “excess flux” extending to the blue side of [N II] 6548, which they interpret as a broad blueshifted component of H or H + [N II] indicative of an outflow with velocities up to 1500 km s-1. We observe this excess most clearly in regions and extending to even larger velocities ( km s-1). Boroson & Meyers (1992) find some level of excess light in the blue wing of the H line in every low-ionization BAL QSO in their sample and suggest that this excess flux could be from the BAL material itself.
The narrow Na I D emission line shows a peculiar behavior. We observe narrow Na I D emission in regions and on the red side of the absorption line, forming what looks like a P-cygni profile. The only other emission lines evident in region are [N II] 6583, and weak [S II] 6717,6731, but these lines are slightly blueshifted with respect to the absorption lines. In region the Na I D emission line disappears, but the absorption line becomes very weak as well, so it is possible that the emission line is blueshifted into the absorption line; [N II], however, is at a higher redshift than in region . Thus, the very low ionization gas appears to be decoupled from the moderately low ionization gas in these regions.
Hutchings & Neff (1987) find a “green” (i.e., visible only in their image), jet-like feature extending from near the nucleus to the northeast. They suggest it “may be line emission in [O III], perhaps tracing ionizing radiation originating in the nucleus”. Our slit goes through the western side of where this feature would be (see Fig. 2 in Hutchings & Neff, 1987), and region should sample the brightest part of the ridge leading to the bright knot. However, we find only weak [O III] in the spectrum of this region, certainly much weaker than in other regions we sample. Therefore it is unlikely that this “green” feature, if real, is due to ionized gas.
Images of Mrk 231 show a greatly disturbed host galaxy both in large and small scales (Fig. Stellar Populations in the Host Galaxies of Mrk 1014, IRAS 07598+6508, and Mrk 231111Based on observations made with the NASA/ESA Hubble Space Telescope, obtained from the data archive at the Space Telescope Science Institute, which is operated by the Association of Universities for Research in Astronomy, Inc., under NASA contract NAS 5-26555.). At large scales, two symmetric tails extend on the east side of the nucleus for ″ or kpc each, and there is some very extended low surface brightness material east of the north tail. The nucleus is off-center on a bright “plateau” (Hamilton & Keel, 1987) 20 kpc across that shows complex morphology, including linear jet-like structures (region ), and curved tail-like structures (region ). Closer to the nucleus (Fig. Stellar Populations in the Host Galaxies of Mrk 1014, IRAS 07598+6508, and Mrk 231111Based on observations made with the NASA/ESA Hubble Space Telescope, obtained from the data archive at the Space Telescope Science Institute, which is operated by the Association of Universities for Research in Astronomy, Inc., under NASA contract NAS 5-26555.) we find the “horseshoe” 3 kpc to the south with numerous clumps of star formation, and arm-like features spiraling around the nucleus which connect to the outer tidal tails (Surace et al., 1998) This morphology is indicative of a merger between two disk galaxies of similar mass.
While we are unable to obtain stellar spectra within the central kpc () of Mrk 231, Smith et al. (1995) have found from UV spectropolarimetry of the nuclear region that high polarization in the optical falls off quite rapidly shortward of Å; this effect is most easily interpreted as a dilution of the polarized component by O and B stars from an ongoing starburst (Smith et al., 1995). CO and radio observations also show evidence for a centrally concentrated starburst (Downes & Solomon, 1998; Taylor et al., 1999). It is possible that the knots along the arm-like features around the nucleus have ages similar to those of region , if not younger.
We find a relatively wide range of starburst ages around the host galaxy. If, once again, we assume a projected velocity of 300 km s-1, the tidal tails have a dynamical age of 110 Myr. Mrk 231 is unusual in that there seems to be a significant post-starburst population somewhat older (300–360 Myr) than the tails, which may indicate that wide spread star formation was ignited prior to the stages of final merger. Numerical simulations of mergers (Mihos & Hernquist, 1996) predict such a scenario when the merging galaxies lack a significant bulge to stabilize them against an early dissipation. In CS2000 we noted that the apparent correlation between bulge mass and black-hole mass (Magorrian et al., 1998) suggests a possible correlation between QSO luminosity and the delay in star formation activity. Thus, the early starburst activity in Mrk 231 may indicate that the host galaxy did not have a substantial bulge, which would in turn imply a less massive black-hole that may result into a less luminous AGN. Although we do in fact observe a relatively less luminous AGN in Mrk 231, these connections are highly speculative, and they are based on relations (Magorrian et al., 1998) and models (Mihos & Hernquist, 1996) that still have many uncertainties.
6 Discussion
Mrk 1014, IRAS 07598+6508, and Mrk 231 show many similarities. We already knew that these three objects, while being optically or IR selected QSOs, were also part of the ULIG family. In this study we have found additional properties which they share and which may be related to their intermediate position in the FIR diagram.
While Mrk 1014 and Mrk 231 have long been known to have tails, we have shown that IRAS 07598+6508 also has at least one tidal tail. We have found evidence that all three objects have undergone a strong interaction and are now in the final stages of mergers. The morphology of the hosts (highly perturbed galaxies with tidal tails and destroyed disks) as well as the extent of the starbursts indicate that these are all major mergers between galaxies of comparable mass rather than accretion events of low mass dwarf companions (Mihos & Herquist, 1994; Mihos & Hernquist, 1996).
All three objects show spectra typical of E+A galaxies (Dressler & Gunn, 1983), that is, spectra characterized by the simultaneous presence of strong Balmer absorption lines indicative of a young stellar population and features from an older population such as Mg Ib, and the absence of strong emission lines typical of star forming galaxies (we reiterate that the emission lines seen in our spectra generally come from extended gas ionized by the QSO rather than from star forming regions, with a few exceptions). E+A galaxies are frequently linked to galaxy-galaxy mergers and interactions (e.g., Zabludoff, 1996). In the case of objects with E+A spectra undergoing tidal interactions, the young superposed population is clearly related to the interaction. The three objects discussed in this paper, along with 3C 48 (CS2000) and PG 1700+518 (CS97), all have interaction-induced starbursts.
In addition to the similarities noted in the host galaxies of the three objects, there are also some common characteristics in the spectra of the active nuclei themselves. All three objects show strong Fe II emission, with two of these objects (IRAS 07598+6508 and Mrk 231) being “extreme” Fe II emitters (i.e., showing ratios of (Fe II )/(H) 2; Lípari 1994). The latter two objects, like PG 1700+518 (CS97; SCC98), are also low-ionization BAL QSOs and have weak or absent narrow emission lines.
How do the ages of these starbursts relate to the merger/interaction stage? The dynamical ages for tidal features in these objects are uncertain because of projection effects. However, our rough estimates indicate that in two cases, Mrk 1014 and IRAS 07598+6508, the peak of the starburst occurred after the tidal tails were launched. This requires some mechanism to stabilize the gas contents of the galaxies against bursting in star formation until the later stages of the merger; numerical simulations indicate that a significant bulge in the host can provide this mechanism (Mihos & Hernquist, 1996). Mrk 231, on the other hand, shows starburst ages which indicate that much of the star formation activity may have started before the last stages of the merger; hence, one or both of the merging galaxies may have lacked a significant bulge.
Whenever we have found a significant range of starburst ages in the host galaxies of QSOs, we have also found evidence that the youngest major starburst regions are preferentially concentrated towards the center of the galaxy. In 3C 48 (CS2000) we found the clearest example of this, with starburst ages becoming progressively younger and more dominating as we approached the galaxy/QSO nucleus. Mrk 231 shows older starbursts in the “plateau” extending kpc around the nucleus, with some of the youngest populations only 3 kpc from the nucleus, and possibly even younger populations in the central kpc of the galaxy. Mrk 1014 shows stronger relatively recent star formation activity along the tail than any of the other objects. However, the starburst region we observe within 2 kpc of the nucleus is far more massive, luminous, and larger (Surace et al., 1998) than the starburst regions along the tail, and has the youngest age found in the host.
The interaction histories of the five objects discussed so far clearly favor a strong connection between interactions and vigorous bursts of star formation. Since the gas flows towards the inner regions can not only trigger star formation but also serve as fuel to the QSO, one might expect the age of the QSO activity to be closely related to the age of the initial starbursts in the central regions of the galaxy. However, observations of central starbursts are in every case hampered by the presence of the QSO; even if this region could be observed, the spectrum would likely be dominated by continuing recent starburst activity and not by a starburst that was coincident with the onset of the QSO activity. Furthermore, both starburst and QSO activity may be episodic. All of this is to say that there is an unavoidable intrinsic uncertainty in using starburst ages to place QSOs in an evolutionary sequence. We defer the detailed discussion of a possible age sequence to a subsequent paper where we will present the results of the four remaining objects in our sample (i.e., IRAS 002752859, IRAS 045052958, I Zw 1, and PG 1543+489).
We emphasize, though, that many of our general conclusions from the objects discussed here, as well as from our observations of 3C 48 (CS2000), have an interest that is quite independent of any attempt to use some sort of starburst age as a proxy for a QSO age. (1) The confirmation that these are all starburst or post-starburst objects and that they all show obvious tidal tails validates their close connection with other ULIGs, virtually all of which are mergers or strongly interacting pairs. While there has long been strong circumstantial evidence that a large fraction of the QSO population has resulted from triggering of the QSO activity by interactions and mergers, we now have much more direct evidence for this mechanism for at least one subclass of QSOs. (2) Both the spatial distribution and the time history of star formation in a QSO host galaxy give clues to nature of the galaxies that have participated in the merger. While more sophisticated models of star formation during interactions will be necessary to exploit these data fully, we already have some hints in terms of the enhanced star formation along the leading edge of the tails in 3C 48 and Mrk 1014, and in the relative ages of the tail structures and the star-forming regions contained within them. (3) The youth of the stellar populations in these objects reinforces previous suggestions connecting strong Fe II emission and low-ionization BAL features with the relatively recent triggering of QSO activity. We will discuss these connections in detail in the paper presenting the observations of the remaining four objects in our sample.
References
- Andreani et al. (1999) Andreani, P., Franceschini, A., & Granato, G. 1999, MNRAS, 306, 161
- Boksenberg et al. (1977) Boksenberg, A., Carswell, R. F., Allen, D. A., Fosbury, R. A. E., Penston, M. V., & Sargent, W. L. W. 1977, MNRAS, 178, 451
- Boroson & Meyers (1992) Boroson, T. A., & Meyers, K. A. 1992, ApJ, 397, 442
- Boyce (1996) Boyce, P. J. et al. 1996, ApJ, 473, 760
- Bruzual & Charlot (1996) Bruzual A., G. & Charlot, S. 1996, unpublished [ftp://gemini.tuc.noao.edu/pub/charlot/bc96]
- Bryant & Scoville (1996) Bryant, P. & Scoville, N. Z. 1996, ApJ, 457, 678
- Canalizo et al. (2000) Canalizo, G., Stockton, A., Brotherton, M. S., & van Breugel, W. 2000, AJ, 119, 59
- Canalizo & Stockton (2000) Canalizo, G., & Stockton, A. 2000, ApJ, 528, 201 [CS2000]
- Canalizo & Stockton (1997) Canalizo, G., & Stockton, A. 1997, ApJ, 480, L5 [CS97]
- Clements (1996) Clements, D. L. et al. 1996, MNRAS, 279, 459
- de Grijp et al. (1987) de Grijp, M. H. K., Miley, G. K., & Lub, J. 1987, A&AS, 1987, 70, 95
- Downes & Solomon (1998) Downes, D., & Solomon, P. M. 1998, ApJ, 507, 615
- Dressler & Gunn (1983) Dressler, A. & Gunn, J. E. 1983, ApJ, 270, 7
- Foster et al. (1995) Foster, K., Rich, R. M., & McCarthy, J. K. 1995, ApJ, 450, 74
- Goodrich & Miller (1994) Goodrich, R. W. & Miller, J. S. 1994, ApJ, 434, 82
- Gunn (1979) Gunn, J. E. 1979 in Active Galactic Nuclei, ed. C. Hazard and S. Mitton (New York: Cambridge University Press), p. 213
- Hamilton & Keel (1987) Hamilton, D. & Keel, W. C. 1987, ApJ, 321, 211
- Heckman et al. (1984) Heckman, T. M., Bothun, G. D., Balick, B., & Smith, E. P. 1984, AJ, 89, 958
- Hibbard & Yun (1999) Hibbard, J. E. & Yun, M. S. 1999, AJ, 118, 162
- Hines et al. (1999) Hines, D. C., Low, F. J., Thompson, R. J., Weymann, R. J., & Storrie-Lombardi, L. 1999, ApJ, 512, 140
- Hines & Wills (1995) Hines, D. C. & Wills, B. J. 1995, ApJ, 448, 69
- Hughes et al. (2000) Hughes, D. H., Kukula, M. J., Dunlop, J. S., Boroson, T. 2000, MNRAS, in press [astro-ph/0002021]
- Hutchings & Crampton (1990) Hutchings, J. B., & Crampton, D. 1990, AJ, 99, 37
- Hutchings & Neff (1987) Hutchings, J. B., & Neff, S. G. 1987, AJ, 92, 14
- Hutchings & Neff (1992) Hutchings, J. B., & Neff, S. G. 1992, AJ, 104, 1
- Kodaira et al. (1979) Kodaira, K., Iye, M., & Nishimura, S. 1979, PASJ, 31, 451
- Lawrence (1988) Lawrence, A. et al. 1988, MNRAS, 235, 261
- Lípari (1994) Lípari, S. 1994 ApJ, 436, 102
- Lípari et al. (1994) Lípari, S., Colina L., & Macchetto F., 1994 ApJ, 427, 174
- Low et al. (1988) Low, F. J., Huchra, J. P., Kleinmann, S. G., Cutri, R. M. 1988, ApJ, 327, L41
- MacKenty & Stockton (1984) MacKenty, J. W., & Stockton, A. N. 1984, ApJ, 283, 64
- McLeod & Rieke (1994) McLeod, K. K., & Rieke, G. H. 1994, ApJ, 431, 137
- Magorrian et al. (1998) Magorrian, J., et al. 1998, AJ, 115, 2285
- Massey et al. (1988) Massey P., Strobel K., Barnes, J. V., & Anderson, E. 1988, ApJ, 328, 315
- Mihos & Hernquist (1996) Mihos, J. C., & Hernquist L. 1996, ApJ, 464, 641
- Mihos & Herquist (1994) Mihos, J. C., & Hernquist L. 1994, ApJ, 425, L13
- Neugebauer et al. (1985) Neugebauer, G., Soifer, B. T., & Miley, G. K. 1985, ApJ, 295, L27
- Neugebauer et al. (1986) Neugebauer, G., Miley, G. K., Soifer, B. T., & Clegg, P. E. 1986, ApJ, 308, 815
- Nolan et al. (2000) Nolan, L. A., Dunlop, J. S., Kukula, M. J., Hughes, D. H., Boroson, T., Jimenez, R. 2000, MNRAS, in press [astro-ph/0004325]
- Oke et al. (1995) Oke, J. B., et al. 1995, PASP, 107, 375
- Sanders et al. (1988a) Sanders, D. B., Soifer, B. T., Elias, J. H., Madore, B. F., Matthews, K., Neugebauer, G., & Scoville, N. Z. 1988, ApJ, 325, 74
- Sanders et al. (1988b) Sanders, D. B., Scoville, N. Z., & Soifer, B. T. 1988, ApJ, 335, 1
- Scalo (1986) Scalo, J. M. 1986, Fund. Cosmic Phys., 11, 1
- Scoville et al. (2000) Scoville, N. Z., Evans, A. S., Thompson, R., Rieke, M., Hines, D. C., Low, F. J., Dinshaw, N., Surace, J. A., Armus, L. 2000, AJ, 119, 991
- Schlegel et al. (1998) Schlegel, D. J., Finkbeiner D. P., & Davis, M. 1998, ApJ, 500, 525
- Schmidt & Green (1983) Schmidt, R., & Green, R. F. 1983, ApJ, 269, 352
- Smith et al. (1995) Smith, P. S., Schmidt, G. D., Allen, R. G., & Angel, J. R. P. 1995, ApJ, 444, 146
- Solomon et al. (1997) Solomon P. M., Downes, D., Radford, S. J. E., & Barrett, J. W. 1997, ApJ, 478, 144
- Stockton (1999) Stockton, A. 1999, in Galaxy Interactions at Low and High Redshift, IAU Symp. 186, eds. D. Sanders & J. Barnes (San Francisco: Astron. Soc. Pac.), p. 311
- Stockton (1982) Stockton, A. 1982, ApJ, 257, 33
- Stockton et al. (1998) Stockton, A., Canalizo, G., & Close, L. 1998, ApJ, 500, L121 [SCC98]
- Stockton & MacKenty (1987) Stockton, A., & MacKenty 1987, ApJ, 316, 584
- Surace et al. (1998) Surace, J. A., Sanders, D. B., Vacca, W. D., Veilleux, S., & Mazzarella, J. M. 1998, ApJ, 492, 116
- Surace & Sanders (2000) Surace, J. A. & Sanders, D. B. 2000, AJ, in press [astro-ph/0005122]
- Taniguchi et al. (1988) Taniguchi, T., Kawara, K., Nishida, M., Tamura, S., Nishida, M. T. 1988, ApJ, 95, 1378
- Taylor et al. (1999) Taylor, G. B., Silver, C. S., Ulvestad, J. S., & Carilli, C. L. 1999, ApJ, 519, 185
- Toomre & Toomre (1972) Toomre, A., & Toomre, J. 1972, ApJ, 178, 623
- Veilleux & Osterbrock (1987) Veilleux, S. & Osterbrock, D. E. 1987, ApJS, 63, 295
- Zabludoff (1996) Zabludoff, A. I. et al. 1996, ApJ, 466, 104

Morphology and colors in the host galaxy of Mrk 1014. The main panel on the left shows a -band image, heavily smoothed to show the low-surface-brightness features; the upper-left inset shows the well known local interacting pair M51/NGC 5195, scaled to the distance of Mrk 1014, to indicate the size of the Mrk 1014 host galaxy. A lower-contrast version of the same Mrk 1014 image with less smoothing and with the PSF subtracted is shown at the middle top. and -band images are shown at the top right and bottom middle, respectively, and the color image is shown at the bottom right. The latter is coded so that regions with most negative show as blue, while relatively redder regions show as yellow and red. The region near the nucleus is dominated by the QSO and does not indicate the color of the host galaxy.
HST WFC2 image of Mrk 1014 obtained with the F675W filter. For this and the following HST images, the image has been rotated so that north is at the top and east to the left.
Slit positions and region identifications for Mrk 1014.


Morphology in the host galaxy of IRAS 07598+6508. The main panel on the left and the top two panels on the right show the image at a range of contrasts, while the lower panels on the right show the and [O III] images. All images have had the PSF removed, using the bright star to the north-west as the PSF template.
HST PC1 image of IRAS 07598+6508 obtained with the F702W filter.
Slit positions and region identifications for IRAS 07598+6508.

Morphology and colors in the host galaxy of Mrk 231. The main panel on the left and the top two panels on the right show the -band image. The insert in the top-right panel shows an -band image of the inner regions (note that the images in this panel are magnified by a factor of two compared with those in the other panels); the similarity in the structure seen in the arc-like region south of the nucleus indicates that the SEDs of the emission regions within this region are all similar and that reddening is not a severe problem. The two lower-right panels show B V and U B images, respectively; more negative values are indicated as blue. Note the relative colors of the arc and the patch about 16″ south of the nucleus (essentially regions and in Fig. 4), indicating the much younger population in the latter.
HST PC1 image of the inner region of Mrk 231 obtained with the F439W filter.
Slit positions and region identifications for Mrk 231.

| PA | Offset | Dispersion | Total Int. | ||
|---|---|---|---|---|---|
| Object | (deg) | (arcsec) | (Å pixel-1) | Time (s) | UT Date |
| Mrk 1014 | 103.0 | 4.0 N | 2.44 | 3600 | 97 Sep 13 |
| Mrk 1014 | 87.1 | 6.9 N | 2.44 | 3600 | 98 Sep 01 |
| Mrk 1014 | 148.6 | 2.2 W | 2.44 | 2400 | 98 Sep 01 |
| IRAS 07598+6508 | 243.6 | 6.9 S | 1.28 | 3600 | 96 Oct 13 |
| IRAS 07598+6508 | 190.0 | 0.0 | 1.28 | 3600 | 96 Oct 14 |
| Mrk 231 | 6.0 | 0.0 | 2.44 | 1800 | 97 Jun 12 |
| Mrk 231 | 83.0 | 16.0 S | 2.44 | 3600 | 98 Mar 21 |
| Mrk 231 | 30.0 | 7.0 W | 2.44 | 2400 | 98 Mar 21 |
| Object | Instrument | FilteraaThe filter was centered at 3410 Å with a bandpass of 320 Å. The filter used for Mrk 1014 had a smaller bandpass (593 Å) than the standard filter to avoid strong emission lines. The filter used for Mrk 1014 was centered at 6815 Å with a bandpass of 1226 Å, and that used for IRAS 07598+6508 was centered at 6500 Å with a bandpass of 880 Å; both avoid strong emission lines. The [O III] filter was centered at 5777 Å with a bandpass of 100 Å. | Exposure (s) | Scale (″pix-1) | UT Date |
|---|---|---|---|---|---|
| Mrk 1014 | Orbit CCD | 81200 | 0.138 | 97 Nov 01 | |
| Mrk 1014 | Orbit CCD | 5300 | 0.138 | 97 Oct 31 | |
| Mrk 1014 | Tek1024 CCD | 5300 | 0.222 | 91 Nov 13 | |
| Mrk 1014 | QUIRC | 29300 | 0.061 | 99 Oct 29 | |
| Mrk 1014 | NICMOS-3 | 3970 | 0.374 | 90 Oct 28 | |
| IRAS 07598+6508 | Loral CCD | 81200 | 0.138 | 97 Mar 09 | |
| IRAS 07598+6508 | Tek1024 CCD | 15300 | 0.222 | 92 Mar 01 | |
| IRAS 07598+6508 | Tek1024 CCD | [O III] | 71560 | 0.222 | 92 Feb 27 |
| IRAS 07598+6508 | QUIRC | 22120 | 0.061 | 99 Oct 30 | |
| Mrk 231 | Loral CCD | 51200 | 0.138 | 97 Mar 08 | |
| Mrk 231 | Loral CCD | 18200 | 0.138 | 97 Mar 09 | |
| Mrk 231 | Loral CCD | 6300 | 0.138 | 97 Mar 08 | |
| Mrk 231 | QUIRC | 6920 | 0.061 | 99 Apr 04 |