ISO deep far-infrared survey in the “Lockman Hole”
Abstract
We investigate the characteristics of FIR brightness fluctuations at 90 m and 170 m in the Lockman Hole, which were surveyed with ISOPHOT aboard the Infrared Space Observatory(ISO). We first calculated the angular correlation function of each field and then its Fourier transform(the angular Power Spectral Density: PSD) over the spatial frequency range of arcmin-1. The PSDs are found to be rather flat at low spatial frequencies(), slowly decreasing toward higher frequencies. These spectra are unlike the power-law ones seen in the IR cirrus fluctuations, and are well explained by randomly distributed point sources. Furthermore, point-to-point comparison between 90 m and 170 m brightness shows a linear correlation between them, and the slope of the linear fit is much shallower than that expected from the IR cirrus color, and is consistent with the color of galaxies at low or moderate redshift(). We conclude that the brightness fluctuations in the Lockman Hole are not caused by the IR cirrus, but are most likely due to faint star-forming galaxies. We also give the constraints on the galaxy number counts down to 35 mJy at 90 m and 60 mJy at 170 m, which indicate the existence of a strong evolution down to these fluxes in the counts. The galaxies responsible for the fluctuations also significantly contribute to the cosmic infrared background radiation.
Key Words.:
Galaxies: evolution – Galaxies: starburst – Cosmology: observations – Infrared: ISM: continuum – Infrared: galaxies1 Introduction
In order to understand the history of galaxy formation and evolution, surveys at far-infrared(FIR) and submillimeter wavelengths are essentially important, since a large portion of star formation activity in the universe may be hidden by dust, prohibiting optical and near-infrared studies due to the enormous extinction. The recent detection of the far-infrared Cosmic Infrared Background(CIB) radiation by COBE, which appears to have comparable brightness to the total intensity in deep optical counts from the Hubble deep field (Fixen et al. Fix98 (1998); Hauser et al. Hau98 (1998); Lagache et al. Lag00b (2000)), indicates that the infrared-bright galaxies are responsible for roughly half of the energy released by nucleosynthesis. Various discrete source surveys are also being pursued from mid-infrared to submillimeter wavelengths. For example, source counts at 15 m (Aussel et al. Aus98 (1998); Altieri et al. Alt98 (1998); Elbaz et al. Elb99 (1999)), at 170 m (Kawara et al. Kaw98 (1998)(paper I) ; Puget et al. Pug99 (1999)), and at 850 m (Blain et al. Bla99 (1999)) have been reported. Using both CIB and these new number count data, modeling of the cosmic star formation history has been attempted by many authors(Guiderdoni et al. Gui98 (1998); Dwek et al. Dwe98 (1998); Rowan-Robinson RR99 (1999); Tan et al. Tan99 (1999); Ishii et al. IT99 (1999)). All of them require a strong evolution in the star formation rate as we look back to high redshift(more than 10 times larger at ).
Although the FIR deep survey is now considered a key observing method for the exploration of the “optically dark side” of the star formation history of galaxies(Guiderdoni et al. Gui97 (1997)), the detectivity of 1m-class space FIR telescopes is likely to be limited by the noise due to the fluctuation of the IR cirrus(Low et al. Low84 (1984)), emission from the interstellar dust, even at high Galactic latitude(Helou & Beichman HeBe90 (1990)). Hence a detailed study of the IR cirrus fluctuations is highly important, especially for the planning of the deep surveys intended with forthcoming IR space telescopes such as IRIS(Murakami Mur98 (1998)) and SIRTF(Fanson et al. Fan98 (1998)).
The spatial structure of the IR cirrus at 100 m as measured by IRAS was extensively studied by Gautier et al. (Gau92 (1992)) and Abergel et al.(Abe96 (1996)). From a Fourier analysis of the brightness distribution, Gautier et al. found that the Power Spectral Density(PSD) of the brightness fluctuation at 100 m follows a power-law function of the spatial frequency with an index of about 3 below the spatial frequency corresponding to the IRAS beam size(about ). They also found that the PSD is proportional to , where is the mean brightness of the IR cirrus. The ISOPHOT(Lemke et al. Lem96 (1996)) onboard the ISO(Kessler et al. Kes96 (1996)) is capable of observing the IR cirrus at wavelengths longer than 100 m, with a better spatial resolution than that of IRAS. Herbstmeier et al. (Her98 (1998)) analyzed the spatial characteristics of four fields measured by ISOPHOT, and obtained similar power-law spectra for relatively bright cirrus regions. Recently Lagache & Puget (Lag00a (2000)) have made a power spectrum analysis of the 170 m image of the Marano 1 field, and found a significant excess at , which they attributed to the fluctuations due to unresolved extra-galactic sources.
In this paper we investigate the characteristics of FIR brightness fluctuations in the Lockman Hole, a region with a uniquely low HI column density(Lockman et al. Loc86 (1986)), and thus minimal IR cirrus contribution to the fluctuations. Therefore the fluctuations in the Lockman Hole are likely to be dominated by faint, distant galaxies(Helou & Beichman HeBe90 (1990); Herbstmeier et al. Her98 (1998)) and the fluctuation analysis of FIR images will provide unique information on the number counts of infrared galaxies even below the source-confusion limit, thus constraining the parameters characterizing the number count models.
This paper is organized as follows: section 2 briefly describes the observations and data processing. Section 3 explains the power spectrum analysis and examines the contribution by the IR cirrus fluctuations and also describes a simulation of the images and the PSDs. Section 4 describes the constraints on the galaxy number counts. The nature of the sources responsible for the fluctuations is discussed in section 5, and section 6 gives the conclusions.
2 Observation and data processing
The FIR survey of the Lockman Hole, which was executed as a part of Japan/UH cosmology program using the ISAS guaranteed time, is described in Taniguchi et al. (Tan94 (1994)) and paper I. Two fields named LHEX and LHNW were mapped with two filters: C_90(centered at 90 m) and C_160(170 m). Each of the two fields is made up of 4 sub-fields.
Each sub-field map was produced from the edited raw data by the PHT Interactive Analysis(PIA; Gabriel et al. Gab97 (1997)) version 7.1 or 7.2, and is hereafter referred to as an AAP(Astronomical Analysis Processing of PIA) map. Each AAP map is either pixels() for a 90 m sub-field, or pixels() for a 170 m sub-field. To correct the drift in the responsivity of the detectors, we applied the median filter smoothing (see Paper I for details) to the AAP data.
Together with the final AAP maps we also produced the uncertainty maps, and found that the typical 3 noise is as low as 0.012MJy/sr( 0.60mJy/pixel for a pixel), indicating that the instrumental noise is negligible in the following results.
As was done in Paper I, the observed fluxes as well as the brightness of the images are scaled based on the fluxes of the brightest source F10507+5723(UGC 06009) measured with IRAS. We found that the flux calibration based on the FCS1 measurements underestimates the 90 m flux of the IRAS source by a factor of 2.6, although it gives the mean brightness of the images consistent with the COBE/DIRBE brightness within 25 per cent. The 170 m flux of the IRAS source is assumed to be 1133 mJy as described in Paper I. The flux calibration based on the FCS1 measurements again underestimates the 170 m flux by a factor of 1.5. For the 170 m flux, we found that the discrepancy is mostly due to an underestimate of the effective solid angle of the ISOPHOT detector. Puget et al. (Pug99 (1999)) and Lagache & Puget (Lag00a (2000)) used an effective solid angle at 170 m derived from Saturn footprint measurements, which is significantly larger than that used in the PIA. Here we assume theoretical PSFs of a telescope with a 60 cm primary mirror and a 20 cm secondary mirror which agree well with those measured during the ISOPHOT calibration observations(Müller Mul99 (2000)). With this assumption, the factors of 2.6(90 m) and 1.5(170 m) discrepancies reduce to factors of 2.0(90 m) and 1.2(170 m). The origin of the residual discrepancies is still unknown. However, this is not problematic for the main results and conclusions of this paper as described in section 4 and 5 as long as the fluxes of F10507+5723 determined by the IRAS faint source survey are correct.
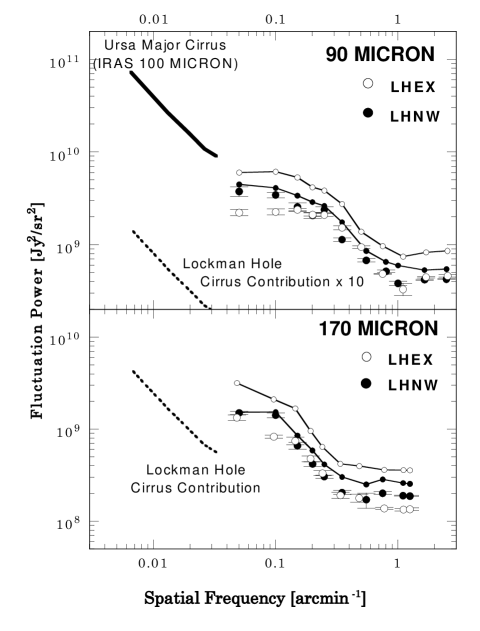
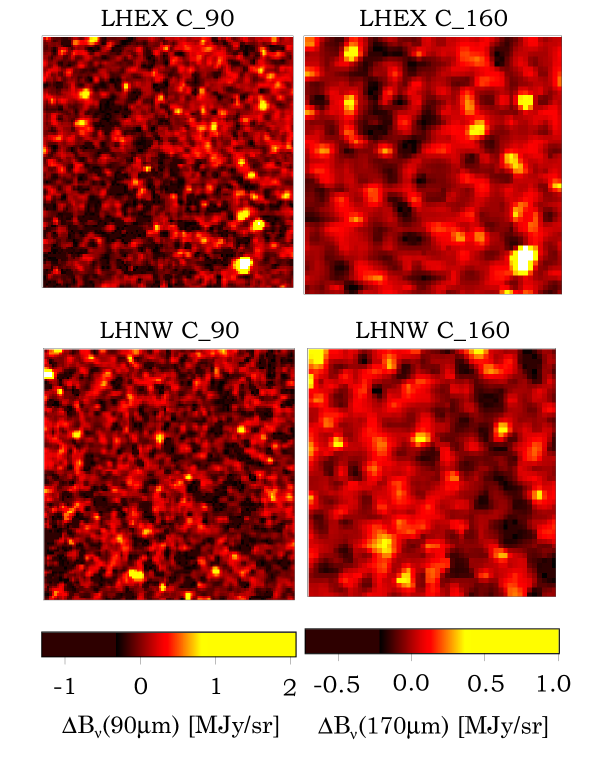
Fig. 1 shows the images of LHEX and LHNW used for the fluctuation analysis, each of which is the largest square area extracted from the mosaiced map(see Fig. 3 of Paper I) made up from four sub-field AAP maps. Each image is rebinned into pixels2 (C_90), pixels2(C_160 LHEX), or pixels2(C_160 LHNW). The plate scale is for 90 m maps, and for 170 m maps.
3 The power spectra and the simulation
For each image shown in Fig. 1 the 2-dimensional angular correlation function was calculated from the brightness distribution :
| (1) |
where bracket represents the average over the whole area in each image shown in Fig. 1, and . Then, the coordinates were expressed in polar coordinates as , and the Fourier transforms in various radial directions were calculated (i.e. is fixed for each transform). One-dimensional power spectral density(PSD) is calculated from
| (2) |
where is spatial frequency(), (), is the pixel size of the map, is the largest angular size for which the angular correlation function is evaluated, and . Note that the units of the PSDs are the same as that of the angular correlation function: . Finally, the PSDs were averaged with respect to and are shown in Fig. 2. It is noteworthy that the fluctuations at high frequencies( arcmin-1 for 90 m, and arcmin-1 for 170 m) are smoothed by the instrumental beam and therefore the PSDs decrease appreciably. The small error bars of PSDs represent the standard deviation among a set of the PSDs with different , showing that the PSDs are almost independent of .
In order to check the contributions from bright sources, the PSDs are derived by masking circular regions with a 4FWHM diameter around bright sources with fluxes above : mJy at 170 m111 As for 170 m images, smaller values of significantly reduce the amount of residual images., mJy at 90 m. In the following the resultant PSDs are called “residual PSDs”, and are also shown in Fig. 2. Interestingly, the residual PSD for each image is more than half of the PSD of corresponding original image with almost the same spectral shape, indicating that there remains significant contribution from randomly distributed point sources with fluxes below .
In Fig. 2 typical IR cirrus PSDs are also compared in order to check the contribution of the IR cirrus to the PSDs of the Lockman Hole222The formula for the IR cirrus PSD by Gautier et al. (Gau92 (1992)) cannot be directly compared with the present work, because the power spectrum analysis presented here is one-dimensional one while the formula of Gautier et al. is based on the two-dimensional analysis.. We examined several IRAS 100 m maps of high-latitude clouds in Ursa Major(, ), which are reproduced from the IRAS Sky Survey Atlas(ISSA) by reducing the brightness by a factor of 0.72, following the COBE/DIRBE calibration(Wheelock et al. Whe94 (1994)). The average brightness of the cirrus is 2–3 MJy/sr, and each map is wide with . The derived PSDs show a power-law distribution with an index of -1.5. Gautier et al.(Gau92 (1992)) noted that one-dimensional analysis of the IR cirrus yielded spectral indices near -2. These cirrus fluctuation spectra are much different from those obtained for the Lockman Hole images at 90 m, which show rather flat spectra at lower spatial frequencies. The 170 m spectra present a slope similar to the IR cirrus one, but this can be explained by the shape of the footprint power spectrum of ISOPHOT detectors. Moreover, the fluctuation powers are much larger than those estimated for the IR cirrus, which are also shown in Fig. 2. We assume that the cirrus PSD is proportional to (Gautier et al. Gau92 (1992)), and taking the mean brightness of the IR cirrus in the Lockman Hole as 0.33 MJy/sr at 90 m and 1.0 MJy/sr at 170 m. These values are estimated from the atomic hydrogen column density of in LHEX(Jahoda et al. Jah90 (1990)) and the COBE/DIRBE data analysis in the Lockman Hole by Lagache et al. (Lag99a (1999), in their Table 4). We can conclude that the IR cirrus contribution to the PSDs in the Lockman Hole is negligible over all spatial frequencies .
In the following we interpret the residual PSDs in terms of unresolved point sources, probably galaxies. We neglect the spatial correlation between galaxies, thus assuming that galaxies are randomly distributed in the images. Then the residual PSD will be the product of the footprint power spectrum of the ISOPHOT detector and the fluctuation power due to the point sources, which is a white power spectrum given by:
| (3) |
where is differential source counts. From the residual PSDs observed, we derive at 90 m () and at 170 m (), where the errors do not include systematic ones due to uncertainties in the flux calibration. Lagache & Puget (Lag00a (2000)) reported the detection of at 170 m for the Marano 1 field, after sources brighter than 100 mJy are removed. Contribution from detected sources with fluxes between 100 mJy and 250 mJy is estimated to be about 7000 . Thus the fluctuation power in the Lockman Hole due to the sources fainter than 100 mJy is , which is comparable to that observed in the Marano 1 field.
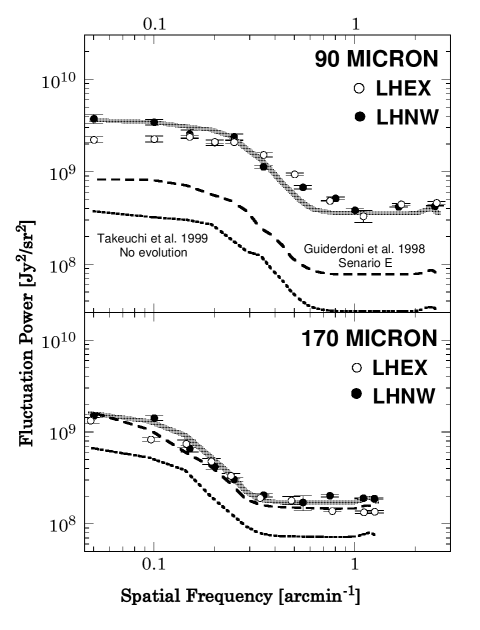
A simulation was performed by making 90 m and 170 m images made up only by galaxies with fluxes between and and calculating their PSDs. Here galaxies are treated as point sources with a PSF specific to the respective wavelength band of ISOPHOT. We used the image of the bright IRAS source (F10507+5723) seen in LHEX images as the PSF. The number of sources and their flux densities are controlled by the source counts. We examined the non-evolution count model by Takeuchi et al. (Tak99 (1999)) and the scenario E by Guiderdoni et al.(Gui98 (1998)). We assume because the fluctuations due to galaxies fainter than 10 mJy are negligible in case of these models. The resulted PSDs are compared with the residual PSDs in Fig. 3. These simulated PSDs are not sufficient to explain the observed PSDs although the spectral shapes are quite similar.
4 Constraints on the Number Counts
In this section we will investigate the source counts below , by fitting the simulated PSDs to the residual PSDs. In Paper I we presented the number density of sources brighter than 150 mJy at both filter bands. After Paper I was published, the data processing and the source extraction technique have been improved, and now we obtained source number counts down to mJy at 90 m and mJy at 170 m, although the counts at such low fluxes may be overestimated due to the source confusion. We found that the cumulative counts above 150 mJy show quite a steep increase as the source flux decreases: where . These results will be described in detail in Kawara et al. (Kaw00 (2000), paper III). If remains equal to -3 down to , then the fluctuation power() calculated by equation 3 exceeds the observed ones by an order of magnitude. Hence at a certain flux below , we expect that the slope of the counts must flatten to so that the predicted fluctuations do not exceed the observed ones. We thus considered simple double power-law count models and evaluated the simulated PSDs: in the flux range
| (4) |
and in flux range
| (5) |
where , and , are assumed to obey inequalities . and its uncertainty are listed in Table 1. The uncertainty in includes Poisson uncertainties based on the total number of sources with flux above in all images, and systematic ones originating from the incompleteness due to the source confusion, which will be discussed in paper III. If , the simulated PSD is not sensitive to and is dominated by sources with fluxes around , as discussed in Lagache and Puget (Lag00b (2000)). Various sets of parameters can be chosen so that the simulated PSDs fit to the residual PSDs. Examples of the simulated PSDs which fit well to the residual PSDs are also shown in Fig. 3, for which , for both 90 m and 170 m counts, and mJy for 90 m counts and mJy for 170 m one. We found that the simulated PSDs can fit the residual PSDs over all spatial frequencies within per cent for the 90 m PSDs and per cent for the 170 m ones. These deviations of the residual PSDs from the simulated PSDs are also included as uncertainties in the residual PSDs.
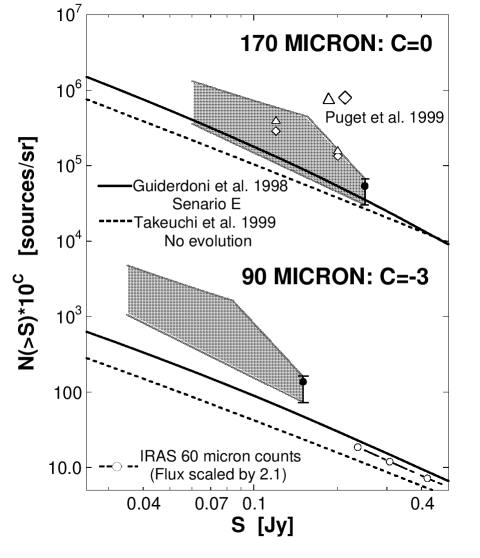
We now derive the allowed regions in plots of the cumulative counts at fluxes below . The bottom border of the allowed regions is derived by examining the single power-law counts()333Lower value of does not appreciably change the results: =1.7 even if . and we obtain =1.8 for 90 m counts and =1.7 for 170 m ones. In case of double power-law counts we may choose a larger value of with a set of parameter pairs(, ), and among them for is the largest. Thus we determine the upper borders of the allowed regions by connecting (, ) points of numerous models with and . The results are shown by the shaded area in Fig. 4. As for the 170 m counts, the bottom border of the allowed region is close to the Scenario E model by Guiderdoni et al. (Gui98 (1998)), and is consistent with the counts at 120 mJy and at 200 mJy obtained from the FIRBACK Marano 1 survey (Puget et al. Pug99 (1999)). On the other hand, the allowed region for 90 m counts are significantly above those of any currently existing models.
The bottom border derived here cannot be applied below a certain flux , which is the flux at the intersection between an upper-border count model with the steepest slope (, ), and the bottom border: (90 m) or 50 mJy(175 m). By definition, the upper border model do not require sources below (). On the other hand, in case of the bottom border model, contribution to the fluctuations from sources below is still appreciable, about half of the total. Considering the uncertainties in and the residual PSDs as discussed above, we finally give for 90 m counts and for 170 m counts.
5 Discussion
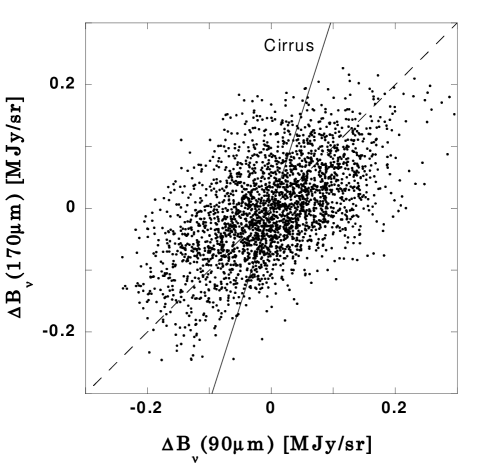
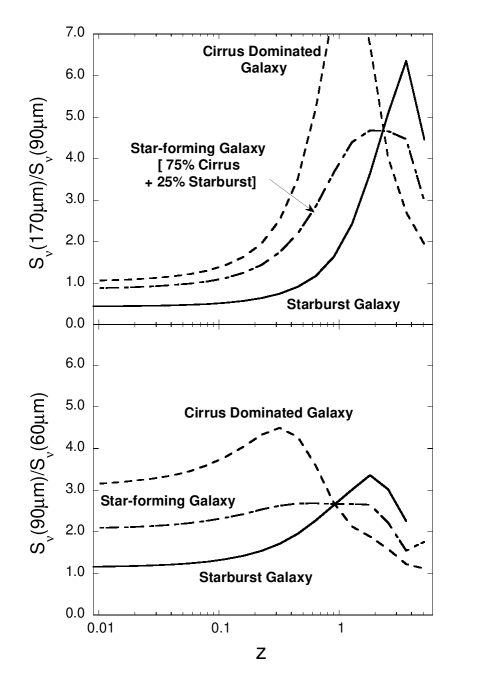
We attribute the origin of the residual PSDs to the random distributions of faint sources which can no longer be identified as individual sources due to the source confusion. Another piece of evidence which supports this interpretation is the 170 m/90 m brightness ratio of the FIR background emission. In Fig. 5 we show the point-to-point comparison between the 90 m and the 170 m sky brightness. Here we examine the residual images after masking pixels around the sources with . In order to match the spatial resolution between 90 m( FWHM) and 170 m( FWHM) images, one wavelength band image is convoluted with the other wavelength band beam profile. Although the scatter is large, the plot shows linear correlation with a slope of unity. This background color is quite different from that expected for the IR cirrus(about 3.1), and can be interpreted as a typical FIR color of galaxies contributing to the fluctuation. The fluctuation color due to faint galaxies depends on their redshift, and their SEDs. The relations between the FIR flux ratio and the redshift for SEDs of the cirrus dominated galaxy, the pure starburst galaxy(Efstathiou et al. Efs00 (2000); Efstathiou & Siebenmorgen ES00 (2000)), and the mixture of these two SEDs which represents a star-forming galaxy’s SED like IRAS F10507+5723, are shown in Fig. 6. The flux ratio of is attained at for a pure starburst galaxy, while a cirrus dominated galaxy or a star-forming galaxy with a small contribution from starburst component must be local().
From Fig. 6 we can also justify the flux calibration based on the IRAS fluxes of F10507+5723. If we adopt the ISO 90 m flux determined by PIA and the theoretical PSFs, then which is the color of a pure-starburst galaxy, while the ISO flux ratio is much larger than that expected for any nearby() galaxies.
The local cirrus dominated galaxies are not likely to be the dominant sources responsible for the fluctuations, since such galaxies are relatively bright at optical wavelength and hence the source number density in the Lockman Hole at optical wavelength would exceed the observed one by more than an order of magnitude: as shown in Table 1 we obtained source density of about sources/sr() at mJy. Using the averaged SED of normal galaxies given by Schmidt et al. (Sch97 (1997)), the B magnitude of a 100 mJy source at 90 m is estimated to be about 16 mag. Reported B-band source counts above B = 16 mag is only a few sources per square degrees(Kirschner et al. KOS79 (1979); Ellis Ell83 (1983)). Hence the galaxies responsible for the fluctuations must be heavily extincted at optical wavelengths, which is a well-known feature of starburst galaxies. In conclusion, the major source of the brightness fluctuations is most probably the star-forming galaxies located at extincted at optical wavelengths.
In the plot of the 90 m counts in Fig. 4, the IRAS counts are also plotted. These were originally the 60 m counts, in which the flux is scaled by the factor (90 m)/(60 m)=2.1. This scaling factor is derived by the IRAS source counts at relatively high fluxes() (Rowan-Robinson et al. Row86 (1986)), and is consistent with the color of normal galaxies with a partial contribution from starburst. Thus, if such galaxies dominate the 60 m counts down to 110 mJy, this scaling is valid. We used the complete differential source counts down to 110mJy by Lonsdale et al. (Lon90 (1990)) and Bertin et al.(Ber97 (1997)), and as shown in Fig. 4 the scaled counts are in good agreement with the model counts given by Guiderdoni et al.(Gui98 (1998)). Since the integrated counts down to 150 mJy is much larger than the model counts, the integrated counts must show a steep rise between 150 mJy and 240 mJy, which, however, could not be observed in the IRAS 60 m counts due to the source confusion(Hacking and Houck Hac87 (1987)). Further studies from space like IRIS and SIRTF will judge if this steep rise is real.
Finally, we mention on the impact of the present work to the cosmic infrared background(CIB). Hauser et al.(Hau98 (1998)) reported an upper limit of 1.1 MJy/sr at 100 m and a positive detection of the CIB of 1.2 MJy/sr at 140 m and 1.1 MJy/sr at 240 m. Lagache et al. (Lag99a (1999)) reported lower values of the CIB: MJy/sr at 140 m and MJy/sr at 240 m by further subtracting the dust emission associated with the diffuse ionized gas. Lagache et al.(Lag00b (2000)) also reported the CIB at 100 m: MJy/sr. By summing the fluxes of all detected sources above 150 mJy, we obtained an integrated brightness of the CIB of 0.031 MJy/sr at 90 m and 0.050 MJy/sr at 170 m. If we consider the constraints on the number counts for shown in Fig. 4, then the integrated brightness would be 0.09 – 0.30 MJy/sr at 90 m for sources above 35 mJy and 0.053 – 0.15 MJy/sr at 170 m for source above 60 mJy. Hence, 5 – 40 per cent of CIB can now be attributed to the integrated light of discrete sources above which are responsible for the fluctuations.
6 Conclusion
We have studied the characteristics of FIR brightness fluctuations at 90 m and 170 m in the Lockman Hole, using the power spectrum analysis over the spatial frequency range of arcmin-1. The spectra of PSDs are found to be rather flat at low frequencies, which differs from that expected for IR cirrus fluctuations. We interpret the spectral characteristics of PSDs as those of randomly distributed point sources. The fluctuations in the Lockman Hole are not dominated by the IR cirrus, and are instead most likely due to star-forming galaxies. We next showed the constraints on the galaxy number counts down to 35 mJy at 90 m and 60 mJy at 170 m, assuming that only galaxies contribute to the observed fluctuation powers. This analysis indicates the existence of steep rise in the integrated counts down to these fluxes and especially at 90 m, the source density is much larger than that expected from the currently available number count models.
We also found a linear correlation between sky brightnesses at 90 m and 170 m, even if pixels around the bright sources are masked from the images. The slope of the linear fit is much lower than the color of the IR cirrus, indicating that the point sources are star-forming galaxies at low or moderate redshift(). These galaxies with fluxes above 35 mJy or 60 mJy also significantly contribute to the CIB recently reported by Hauser et al.(Hau98 (1998)) and Lagache et al.(Lag00b (2000)).
Acknowledgements.
The authors would like to thank Hiroshi Shibai, Tsutomu Takeuchi, Hiroyuki Hirashita, and Chris P. Pearson for their extremely useful comments. HM thanks especially Andreas Efstathiou, who kindly provided us with the cirrus galaxy SED before its publication.References
- (1) Abergel A., Boulanger F., Delouis J.M., Dudziak G., Steindling S., 1996, A&A 309, 245
- (2) Altieri B., Metcalfe L., Kneib J.P., et al., 1998, A&A 343, L65
- (3) Aussel H., Cesarsky C.J., Elbaz D., Starck J.L., 1998, A&A 342, 313
- (4) Bertin E., Dennefeld M., Moshir M., 1997, A&A 323, 685
- (5) Blain A.W., Kneib J.-P., Ivison R.J., Smail I., 1999, ApJ 512, L87
- (6) Dwek E., Arendt R.G., Hauser M.G., et al., 1998, ApJ 508, 106
- (7) Efstathiou A., Rowan-Robinson M., Siebenmorgen R., 2000, A&A, in press
- (8) Efstathiou A., Siebenmorgen R., 2000, in preparation
- (9) Elbaz D., Cesarsky C.J., Fadda D., et al., 1999, A&A 351, L37
- (10) Ellis R.S., 1983, Evolution of faint galaxies. In: Jones B.J.T., Jones, J.E.(eds.) The Origin and Evolution of Galaxies, D. Reidel, p.255
- (11) Fanson J., Fazio G., Houck J., Kelly T., Rieke G., Tenerelli D., Whitten M., 1998, proc. SPIE 3356, 478
- (12) Fixen D.J., Dwek E., Mather J.C., Bennet C.L., Shafer R.A., 1998, ApJ 508, 123
- (13) Gabriel C., Acosta-Pulido J., Henrichsen I., Skaley D., Morris H., Tai W.-M., 1997, The ISOPHOT Interactive Analysis PIA, a calibration and scientific analysis tool. In: Hunt G., Payne H.E.(eds.) Proc. of the ADASS VI conference, ASP conference series, vol. 125, p.108
- (14) Gautier T.N., Boulanger F., Pérault M., Puget J.-L., 1992, AJ 103, 1313
- (15) Guiderdoni B., Bouchet F.R., Puget J.-L, Guilaine G., Hivon E., 1997, Nat 390, 257
- (16) Guiderdoni B., Hivon E., Bouchet F.R., Maffei, B., 1998, MNRAS 295, 877
- (17) Hacking P., Houck J.R., 1987, ApJS 63, 311
- (18) Hauser M.G., Arendt R.G., Kelsall T. et al., 1998, ApJ 508, 25
- (19) Helou G., Beichman C.A., 1990, The confusion limits to the sensitivity of submillimeter telescopes. In: From Ground-Based to Space-Borne Sub-mm Astronomy, Proc. of the 29th Liége International Astrophysical Colloquium, ESA SP-314, p.117
- (20) Herbstmeier U., Abraham P., Lemke D. et al., 1998, A&A 332, 739
- (21) Ishii T.T., Takeuchi T.T., Hirashita H., Yoshikawa, K., 1999, Cosmic star formation history required from infrared galaxy number count: future prospect for Infrared Imaging Surveyor(IRIS). In: Proc. of 33rd ESLAB symp. Star Formation from the Small to the Large Scale, in press
- (22) Jahoda K., Lockman F.J., McCammon D., 1990, ApJ 354, 184
- (23) Kawara K., Sato Y., Matsuhara H., et al., 1998, A&A 336, L9(Paper I)
- (24) Kawara K., Sato Y., Matsuhara H., et al., 2000, in preparation(Paper III)
- (25) Kessler M.F., Steinz J.A., Anderegg M.E., et al., 1996, A&A 315, L27
- (26) Kirschner R.P., Oemler A., Schechter P.L., 1979, AJ 84, 951
- (27) Lagache G., Abergel A., Boulanger F., et al., 1999, A&A 344, 322
- (28) Lagache G., Puget J.L., 2000, A&A 355, 17, astro-ph/9910255
- (29) Lagache G., Haffner L.M., Reynolds R.J., Tufte S.L., 2000, A&A in press, astro-ph/9911355
- (30) Lemke D., Klaas U., Abolins J., et al., 1996, A&A 315, L64
- (31) Lockman F.J., Jahoda K., McCammon D., 1986, ApJ 302, 432
- (32) Lonsdale C.J., Hacking P.B., Conrow T.P., Rowan-Robinson M., 1990, ApJ 358, 60
- (33) Low F.J., Young E., Beintema D.A., et al., 1984, ApJ 278, L19
- (34) Müller T.G., 2000, ISOPHOT aperture sequences on point- and extended sources. In: Laureijs R.J., Leech K., Kessler M.F.(eds.) ISO beyond point sources: studies of extended infrared emission, SP-455, ESA Publications Division, ESA/ESTEC
- (35) Murakami H., 1998, proc. SPIE 3356, 471
- (36) Puget J.L., Lagache G., Clements D.L., et al., 1999, A&A 345, 29
- (37) Rowan-Robinson M., Walker D., Chester T., Soifer T., Fairclough J., 1986, MNRAS 219, 273
- (38) Rowan-Robinson M., 1999, The star-formation history of the universe. In: Lutz D., Tacconi L.(eds.) Ultraluminous Galaxies: Monsters or Babies?, Astrophys. Space Sci., astro-ph/9906308
- (39) Schmidt H.R., Kinney A.L., Calzeti D., Storchi-Bergmann T., 1997, AJ 144, 592
- (40) Takeuchi T.T, Hirashita H., Ohta K., Hattori T.G., Ishii T.T., Shibai H., 1999, PASP 111, 288
- (41) Tan J.C., Silk J., Balland C., 1999, ApJ 522, 579
- (42) Taniguchi Y., Okuda H., Wakamatsu K., et al., 1994, In: Sato K.(ed.) Evolution of the Universe and its Observational Quest, Universal Academy Press, p.545
- (43) Wheelock S., et al., 1994, IRAS Sky Survey Atlas Explanetary Supplement, JPL Publication 94-11