Spectroscopic confirmation of a cluster of galaxies at in the field of the gravitational lens MG2016+112 ††thanks: Based on observations made with the Nordic Optical Telescope, operated on the island of La Palma jointly by Denmark, Finland, Iceland, Norway, and Sweden, in the Spanish Observatorio del Roque de los Muchachos of the Instituto de Astrofisica de Canarias. Based on observations with the Canada-France-Hawaii Telescope at Mauna Kea, Hawaii, USA.
We present new optical data on the cluster AX J2019+1127 identified by the X-ray satellite ASCA at Hattori et al. (1997). The data suggest the presence of a high-redshift cluster of galaxies responsible for the large separation triple quasar MG2016+112. Our deep photometry reveals an excess of galaxy candidates, as already suspected by Benítez et al. Benítez, Broadhurst, Rosati, Courbin, Squires, Lidman, & Magain (1999). Our spectroscopic survey of 44 objects in the field shows an excess of 6 red galaxies securely identified at , with a mean redshift of . We estimate a velocity dispersion of km s-1 based on these 6 galaxies and a V-band mass-to-light ratio of . Our observations thus confirm the existence of a massive structure acting as the lens, which explains the unusual configuration of the triple quasar. Hence, there is no need to invoke the existence of a “dark cluster” to understand this lens system.
Key Words.:
cosmology: observations – dark matter – galaxies: clusters: general – galaxies: clusters: individual: MG2016+112 – gravitational lensing – X-rays: galaxies1 Introduction
Gravitational lensing is an efficient way to probe the mass content of the Universe. It acts on many scales, from dark stellar-mass objects to the largest massive structures Mellier (1999). Some of the most spectacular examples of this phenomenon are the multiple quasar systems already known for 20 years Walsh et al. (1979). However, in most cases simple lens models cannot reproduce the image geometry and flux ratios, unless an additional external component such as external shear is included in the modeling Keeton et al. (1997). Furthermore in the cases of large-separation multiple quasars, the mass-to-light ratio of the main galaxy lens is generally much higher than what is usually expected for a galaxy. As an example, the double quasar Q0957+561, with a separation of 6″, is well explained with a deflector corresponding to a massive and bright galaxy combined with the additional effect of a cluster of galaxies centered on it (Bernstein & Fisher 1999, and references therein). This cluster was indeed spectroscopically confirmed at the redshift of the main galaxy deflector Angonin-Willaime et al. (1994). In general, it is becoming evident that the likely explanation of the external shear necessary to understand the wide separation lensing configurations is the existence of a group/cluster near the line of sight of these multiple quasars. In particular, cluster mass distributions have been detected in several other wide-separation multiple quasars such as the so-called “Cloverleaf” Kneib et al. (1998) and RX J0911+05 Burud et al. (1998); Kneib et al. (2000).
A mysterious system in this respect is the triple quasar MG2016+112 (). It was discovered by Lawrence et al. Lawrence, Schneider, Schmidt, Bennett, Hewitt, Burke, Turner, & Gunn (1984) and studied in more detail by Schneider et al. Schneider, Lawrence, Schmidt, Gunn, Turner, Burke, & Dhawan (1985, 1986) in the optical and by Garret et al. Garrett, Muxlow, Patnaik, & Walsh (1994, 1996) in the radio. The third image named C presents a complex structure, suggesting some differential magnification of the source within each image. Deep imaging revealed the existence of a giant elliptical galaxy at named D and located between the 3 images. It is identified as partly responsible for the multiple lensing of the quasar, although its mass is insufficient to explain the complex nature of the lensed images of MG2016+112. Detailed modeling requires another source of lensing mass, such as the mass of a rich cluster, centered on galaxy D Narasimha et al. (1987). In order to reveal the exact nature of the lens, deep X-ray searches have been attempted to probe hot intra-cluster gas. A positive X-ray detection of a cluster-like emission was obtained, centered on MG2016+112 Hattori et al. (1997). The X-ray characteristics (notably an emission line at keV and the extended nature of the emission) indicate that AX J2019+1127 is an X-ray cluster of galaxies at . The X-ray temperature related to this emission gives T = keV and an X-ray luminosity L erg s-1 in the 2–10 keV band, quite compatible with the LX–TX relation for clusters of galaxies Markevitch (1998). The mass derived from the X-ray analysis is about M⊙ within 500 kpc, a typical value for rich clusters of galaxies with velocity dispersion of km s-1 (assuming the observed relation, Girardi et al. 1996). A re-analysis of the HRI/ROSAT imaging Benítez et al. (1999) seems to slightly decrease the expected cluster mass, without rejecting its detection. In addition, deep near-IR imaging of the field was used to identify a ‘red sequence’ in the color-magnitude diagramme, presumably due to early-type galaxies in the cluster.
Recently, Clowe et al. Clowe, Trentham, & Tonry (2000) revisited the Benítez et al. optical data, complemented with ultra-deep Keck R-band images. Again a sequence of cluster galaxies was clearly identified and its spatial distribution analyzed. More interesting is their weak lensing analysis of the faint galaxies from the R-band image, which seems to give a signal in the field. Its center appears offset about 1′ North of MG2016+112 itself and its mass is consistent with the mass inferred from X-ray data. The authors claim they can rule out a mass centered exactly on MG2016+112, at a level. Complementary data are clearly required to better quantify these preliminary results of relatively low significance.
In this paper, we present new spectroscopic observations in the field of this peculiar lens, aimed at identifying the lensing cluster. Observations and data reduction are described in Section 2, the results are presented in Section 3. Section 4 presents a preliminary analysis of the lensing cluster identified at . Section 5 gives some conclusions and prospects in the understanding of this object.
Throughout the paper, we use a Hubble constant of H km s-1 Mpc-1, with and . At the cluster redshift (), 1″ corresponds to 8.52 kpc and 1 Mpc covers 2′.
2 Observations and data reduction
2.1 Photometry
The imaging data were obtained in R and I-bands in June 1996 at the Nordic Optical Telescope, using the HiRAC instrument with a LORAL 2k2k CCD, giving a pixel size of 0107. The data reduction was performed in the IRAF111IRAF is distributed by NOAO, which are operated by AURA, Inc., under cooperative agreement with NSF. environment. Observations of M92 at various airmasses provided a calibration to the Landolt system Landolt (1992) based on CCD photometry of the field (L. Davis, private communication). The zero-point, color coefficient and extinction was then computed using the PHOTCAL package. In the relatively crowded field of MG2016+112 bright foreground stars with a significant PSF tail extending to many tens of arc-seconds hampered conventional photometry of the much fainter galaxies of interest. Moreover, PSF subtraction of point sources in the combined image proved difficult due to interpolation artifacts during the image mapping to a common coordinate system. Instead the bright unsaturated stars were removed by PSF subtraction on the individual images. To compensate for possible PSF variations in the field we experimented with both a constant and second order varying PSF. No significant differences were detected, however, and the constant PSF was therefore used. The spatial image transformations determined from the pre-PSF subtracted images were then applied and combined to get the final R and I images. The FWHM of unsaturated stars in these images were found to be 075 and 069 in the R and I-bands, respectively.
Galaxy photometry was computed using the MAG_BEST estimate from SExtractor Bertin & Arnouts (1996) and transformed to the standard Landolt system using the derived photometric transformation. The photometric catalogue was not corrected for Galactic extinction although for this particular field, the correction could be as high as 0.5 magnitude, depending on the filter. Finally conversion to AB magnitudes was done using coefficients (c, c) given in Fukugita et al. Fukugita, Shimasaku, & Ichikawa (1995). A total of 7 R-band images ( sec) and 10 I-band images ( sec) were combined reaching 3 sky limits of and within the seeing disk (1.5FWHM), respectively. A significant fraction of faint (cluster member) galaxies are expected to remain undetected owing to the strong halos of saturated stars in the field and the fact that the photometry of the field is not extremely deep.
2.2 Spectroscopy
Spectroscopic data were acquired on the nights August 2–4, 1997 at the Canada-France-Hawaii Telescope with the OSIS multi-object spectrograph Le Fèvre et al. (1994). A tip-tilt correction is introduced thanks to the guiding on a selected star in the field. The seeing is then significantly improved ( measured on our images), increasing the detectivity of the instrument for faint object spectroscopy. We used the STIS2 thinned CCD, with pixels of 21 m (or 0151 on the sky) covering a field of view of . We also used the R150 grism, giving a useful spectroscopic signal from 4500 to 9000 Å and a dispersion of 3.7Å/pixel. The slits were 10″ long and 10 in width, giving a final instrumental resolution of 18Å. Two masks were punched with 19 slits and 18 slits respectively, and observations were obtained for 21600 seconds for Mask1 (6 exposures) and 23400 seconds for Mask2 (7 exposures) in good weather conditions with seeing ranging from 05 to 08. The spectroscopic targets were selected from the photometric catalogue, with the following criteria: and , with a careful selection of resolved objects. These criteria were optimized to avoid a strong contamination of the sample by the faint stars crowding at this low galactic field, and to increase the chance of selecting high redshift galaxies.
Data were reduced with the MULTIRED package Le Fèvre et al. (1995). Spectra were bias-subtracted, flat-fielded and extracted. The wavelength calibration gave typical internal errors of Å. The spectra were finally rebinned to a dispersion of 6Å/pixel, better matched to the resolution of the instrument. We encountered some difficulties with the flux calibration in the red end of the spectra because no order-separating filter was used. So contamination by the second order contribution was significant above 7500–8000Å, giving lower confidence to the flux calibration above this limit.
| Name_id | z | Comments | ||||
|---|---|---|---|---|---|---|
| M1_5 | 20:19:12.90 | +11:28:11.5 | 22.20 | 1.11 | 0.8417 | [OII](em) - bluer continuum than M1_6 |
| M1_6 | 20:19:13.51 | +11:28:13.7 | 22.69 | 1.68 | 0.8431 | [OII](em), [OIII](em) |
| M1_7 | 20:19:15.02 | +11:27:08.8 | 22.16 | 1.17 | 0.9659 | [OII](em), H |
| M1_8 | 20:19:15.80 | +11:27:44.4 | 22.80 | 1.23 | 0.9793 | [OII](em), H, H ? |
| M1_9 | 20:19:16.43 | +11:27:18.2 | 22.14 | 1.73 | 1.001 | 4000Å break, G |
| M1_11a | 20:19:17.79 | +11:27:13.1 | 23.29 | 1.36 | 3.2692 | Object B1 – Ly(em) |
| M1_11b | 20:19:17.99 | +11:27:13.4 | 22.78 | 0.45 | 3.2602 | Radiosource B |
| M1_11c | 20:19:18.07 | +11:27:13.2 | 22.41 | 1.86 | 1.0037 | Object D – [OII](em), H&K, 4000Å break, G |
| M1_12 | 20:19:18.98 | +11:28:45.0 | 23.03 | 0.64 | 0.6435 | [OII](em), H&K, H, [OIII](em) |
| M1_13 | 20:19:19.54 | +11:27:01.4 | 22.65 | 1.57 | 1.011 | [OII](em), H, 4000Å break, H? |
| M1_15 | 20:19:21.30 | +11:27:29.9 | 22.64 | 1.61 | 0.8231 | H&K, 4000Å break, G |
| M1_16 | 20:19:22.24 | +11:27:30.2 | 21.34 | 0.91 | 0.6147 | [OII](em), H, [OIII](em) |
| M1_17 | 20:19:22.98 | +11:27:26.4 | 22.16 | 1.77 | 1.0027 | weak [OII](em), H&K, 4000Å break |
| M1_18 | 20:19:23.47 | +11:28:15.6 | 22.34 | 0.98 | 0.8574 | [OII](em), H, H |
| M1_19 | 20:19:24.55 | +11:27:44.5 | 22.76 | 0.88 | 1.1185 | [OII](em), H&K, 4000Å break |
| M2_1 | — | — | — | — | 0.3143 | H&K, 4000Å break, G |
| M2_3 | 20:19:10.98 | +11:25:31.0 | 21.01 | 1.01 | 0.7460 | [OII](em), H&K, 4000Å break, H, H |
| M2_4 | 20:19:12.87 | +11:26:39.4 | 22.92 | 1.15 | 1.0120 | [OII](em), K, H, H |
| M2_5 | 20:19:13.37 | +11:26:31.5 | 22.11 | 1.53 | 0.8088 | [OII](em), H&K, 4000Å break, H |
| M2_7 | 20:19:15.10 | +11:28:07.8 | 22.43 | 0.58 | 0.6687 | [OII](em), [OIII](em) |
| M2_8 | 20:19:16.19 | +11:26:40.5 | 22.18 | 0.32 | 0.5202 | [OII](em), H&K, G, [OIII](em) |
| M2_9 | 20:19:17.06 | +11:26:47.8 | 23.24 | 1.42 | 0.9749 | 4000Å break, G ? |
| M2_10 | 20:19:18.05 | +11:27:11.6 | 22.60 | 0.94 | 3.2626 | Radiosource C |
| M2_11 | 20:19:18.75 | +11:27:19.8 | 22.36 | 1.59 | 1.000 | MgII(2800), H&K, 4000Å break, H, H |
| M2_12 | 20:19:20.14 | +11:26:48.4 | 22.19 | 0.90 | 0.863 | 4000Å break, H |
| M2_13a | 20:19:20.78 | +11:27:17.7 | 22.18 | 1.40 | 0.8247 | [OII](em) ?, H&K, 4000Å break, G |
| M2_13b | 20:19:20.83 | +11:27:17.4 | — | — | 0.8255 | [OII](em), [OIII](em) |
| M2_14 | 20:19:21.82 | +11:26:49.5 | 22.50 | 0.75 | 0.8057 | [OII](em), 4000Å break, H |
| M2_15 | 20:19:22.32 | +11:26:17.1 | 21.74 | 1.28 | 0.6740 | [OII](em), H&K, 4000Å break, H, G, [OIII](em) |
| M2_16 | 20:19:23.28 | +11:26:06.7 | 20.74 | 1.17 | 0.6675 | [OII](em), H&K, 4000Å break, G |
| M2_17 | 20:19:23.88 | +11:26:26.1 | 22.80 | 1.33 | 0.6634 | H&K, 4000Å break, G |
Finally, the redshift measurement of the spectra was done, using the RVSAO2.0 package Kurtz & Mink (1998) and correlating the observed spectra with a set of stellar and galactic templates. Because of the low S/N for most of the spectra, a visual check of the spectral identification was done carefully as well, in order to help the redshift measurement of the less significant spectra.
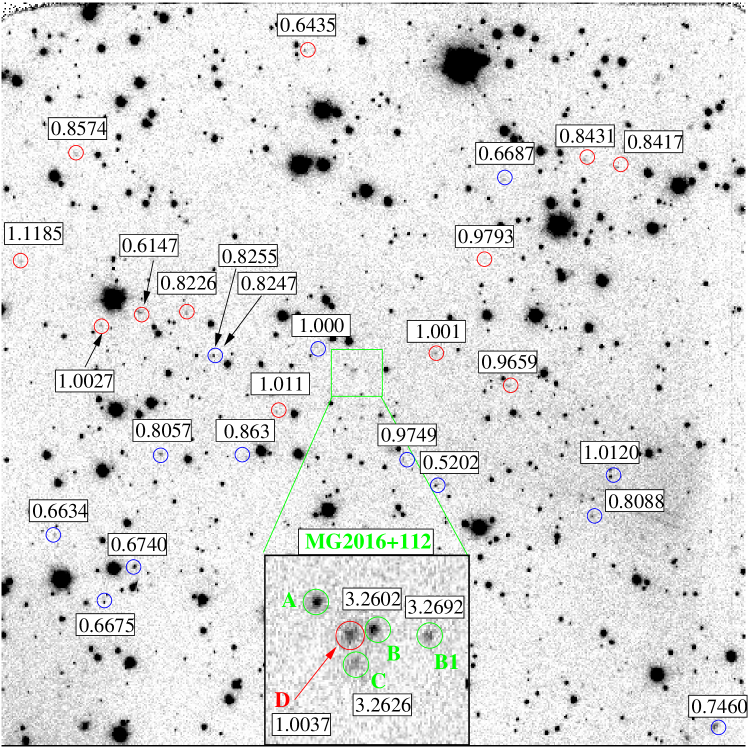
Among the 44 spectra extracted (in some of the 37 slits, more than 1 spectrum was extracted), 10 correspond to stars and 3 remain unidentified due to a poor S/N ratio, but these are most probably non-stellar. For the 31 remaining spectra the redshift identification is presented in Table 1 and in Fig. 1. The redshift distribution of these 31 objects is shown in Fig. 2. The sample is far from complete in magnitude so no conclusion can be drawn on the redshift distribution of the galaxies along this line of sight. An excess of galaxies around is, however, clearly seen and corresponds to the redshift of galaxy D already identified in Schneider et al. Schneider, Gunn, Turner, Lawrence, Hewitt, Schmidt, & Burke (1986). Two other concentrations are suspected which are also spatially coherent at and , with a somewhat lower significance.

3 The lensed source MG2016+112
Most of our results on the multiple images of the radio source MG2016+112 are presented in Yamada et al. Yamada, Yamazaki, Hattori, Soucail, & Kneib (2000) who study in detail the emission-line properties of the images B and C. Note that this is the first spectrum of C observed in the optical (Fig. 3), after its identification as a third image by its Ly emission Schneider et al. (1986) and its radio emission Garrett et al. (1994). The higher resolution of our spectrograph compared to the spectrum of B presented in Schneider et al. Schneider, Lawrence, Schmidt, Gunn, Turner, Burke, & Dhawan (1985) allows to resolve the main emission lines and then to study the physics of the emitting regions in the source.
Schneider et al. Schneider, Gunn, Turner, Lawrence, Hewitt, Schmidt, & Burke (1986) claimed that 2 objects, labeled A1 and B1, detected close to the triple radio-source, were at the same redshift as the lensed source. They identified them from a narrow-band image of the field, centered on Ly redshifted to 3.26. A close look at our deep I and R images confirms the detection of B1 but not A1. B1 was positioned in one slit of Mask 2 and its spectrum (Fig. 3) confirms its redshift at , similar but different from MG2016+112. Note however that the emission-line properties of B1 are quite different from those of B, with only Ly in emission. SiIV and CIV may be detected in absorption but with a lower confidence. If true, these lines are representative of a young stellar component in the source, rather than an active nucleus.

4 The lensing cluster at
In our spectroscopic sample, 9 objects have a redshift , with 8 new spectroscopic identifications (Fig. 4). This confirms that a coherent gravitational structure is associated with object D, previously suspected as the main lens Hattori et al. (1997). Not surprisingly, these objects are among the reddest ones in Table 1. This justifies a posteriori the color selection we introduced in the mask production. Moreover, if one concentrates on the objects selected in a 0.5 Mpc radius around galaxy D, we note that all galaxies are at except one at . As there are not many other red galaxies in this region, we may have identified most of the brighter cluster galaxies. In this respect deep IR imaging should help to identify fainter cluster members, because the foreground contamination is less important in the near-IR.

From multicolor photometry only, Benítez et al. Benítez, Broadhurst, Rosati, Courbin, Squires, Lidman, & Magain (1999) followed by Clowe et al. Clowe, Trentham, & Tonry (2000) attempted to isolate cluster galaxies from their colors in the red and near-infrared. Of course this selection procedure favors old-type galaxies and avoids strong star-forming ones which are more likely mixed with field galaxies. We compared their sample with our spectroscopically confirmed cluster members and found a good agreement with their selected objects. In particular we confirm the cluster membership of objects B5 ( M1_9, ), B6 ( M1_13, ) and B2 ( M2_11, ), while we find a lower redshift for object labeled # 3 in Clowe et al. Clowe, Trentham, & Tonry (2000). Note that their identification was done after our preliminary results presented in the CFHT Inofrmation Bulletin (report # 38, 1998), so their sequence may not be quite independent from our first results.
Among the 9 galaxies at , 4 galaxies (+ 2 more uncertain ones) show the [OII] 3727Å line in emission, indicating active star formation in these galaxies. This may be a sign of the relative youth of this cluster or sign of interaction between the galaxies and the intra-cluster medium. Note that similar trends were observed in a few other high redshifts clusters Postman et al. (1998). To address in more detail the question of the evolution of galaxies and their spectral content in high redshift galaxies, a large sample of cluster members should be analyzed spectroscopically as well as through their optical and near-IR colors, including morphological information. This kind of data is now within the reach of 8–10m class telescopes equiped with optical and near-IR instruments.
From a dynamical point of view, we can derive a rough estimate of the velocity dispersion, although with small numbers it is difficult to measure accurate properties. If we keep the total sample of 9 galaxies, we find a mean redshift of and a velocity dispersion of km s-1. The maximum difference is km s-1. These values are rather unrealistic for a well defined dynamical structure. But among our 9 galaxies, 3 are isolated around a redshift , while the 6 others are spread around . We suspect the first 3 galaxies may belong to a small structure such as a group, spatially and dynamically close to the main one. But we are well aware that these assumptions are quite unsecure because of the small numbers. Considering then the 6 galaxies in the redshift range we find a mean redshift of , a velocity dispersion of km s-1 and a velocity range: km s-1. These values make more sense in view of the X-ray observations, although the error bars are still quite large.
Using the virial theorem, we can estimate the mass of this system within the harmonic radius defined as Nolthenius & White (1987):
| (1) |
where is the angular distance between galaxies and , is the number of cluster members, and is the angular diameter distance at the mean cluster redshift . The cluster virial mass can then be estimated as
| (2) |
With our sample of 6 galaxies, we find an harmonic radius of kpc and a virial mass of M⊙. The error bars quoted in the virial mass correspond to the errors in the velocity dispersion measure only. They do not include uncertainties due to the harmonic radius although they may be significant, because of our very small sample of cluster members. As quoted by Carlberg et al. Carlberg, Yee, Ellingson, Abraham, Gravel, Morris, & Pritchet (1996), the use of the harmonic radius may underestimate the virial mass determination because is highly sensitive to close pairs and rather noisy.
We can also compare our dynamical mass with the galaxy distribution to get an estimate of the mass-to-light ratio of the structure. Our own measure of the luminosity of the 6 cluster members, corrected the same was as Benítez et al. Benítez, Broadhurst, Rosati, Courbin, Squires, Lidman, & Magain (1999) [k-correction of 3.42 in V and 1.12 in I, average color index for the galaxies, average extinction correction magnitude] gives a total luminosity of for these galaxies. It is about 50% higher than the luminosity of their 9 cluster member candidates and 60% smaller than their extrapolated total magnitude. A more accurate luminosity function determination is necessary for a correct estimate of the total luminosity, and the M/L ratio. Following the reasonable total luminosity function of the cluster galaxies estimated by Benítez et al. Benítez, Broadhurst, Rosati, Courbin, Squires, Lidman, & Magain (1999) () we find a mass-to-light ratio of
This value can be compared with two other estimates proposed for this cluster. From the X-ray emission and the measurements of Hattori et al. Hattori, Ikebe, Asaoka, Takeshima, Böhringer, Mihara, Neumann, Schindler, Tsuru, & Tamura (1997) we find a value within a radius of 400 kpc. Note that an error of a factor two occurs in the estimate of in Benítez et al. Benítez, Broadhurst, Rosati, Courbin, Squires, Lidman, & Magain (1999), due to an error in the conversion between and units. From an extrapolation of their lens model they also find a lensing , within a radius of 400 kpc of 186 . Our determination falls within the same range as these two estimates. All of them are based on the cluster luminosity estimated by Benítez et al. which is most probably underestimated because of the difficulties in selecting cluster members in the optical in this low galactic latitude field. In addition, no evolution corrections are included, which at such high redshift would increase the ratio, typically by a factor of 2 Smail et al. (1997). Better estimates will come from near-IR imaging where both effects are strongly reduced. In all cases, the value proposed for MG2016+112 is slightly higher than other accepted values found in other high redshift clusters: Smail et al. Smail, Ellis, Dressler, Couch, Oemler, Sharples, & Butcher (1997) find an average within 800 kpc for their sample of clusters in the redshift range [0.2–0.5], while Carlberg et al. Carlberg, Yee, Ellingson, Abraham, Gravel, Morris, & Pritchet (1996) have a median value of for the CNOC sample. For a more distant cluster (), Deltorn et al. Deltorn, Le Fèvre, Crampton, & Dickinson (1997) find a slightly higher value of within a radius of 400 kpc from 11 cluster members. In any case, MG2016+112 is not a “dark cluster” anymore with a ratio as high as 1000 as suspected initially when most of the light was concentrated on galaxy D.
5 Conclusions
We have presented a photometric and spectroscopic survey of the field around the triple lens MG2016+112. Our observations confirm the identification of a massive cluster at Hattori et al. (1997). With the identification of 6 secure cluster members we have estimated the velocity dispersion km s-1 and used this to infer the virial mass associated with the cluster. Although we are well aware of the limitations due to the small number statistics of our sample in the analysis of the cluster mass, we also tried to compare with other estimates such as the mass inferred from the X-ray analysis or a weak lensing one. All the M/L ratios derived that way are consistent with each other. The value found ( for the dynamical analysis) is also consistent with what is found in other high redshift clusters, although we cannot yet deduce any evolution in this ratio. But clearly the cluster around MG2016+112 is not a dark cluster anymore.
To overcome most of the observational difficulties due to the low galactic latitude of the field, we underline the need of deep near-infrared imaging to increase the density contrast of galaxies clustered around the lensed source and to reduce the uncertainties in the luminosity function of these galaxies. A deeper spectroscopic follow-up with a spectrograph on a 8–10m telescope will also increase the identification of cluster members and a better dynamical analysis. Furthermore, deep X-ray observations with the 2 new X-ray satellites, Chandra and XMM-Newton, will also increase the accuracy in the cluster X-ray emission (exact location of the center, good determination of the mass profile, better measure of the temperature and Fe abundance, etc.), leading to a more accurate cluster mass measure.
As the number of clusters of galaxies at redshift is still small it is valuable to focus on their details to better understand the physical properties and the rate of evolution, necessary to relate them to the local distribution of clusters of galaxies. Large separation quasars are probably a good alternative way to detect high redshift structures.
Acknowledgements.
We wish to acknowledge fruitful discussion with D. Clowe, Y. Mellier and P. Schneider. JPK acknowledges support from CNRS, JH from the Danish Natural Science Research Council (SNF).References
- Angonin-Willaime et al. (1994) Angonin-Willaime, M. C., Soucail, G., & Vanderriest, C. 1994, A&A, 291, 411
- Benítez et al. (1999) Benítez, N., Broadhurst, T., Rosati, P., Courbin, F., Squires, G., Lidman, C., & Magain, P. 1999, ApJ, 527, 31
- Bernstein & Fischer (1999) Bernstein, G. & Fischer, P. 1999, AJ, 118, 14
- Bertin & Arnouts (1996) Bertin, E. & Arnouts, S. 1996, A&AS, 117, 393
- Burud et al. (1998) Burud, I., Courbin, F., Lidman, C., Jaunsen, A. O., Hjorth, J., Østensen, R., Andersen, M. I., Clasen, J. W., Wucknitz, O., Meylan, G., Magain, P., Stabell, R., & Refsdal, S. 1998, ApJ Lett., 501, 5
- Carlberg et al. (1996) Carlberg, R. G., Yee, H. K. C., Ellingson, E., Abraham, R., Gravel, P., Morris, S., & Pritchet, C. J. 1996, ApJ, 462, 32
- Clowe et al. (2000) Clowe, D., Trentham, N., & Tonry, J. 2000, A&A, submitted, astro-ph/0001309
- Deltorn et al. (1997) Deltorn, J. M., Le Fèvre, O., Crampton, D., & Dickinson, M. 1997, ApJ Lett., 483, 21
- Fukugita et al. (1995) Fukugita, M., Shimasaku, K., & Ichikawa, T. 1995, PASP, 107, 945
- Garrett et al. (1994) Garrett, M. A., Muxlow, T. W. B., Patnaik, A. R., & Walsh, D. 1994, MNRAS, 269, 902
- Garrett et al. (1996) Garrett, M. A., Porcas, R. W., Nair, S., & Patnaik, A. R. 1996, MNRAS, 279, L7
- Girardi et al. (1996) Girardi, M., Fadda, D., Giuricin, G., Mardirossian, F., Mezzetti, M., & Biviano, A. 1996, ApJ, 457, 61
- Hattori et al. (1997) Hattori, M., Ikebe, Y., Asaoka, I., Takeshima, T., Böhringer, H., Mihara, T., Neumann, D. M., Schindler, S., Tsuru, T., & Tamura, T. 1997, Nat, 388, 146
- Keeton et al. (1997) Keeton, C. R., Kochanek, C. S., & Seljak, U. 1997, ApJ, 482, 604
- Kneib et al. (1998) Kneib, J.-P., Alloin, D., & Pello, R. 1998, A&A, 339, L65
- Kneib et al. (2000) Kneib, J.-P., Cohen, J., & Hjorth, J. 2000, ApJ Lett., in press, astro-ph/0006106
- Kurtz & Mink (1998) Kurtz, M. J. & Mink, D. J. 1998, PASP, 110, 934
- Landolt (1992) Landolt, A. U. 1992, AJ, 104, 340
- Lawrence et al. (1984) Lawrence, C. R., Schneider, D. P., Schmidt, M., Bennett, C. L., Hewitt, J. N., Burke, B. F., Turner, E. L., & Gunn, J. E. 1984, Science, 223, 46
- Le Fèvre et al. (1994) Le Fèvre, O., Crampton, D., Felenbok, P., & Monnet, G. 1994, A&A, 282, 325
- Le Fèvre et al. (1995) Le Fèvre, O., Crampton, D., Lilly, S. J., Hammer, F., & Tresse, L. 1995, ApJ, 455, 60
- Markevitch (1998) Markevitch, M. 1998, ApJ, 504, 27
- Mellier (1999) Mellier, Y. 1999, ARA&A, 37, 127
- Narasimha et al. (1987) Narasimha, D., Subramanian, K., & Chitre, S. M. 1987, ApJ, 315, 434
- Nolthenius & White (1987) Nolthenius, R. & White, S. D. M. 1987, MNRAS, 225, 505
- Postman et al. (1998) Postman, M., Lubin, L. M., & Oke, J. B. 1998, AJ, 116, 560
- Schneider et al. (1986) Schneider, D. P., Gunn, J. E., Turner, E. L., Lawrence, C. R., Hewitt, J. N., Schmidt, M., & Burke, B. F. 1986, AJ, 91, 991
- Schneider et al. (1985) Schneider, D. P., Lawrence, C. R., Schmidt, M., Gunn, J. E., Turner, E. L., Burke, B. F., & Dhawan, V. 1985, ApJ, 294, 66
- Smail et al. (1997) Smail, I., Ellis, R. S., Dressler, A., Couch, W., Oemler, A. J., Sharples, R. M., & Butcher, H. 1997, ApJ, 479, 70
- Walsh et al. (1979) Walsh, D., Carswell, R. F., & Weymann, R. J. 1979, Nat, 279, 381
- Yamada et al. (2000) Yamada, T., Yamazaki, S., Hattori, M., Soucail, G., & Kneib, J.-P. 2000, A&A, submitted, astro-ph/9908089