The Active Nucleus in the Ultraluminous Infrared Galaxy IRAS 083112459
Abstract
Near-infrared spectroscopy using the new Palomar Integral Field Spectrograph indicates the presence of an AGN (active galactic nucleus) in the ultraluminous infrared galaxy IRAS 083112459. The high-velocity wings of the Paschen- hydrogen recombination line are seen to be spatially unresolved, and with no positional offset between red and blue high velocity emission. The [Si VI] coronal line, with a 167 eV excitation potential, is also spatially unresolved with a velocity width comparable to that of the broad component of the Pa emission. The low velocity component of the Pa emission is seen to be rotating, and is extended over kpc. Molecular hydrogen is also extended, and elongated along the maximum velocity gradient, sharing the same rotation profile as the narrow Pa emission. The simple picture in agreement with the observations is that of an AGN surrounded by a rotating disk of star formation. These observations lend strength to the usage of [Si VI] as a diagnostic of AGN activity in ultraluminous infrared galaxies, and also highlight the utility of integral field spectroscopy in elucidating subtle morphological differences in line emitting regions.
1 Introduction
Ultraluminous infrared galaxies (ULIRGs) are among the most luminous sources in the universe, with infrared luminosities of . The bulk of the energy emitted from these sources emerges in the far-infrared, suggesting that the light we see is thermally processed by warm dust in the galaxies. As such, the optically thick dust prohibits direct viewing of the mechanism responsible for the extreme power generation. Quasars (or more generally QSOs—quasi stellar objects) and massive starbursts are perhaps the only phenomena capable of producing the high luminosities observed in these systems. Recent spectroscopic programs at infrared wavelengths have shown that the great majority of ULIRGs with are powered predominantly by starbursts rather than by AGN (Genzel et al., 1998; Rigopoulou et al., 1999; Murphy et al., 1999; Veilleux, Sanders, & Kim, 1997, 1999). At luminosities higher than this, the AGN fraction rises to between one-third and one-half.
IRAS 083112459 is a ULIRG at km s-1 (1 arcsec = 1.7 kpc) with , and is classified as a “warm” ULIRG by the definition of Sanders et al. (1988). This galaxy is selected from the 2Jy ULIRG sample of Strauss et al. (1990, 1992), and is a single-nucleus galaxy surrounded by tidal debris (Murphy et al., 1996). The near-infrared spectrum of IRAS 083112459 (Murphy et al., 1999) shows emission line features suggestive of AGN activity, though a scenario involving strong shocks and high velocity outflows could also explain these spectral features. This galaxy was selected for the present study because it is the only galaxy in a volume-limited sample of 33 ULIRGs (Murphy et al., 2000) showing strong [Si VI] emission, and one of two displaying any obvious high-velocity Pa emission. Calculated quantities involving luminosities and physical scales assume a cosmology with km s-1 Mpc-1 and throughout this paper.
Near-infrared integral field spectroscopy, effectively providing simultaneous velocity-resolved imaging capabilities of multiple emission lines, allows subtle morphological differences between various line emitting regions to be elucidated. In this paper we present integral field observations of the Pa, H2 1–0 S(3), and 167eV excitation [Si VI] emission lines in IRAS 083112459, which together form a consistent picture of a galaxy containing a central AGN surrounded by a starburst disk.
2 Observations and Data Reduction
Observations were made using the Palomar Integral Field Spectrograph (PIFS) situated at the /70 focus of the 200-inch Hale Telescope. This instrument produces simultaneous spectra for eight slits in a contiguous two-dimensional field of view. A description the PIFS instrument, along with general observing and data reduction procedures can be found in Murphy, Matthews, & Soifer (1999). IRAS 083112459 was observed on the night of 25 March 1999. The resolution mode ( km s-1) was used to obtain two spectra centered on the redshifted Pa, and H2 1–0 S(3)[Si VI] lines, respectively. Separate sky exposures were alternated with the on-source integrations, with integration times of 300 s. A positional dither pattern was employed for the sequence of integrations enabling recovery of seeing-limited spatial resolution in the cross-slit direction. The pixel scale for these observations is 0.167 arcsec pixel-1. An offset field star was used for auto guiding, with image motion compensated by driving the active secondary mirror. Guided observations of a nearby star, with 10 s exposures, accompanied the spectral observations for the purpose of evaluating the point spread function (PSF) . Wavelength calibration is provided through a combination of OH airglow lines (Oliva & Origlia, 1992) and arc lamp spectra taken at the time of observation. All wavelengths are referred in air units. Atmospheric opacity and spectral flat-fielding are compensated simultaneously using the light from HR 3862, a 4.9 mag G0 V star, spread uniformly across the field of view. At the time of observation, the G star was at an airmass of , well matched to the airmass of the science observations.
For these observations, the 5496 field of view was oriented with the long axis at a position angle of 90∘. The Pa line was observed with 1800 s of on-source integration time at an average airmass of 2.00. The H[Si VI] lines were observed for 2100 s of on-source time at an average airmass of 1.96. The seeing for the Pa dataset, as determined via imaging of the PSF star, was measured at 100 midway through the observation, and 115 at the end. The telescope was then focused, resulting in a PSF full-width at half-maximum (FWHM) of 105. Observations of the H[Si VI] line immediately followed, with the PSF measuring 085 midway through, and 095 at the end of the observation. The measures of seeing should not be taken entirely at face value, as variability over the time scales of the spectral observations limits the accuracy of the very short PSF exposures at estimating the average seeing conditons. Furthermore, the sliced PSF images are adequate for assessing the approximate size of the seeing disk, but of insufficient quality to permit characterization of subtle distortions such as may be caused by slight telescopic astigmatism. All observations presented here were made in clear photometric conditions. Photometric calibration was performed via imaging of the galaxy and of the faint standard star 9143 from Persson et al. (1998), using a flip-in mirror in front of the grating, thereby establishing the continuum flux density at 2.155 m. The continuum slopes observed in the Pa and H[Si VI] spectra were used to estimate the continuum level for the Pa spectrum.
Data reduction consists of first performing the sky subtraction, interpolating static bad pixels and cosmic ray artifacts, division by the G star spectrum, and multiplication by a blackbody spectrum matched to the G star’s temperature of 5930 K. The H[Si VI] spectrum was multiplied by a template G3 V spectrum from Kleinmann & Hall (1986), smoothed and resampled to the PIFS resolution, in order to remove the Br stellar absorption line introduced in the division by the HR 3862 spectrum. No calibrator absorption lines of any significance effect the Pa spectrum. Spatial and spectral distortions are corrected using previously generated distortion maps appropriate for the particular grating setting. Co-registration of the eight slits in the spatial dimension is based upon observation of the G star with its light extended perpendicular to the slit pattern by chopping the telescope secondary mirror in a triangle-wave pattern. The two-dimensional spectra from the eight slits are placed into the three-dimensional datacube according to the positional dither pattern, with a common wavelength axis established by the calibration lines. Residual OH airglow lines are removed by subtracting a scaled version of the raw sky spectrum, with typical scalings of 2% in absolute value, sometimes as large as 5%. Photometric variability among individual integrations is compensated by small scaling adjustments such that the object flux is consistent from one integration to the next. A more complete description of the data reduction procedures may be found in Murphy, Matthews, & Soifer (1999).
In the data presented here, the pure continuum images are constructed directly from the integral field datacube, and constructed from spectral regions free of line emission as well as OH airglow emission. For each spatial pixel, a linear fit is made to the line-free portion of the continuum spectrum. The line images are formed by subtracting this continuum fit from the datacube, then summing over a small range in the spectral dimension. In this way, the line images simulate continuum-free narrow band images at arbitrary wavelengths—or velocities—within the datacube. The co-registration of the continuum and line images is implicit, as the images are derived from the same dataset.
3 Results
3.1 Pa Emission Line
Figure 1 shows the appearance of the Pa spectrum (m), taken from a 083083 square aperture centered on the continuum peak of the galaxy. The resolved velocity profile of the line shows broad wings around a moderately narrow peak. The wings appear asymmetric, with more emission blue-ward of the line center. Part of this asymmetry likely comes from the He I line at a rest wavelength of 1.8689m, with an estimated contribution of % of the Pa flux, as is characteristic in ULIRGs (Murphy et al., 1999). Subtracting the expected He I contribution with the same velocity profile as Pa almost completely removes the blue excess, resulting in a Pa profile consistent with being symmetric. A multiple Gaussian line fit, whose components are displayed in Figure 1, fits a well-centered 800 km s-1 broad component plus a narrow, 160 km s-1 wide component to the Pa line, with comparable total fluxes. See Appendix A and Table 1 for details on the line fits. A small amount of excess emission appears in the fit residuals of Figure 1 on the blue side of the Pa line. This emission only amounts to 4% of the flux of the broad Gaussian component, which was not substantial enough to encourage a broad component fit that had any asymmetric quality (i.e., blue-shifted line center). Therefore, while this emission is real, it is of little importance in comparison to the bulk of the broad emission. Throughout this paper we refer to this 800 km s-1 emission feature as the “broad” component, though it does not represent a canonical broad line region. We simply use this term to indicate velocities larger than would be expected in ordinary galaxy kinematics, such as rotation.

The continuum morphology is presented in Figure 2, along with images of three different spectral ranges within the Pa line profile. Referring to the line peak at 2.06345m as the zero velocity reference, the three continuum-subtracted narrow band images correspond to central velocities of , 0, and km s-1, each 250 km s-1 wide. The narrow line image is more compact than the continuum, with characteristic FWHM values of 155 and 175, respectively. The line emission is also slightly elongated compared to the round continuum, with an ellipticity (major-to-minor axis ratio) of . The two images of the line wings are significantly more compact than either the continuum or narrow line Pa images, and are in fact consistent with the estimated 11 seeing limit at the time of observation. No significant difference in shape, size, or center can be distinguished between the red and blue line wing images, though they each exhibit an ellipticity of . The observed ellipticity could be the result of a slightly defocused, astigmatic telescope. Such a distortion would not noticeably distort the much larger continuum shape, and likewise would not fully account for the similar elongation of the narrow Pa image.
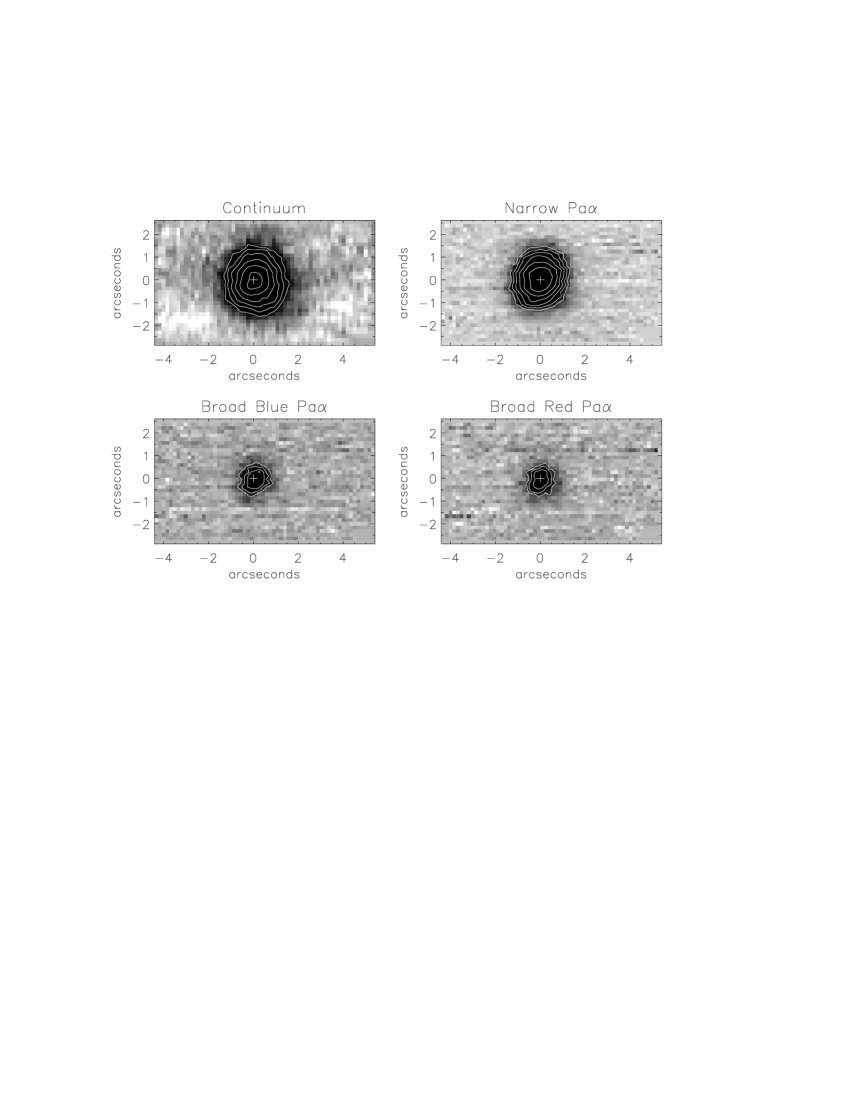
With confidence in the generic morphological character of the line emission, we may turn to a more detailed representation of the line extents by plotting the line emission FWHM as a function of wavelength. Figure 3 shows the measured spatial FWHM in both the and dimensions of the array, corresponding to the east–west and north–south directions. Each data point represents a measurement in the spatial plane at the location of a single spectral pixel. Because a spectral resolution element spans roughly four pixels, adjacent points in Figure 3 are not independent. The horizontal dotted lines delimit the range of atmospheric seeing measured in conjunction with the spectral observations, with a dashed line indicating the mean of these two values. The extended nature of the narrow line emission stands out in clear contrast to the seeing-limited extent of the line wings. The increase in width at the left edge of the plot coincides with the red side of the He I emission line. Due to the low signal-to-noise ratio in the region of the He I line, it was not possible to extend the plot data to shorter wavelengths. The continuum FWHM, measured beyond the line wings, is represented by the dashed line at top, and the continuum-subtracted line profile is plotted for convenient reference at bottom.

3.2 H2 1–0 S(3) and [Si VI] Emission Lines
The integral field spectrum of IRAS 083112459 at 2.15m contains the Br, H2 1–0 S(3), and [Si VI] emission lines at rest wavelengths of 1.94456m, 1.95702m, and 1.96287m, respectively. Figure 4 shows the one-dimensional spectrum, extracted from a 067067 square aperture centered on the continuum peak. The Br line is largely ignored here, as the Pa line is a far more effective probe of hydrogen recombination, and the combination of Br’s weakness plus its spectral proximity to Pa limits its usefulness as a measure of extinction. The 135 spatial extent of the Br line is perfectly consistent with the Pa extent, accounting for the seeing difference between the observations. The [Fe II] line at 1.9670 m, seen in some ULIRGs (Murphy et al., 1999), does not appear in the spectrum, though the Br feature from the atmospheric calibrator coincides with this same wavelength, making the presence of [Fe II] uncertain.

All lines in the H[Si VI] spectrum are spectrally resolved, with the H2 line resembling the atomic hydrogen lines in terms of observed line width. Though the H2 line is blended with the [Si VI] line, it is known to be symmetric by comparing with the H2 1–0 S(1) line profile (Murphy et al., 1999). The [Si VI] line is significantly broader than its neighboring lines, with a FWHM of km s-1. See Appendix A and Table 1 for more information on the functional fits to these lines.
Figure 5 displays the continuum and narrow band line images of IRAS 083112459 in H2 1–0 S(3) and [Si VI] emission. The continuum morphology appears different in Figures 2 and 5, mainly due to 20% better seeing and telescope focus in the latter (see Section 2). In Figure 5 the continuum appears to have a weak extension to the SW. The line images are clearly more compact than the continuum, and the near perfect symmetry of the [Si VI] emission suggests that the structure seen in the continuum is real, and simply not resolved in Figure 2. Indeed the central contours of the continuum image in Figure 5 appear much more symmetric than the outer contours. The line images are created in the same manner as those in Figure 2, with the spectral range encompassing points within km s-1 of the line center. The [Si VI] emission line is slightly more compact than the neighboring H2 line. An elliptical Gaussian fit to each of these line images yields FWHM sizes (average of major and minor axes) of 11 for H2 and 09 for [Si VI], with ellipticities (major-to-minor axis ratios) of 1.30 and 1.03, respectively. The H2 elongation appears to be real, with a position angle on the sky of —similar to the disk orientation implied by the rotation axis, discussed in Section 3.3.
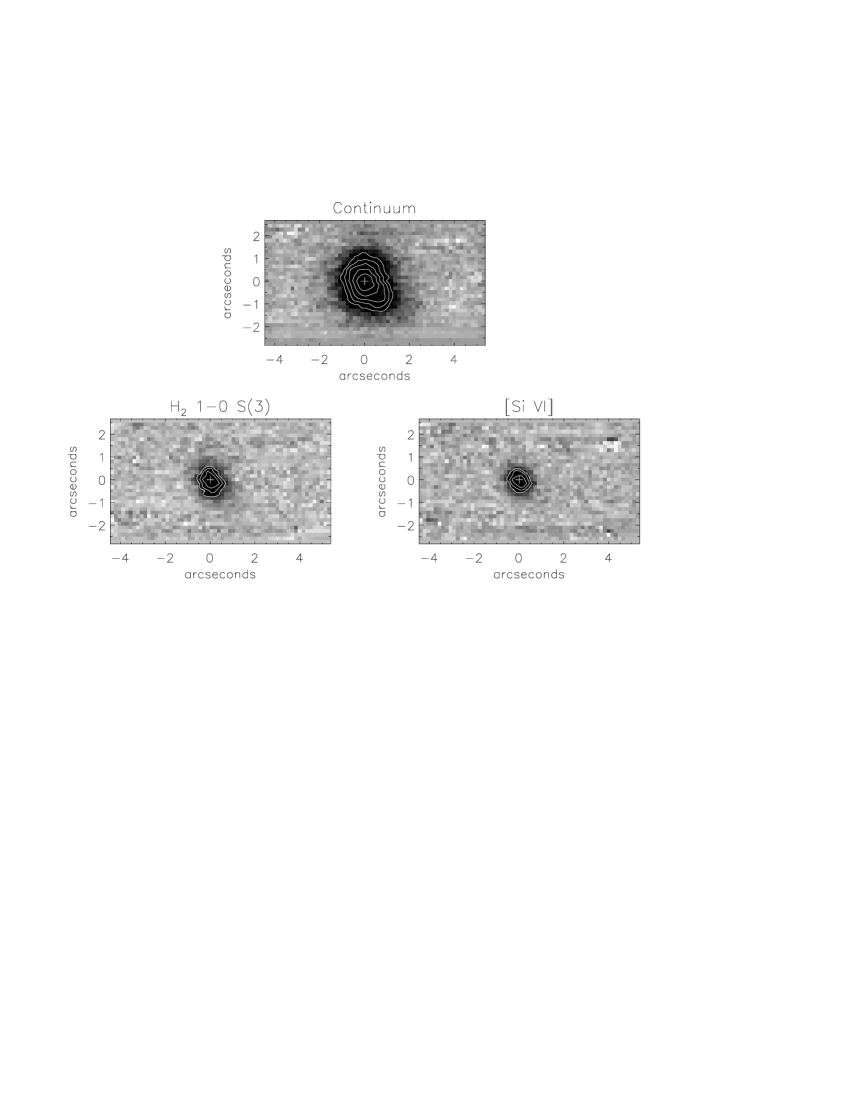
A more detailed look at the difference in spatial distribution between H2 and [Si VI] can be seen in Figure 6, which, like Figure 3, plots the spatial FWHM of the line distribution in the east–west and north–south directions as a function of wavelength. Referring to the line profile at the bottom of Figure 6, it is clear that throughout the wavelength range corresponding to the broad [Si VI] emission, both the and widths are consistent with the seeing limit, indicating that the entire [Si VI] emission line is spatially unresolved. The similarity in widths in the two orthogonal directions further demonstrates the symmetry of the PSF during the observation. On the short wavelength side of the [Si VI] emission, the spatial profile broadens, marking the location of the H2 line. Here, the north–south extent is larger than the east–west extent, owing to the elongated nature of the emission at a 30∘ position angle.

3.3 Rotation of H2 & Narrow Pa
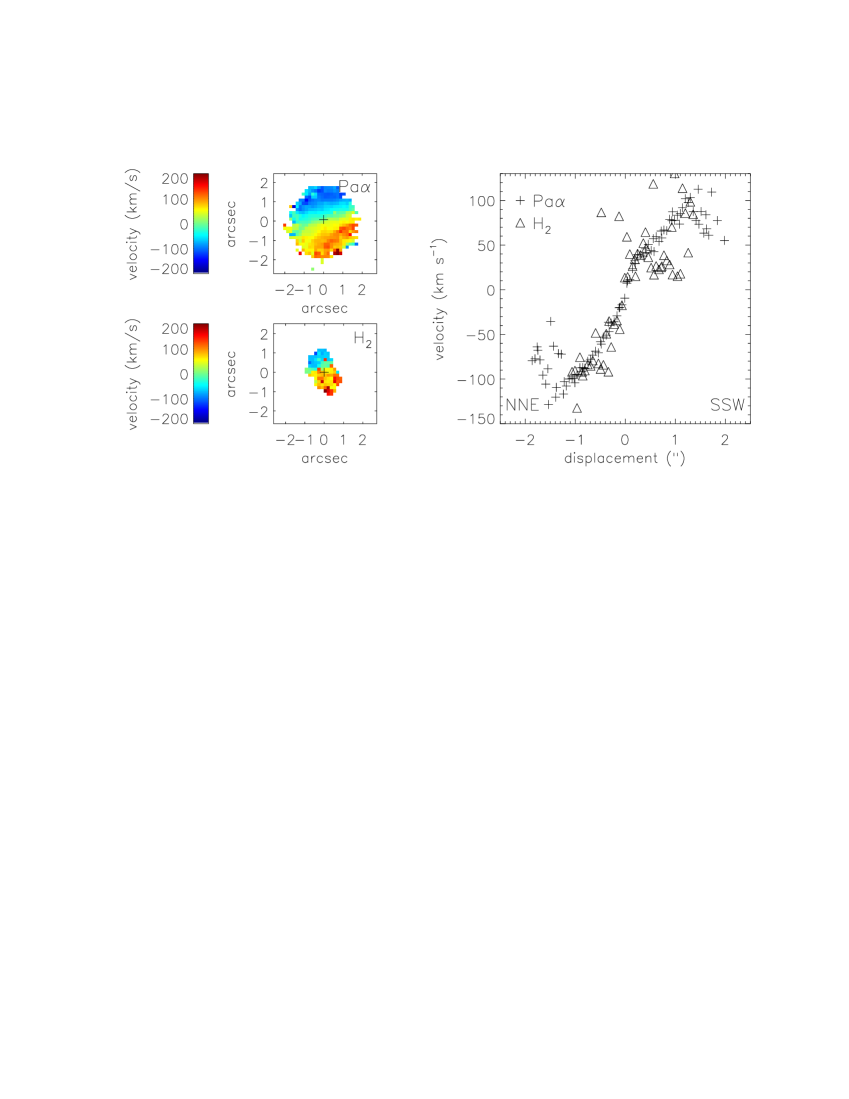
Taking advantage of the coexistence of two-dimensional spatial plus spectral information, we can construct velocity fields of the line emitting gas. At each spatial pixel, the wavelength of the peak line emission is computed, and converted to a velocity. Figure 7 displays the velocity fields obtained in this manner for IRAS 083112459 in both the Pa and H2 1–0 S(3) lines. Both lines exhibit a velocity structure indicative of pure rotation. The color scale is the same for both maps, through which it is seen that the rotation is not only aligned along the same axis for the two lines, but with roughly the same amplitude. The rotation axis is at a position angle of , implying a projected disk major axis of , consistent with the observed elongation observed for H2. Figure 7 also shows the rotation curves obtained for both lines, in a 067 wide aperture through the galaxy center at a 20∘ position angle. Though the molecular hydrogen data has much more scatter than does the Pa curve, it is clear that the two constituents—the narrow Pa and the H2 emission—share the same physical rotation.
4 Discussion
Combining visible light spectroscopic surveys of ULIRGs (e.g., Kim, Veilleux, & Sanders, 1998; Veilleux, Kim, & Sanders, 1999) with infrared observations (Veilleux, Sanders, & Kim, 1997, 1999), it is found that 20–25% of ULIRGs can be characterized as containing AGN. The visible studies generally utilize the [O III]/H line ratio as the primary diagnostic in differentiating Seyfert (AGN) galaxies from starburst-dominated galaxies, while infrared identification of AGN are generally based on the presence of broad atomic recombination lines, and occasionally of [Si VI]. ULIRGs are known to sometimes harbor galactic-scale superwinds (Heckman, Armus, & Miley, 1990), which could potentially contribute to the observed broad line wings and to [Si VI] emission through powerful shock excitation. The present integral field data for IRAS 083112459 argue for a simple picture of a compact AGN surrounded by a more diffuse starburst—at least some of which is occurring in a rotating disk around the nucleus. While massive outflows and expanding shells are present in some ULIRGs, they may not be ubiquitous. The PIFS data on IRAS 083112459 highlights the important role that integral field spectroscopy can play in untangling the dynamics and excitation of the circumnuclear gas in ULIRGs.
Without considering the contribution of the He I line to the Pa line profile, one might conclude that the apparently blue-asymmetric profile of Pa indicates the presence of outflow phenomena, as is often the case for asymmetric line profiles (e.g., Heckman, Armus, & Miley, 1990; Wang et al., 1997). Knowledge of the He I line on the blue side of Pa, with expectations on typical ULIRG line strengths (Murphy et al., 1999, 2000) allow us to understand the Pa profile as the combination of a symmetric Pa line mixed with a similarly shaped He I line. The Gaussian line fits give the He I line 4% of the total Pa flux—consistent with expectations from the ULIRG population (Murphy et al.). Perhaps the strongest evidence that the He I line is contributing to the total line profile comes from the observation of increased spatial extent coincident with the red side of the He I line, shown in Figure 3.
While we can not rule out the presence of a very compact nuclear outflow, the symmetry of the Pa line profile resulting from proper accounting of the He I flux, together with the fact that both sides of the profile’s broad wings are spatially unresolved ( pc) in the full two-dimensional sense, argue that the broad emission does not arise from an outflow, or wind, phenomenon. Additionally, the red and blue wing components show no relative displacement greater than the 005 level, or pc, further supporting this conclusion. If a wind is to account for the high-velocity Pa emission, the lack of significant extinction to the red emission ( mag based on line symmetry) must be explained, as must the fact that the physical scale is smaller than the size of the narrow line region, which is spatially resolved. We believe the broad emission arises from the near vicinity of an obscured AGN, and that this component is separate from the rotating, narrow emission discussed at the end of this section.
The presence of [Si VI] in the spectrum of IRAS 083112459 is a clear indicator of high energy processes at work in the galaxy. [Si VI] is not commonly seen in ULIRGs, even those exhibiting broad Pa emission (Murphy et al., 1999). Veilleux, Sanders, & Kim (1997, 1999) see evidence for [Si VI] in a few ULIRGs, though blending with the comparably strong H2 1–0 S(3) line prohibits accurate estimates of flux contributions. The [Si VI] emission in IRAS 083112459 measures in luminosity, uncorrected for extinction. This is among the most luminous [Si VI] emission line yet observed, although relative to the bolometric luminosity only slightly more luminous than that found in nearby Seyfert galaxies (Marconi et al., 1996). The [Si VI]-to-bolometric luminosity ratio for quasars is the same as that seen in IRAS 083112459, based on the template QSO spectrum in Murphy et al.
Main sequence stars are incapable of producing significant flux at 167 eV—the requirement for creating Si5+. Only ionizing radiation from an AGN or fast shocks can account for the [Si VI] emission (Contini & Viegas, 1992). It is difficult to differentiate between these excitation processes observationally, though a diagnostic utilizing the [Fe VII] m line was explored by Marconi et al. (1996), in which all instances of [Si VI] detections in Seyfert galaxies are attributed to photoionization.
The integral field data may contribute a clue to the nature of the [Si VI] excitation. The molecular hydrogen emission—often associated with collisional excitation—has a significantly different morphological character than the [Si VI] emission. Namely, the H2 line originates from a region roughly one kpc larger than that of [Si VI]. The underlying morphology of violent shocks in major mergers is not clearly understood. However, if the [Si VI] line was shock excited—perhaps tracing out a physical boundary along a shock front—then any molecular hydrogen excited by this same shock phenomenon would arise from the near vicinity of the shock front (Draine & McKee, 1993), thereby sharing similar spatial structure with the [Si VI] emission. Naturally, the very strong shocks capable of producing Si+5 would probably dissociate H2 molecules, but the precursor and post-shock mechanisms may be capable of producing significant H2 emission. In order for both the [Si VI] and H2 emission to be shock-excited requires two separate shock components with vastly different velocities and spatial scales. While we can in no way rule out this possibility with the current data, a simpler explanation has the [Si VI] emission originating from photoionization by a central AGN, with the H2 emission excited by other means.
Further differentiating the H2 distribution from that of [Si VI] is the fact that the H2 emission is extended along the direction of maximum velocity gradient—the inferred disk axis. A simple quadrature decomposition of the H2 13 FWHM ellipse with a 09 seeing disk yields an intrinsic aspect ratio of greater than 2:1, with a long axis extent of about 1.6 kpc. The rotation curve derived from the H2 emission is in complete agreement with that seen for Pa (Figure 7), suggesting that the narrow Pa and H2 emission arise from the same rotating disk. Similar observations of elongated molecular gas concentrations coincident with disk orientation and rotation are also seen in CO data of luminous infrared galaxies (Bryant & Scoville, 1999).
A picture emerges wherein both the H I and H2 narrow line emission arises from a rotating, star forming disk. Alternatives for production of the narrow line emission include X-ray photoionization of the disk from the central source, or photoionization of the gas from “precursor” radiation emanating from a powerful shock front. Both of these alternatives suffer from the same difficulty of requiring the ionizing radiation to penetrate almost 1 kpc through the disk in order to produce the large scale emission observed. If indeed star formation is occurring on a scale of kpc—as the H2 emission indicates—then IRAS 083112459 boasts star formation on a significantly larger scale than the 100–300 pc typically seen among ULIRGs in mid-infrared studies (Soifer et al., 2000).
If the narrow, rotating component of the Pa line is produced by young stars in a disk, the implied star formation rate (SFR) is yr-1, assuming an intrinsic HPa line flux ratio of 8.6 (Osterbrock, 1989, Case B with cm-3 and K) and a conversion between H luminosity and SFR following Kennicutt (1983). This estimate only includes the flux in the narrow Gaussian component to the Pa line, as portrayed in Figure 1. Of course, this conversion takes into account neither the extinction at Pa, nor the contribution of the central AGN to the narrow Pa line flux—both of which may be significant in this system, yet would affect our SFR estimate in opposite senses. Unpublished visible light spectra of IRAS 083112459 indicate an extinction to the disk of mag, comparing the Pa and H emission, leading to 0.16 mag of extinction at Pa. The AGN contribution may exceed this value, such that the above SFR estimate likely represents an upper limit.
If the entire far-infrared luminosity in IRAS 083112459 were attributable to star formation, then one may compute the expected total star formation rate by two methods. The first, from Scoville & Young (1983), puts a lower bound on the bolometric luminosity by assuming that the luminosity is dominated by stars converting protons to He via the CNO cycle, and that the rate of mass reduction is the rate at which stars are forming. This approach yields an expected SFR of yr-1. The other method, from Hunter et al. (1986), integrates the total stellar luminosity output to produce an estimated SFR of 650 yr-1, assuming all of the stellar luminosity is reprocessed into infrared emission ( in their model). Therefore, it is likely that either there is a large amount of star formation that remains obscured at 2 m, or that the hidden AGN is a substantial contributor to the infrared luminosity in this system. Given the presence of the unresolved, relatively strong [Si VI] emission we favor the latter interpretation, though with an estimated SFR of 75 yr-1, star formation could clearly contribute a significant portion of the total luminosity.
5 Conclusions
Integral field spectroscopy of the suspected AGN-powered ULIRG, IRAS 083112459, provides important constraints on the nature of the line emitting regions in this galaxy. The evidence presented can be reasonably explained by the presence of a bona-fide quasar embedded within a disk of star formation in the post-merger system. Both components contribute significantly to the total energy production in the galaxy. The salient points derived from these data are:
-
1.
The low velocity emission of Pa, along with H2, has been identified with a rotating disk of material with a diameter of kpc. It is likely that widespread star formation is responsible for the observed narrow line emission from this region.
-
2.
Moderately broad emission is seen in both Pa and [Si VI], with a projected FWHM km s-1. The broad emission is spatially unresolved ( pc) in both species. Both lines are spectrally symmetric, and there is no observed spatial offset between the red and blue wings of the broad Pa emission. Outflow phenomena are therefore unlikely to account for the high velocity emission, with an AGN being the preferred source of the [Si VI] and broad Pa emission.
Appendix A Functional Line Fits
Functional line fits have been applied to the extracted nuclear spectra of IRAS 083112459, and displayed in Figures 1 and 4. In each case, the continuum is fit with a linear function, and all lines except for Pa are fit with a single Gaussian profile. Attempting to fit Pa with a single Gaussian resulted in an obviously inadequate fit, but the resulting parameters are useful in fitting weaker atomic lines. The signal-to-noise ratio in the weaker lines does not justify the use of multiple component fits, yet their underlying profiles are expected to closely resemble Pa. The single-fit Pa has a central velocity of 30147 km s-1 and a FWHM of 415 km s-1; accounting for an instrumental resolution of 230 km s-1, this translates to an intrinsic line width of 345 km s-1. These numbers become the constraints used, where necessary, for the low ionization atomic lines.
The Pa spectrum contains three observable emission features, fit with four Gaussian profiles—two for Pa itself. It was found to be necessary to fix the He I line center and width according to the single-Gaussian Pa values as discussed above, leaving only the flux as a free parameter. The two components in the Pa line fit were unconstrained, and tended to repeatably settle to the same parameters despite factors of two modifications to the initial estimated values. The H2 1–0 S(4) line was constrained to share the 380 km s-1 line width found for the H2 1–0 S(3) line, as discussed below. The plot of fit residuals at the bottom of Figure 1 shows that the two-Gaussian fit for Pa does a passable job, but excess emission on the blue side well above the noise level demonstrates the approximate nature of the fitting business. For this reason, the separate components in the Pa fit are not to be taken as individual, distinct physical components, but rather as a tool for gaining a qualitative feel for the nature and symmetry of the broad emission. Table 1 lists the line properties and their fit parameters.
| Line | FWHMaaDeconvolved via simple quadrature by the instrument resolution of 230 km s-1 in the Pa spectrum, and 220 km s-1 in the HSi VI spectrum. | Equiv. Width | AperturebbRatio of flux within extraction aperture (i.e., spectra presented in Figures 1 and 4) to total line flux encompassing detected extent of line emission. For strong lines with spectrally distinct spatial characteristics (as determined from Figures 3 and 6), this ratio is measured directly from the datacube. | Total FluxccAperture-corrected flux scaled from line fit, within 5 arcsec aperture; 15% estimated error. | |
|---|---|---|---|---|---|
| (km s-1) | (km s-1) | (nm) | Correction | ( W m-2) | |
| He I | 0ddHeld fixed in line fit. | 339ddHeld fixed in line fit. | 0.78 | 0.21eeCalculated based on line FWHM and aperture size assuming symmetric Gaussian spatial profile. | 3.6 |
| Pa narrow | 156 | 9.3 | 0.19ffMeasured directly from datacube. | 45.9 | |
| broad | 16 | 779 | 12.0 | 0.30ffMeasured directly from datacube. | 34.1 |
| H2 1–0 S(4) | 7 | 376ddHeld fixed in line fit. | 0.48 | 0.26eeCalculated based on line FWHM and aperture size assuming symmetric Gaussian spatial profile. | 1.7 |
| Br | 297 | 0.97 | 0.15ffMeasured directly from datacube. | 3.5 | |
| H2 1–0 S(3) | 28 | 384 | 2.6 | 0.21ffMeasured directly from datacube. | 7.4 |
| Si VI | 1066 | 5.6 | 0.30ffMeasured directly from datacube. | 10.8 |
References
- Bryant & Scoville (1999) Bryant, P. M. & Scoville, N. Z. 1999, AJ, 117, 2632
- Contini & Viegas (1992) Contini, M. & Viegas, S. M. 1992, ApJ, 401, 481
- Draine & McKee (1993) Draine, B. T., & McKee, C. F. 1993, ARA&A, 31 373
- Genzel et al. (1998) Genzel, R., Lutz, D., Sturm, E., Egami, E. et al. 1998, ApJ, 498, 579
- Heckman, Armus, & Miley (1990) Heckman, T. M., Armus, L., & Miley, G. K. 1990, ApJS, 74, 833
- Hunter et al. (1986) Hunter, D. A., Gillett, F. C., Gallagher, J. S., Rice, W. L., & Low, F. J. 1986, ApJ, 303, 171
- Kennicutt (1983) Kennicutt, R. C. 1983, ApJ, 272, 54
- Kim, Veilleux, & Sanders (1998) Kim, D.-C., Veilleux, S., & Sanders, D. B. 1998, ApJ, 508, 627
- Kleinmann & Hall (1986) Kleinmann, S. G., & Hall, D. N. B. 1986, ApJS, 62, 501
- Lutz, Veilleux, & Genzel (1999) Lutz, D., Veilleux, S. & Genzel, R. 1999, ApJ, 517, L13
- Marconi et al. (1996) Marconi, A., van der Werf, P. P., Moorwood, A. F. M., & Oliva, E. 1996, A&A, 315, 335
- Murphy et al. (1996) Murphy, T.W., Armus, L., Matthews, K., Soifer, B. T., Mazzarella, J. M., Shupe, D. L., Strauss, M. A., & Neugebauer, G. 1996, AJ, 111, 1025
- Murphy et al. (1999) Murphy, T. W., Soifer, B. T., Matthews, K., Kiger, J. R., & Armus, L. 1999, ApJ, 525, L85
- Murphy, Matthews, & Soifer (1999) Murphy, T. W., Matthews, K., and Soifer, B. T. 1999, PASP, 111, 1176
- Murphy et al. (2000) Murphy, T. W., Soifer, B. T., Armus, L., Matthews, K., & Kiger, J. R. 2000, in preperation
- Oliva & Origlia (1992) Oliva, E., & Origlia, L. 1992, A&A, 254, 466
- Osterbrock (1989) Osterbrock, D. E. 1989, Astrophysics of Gaseous Nebulae and Active Galactic Nuclei (Mill Valley: University Science Books)
- Persson et al. (1998) Persson, S. E., Murphy, D. C., Krzemenski, W., Roth, M., & Reike, M. J. 1998, AJ, 116, 2475
- Rigopoulou et al. (1999) Rigopoulou, D., Spoon, H. W. W., Genzel, G., Lutz, D., Moorwood, A. F. M., & Tran, Q. D. 1999, AJ, 118, 2625
- Sanders et al. (1988) Sanders, D. B., Soifer, B. T., Elias, J. H., Neugebauer, G., Matthews, K. 1998, ApJ, 328, L35
- Scoville & Young (1983) Scoville, N. Z., & Young, J. S. 1983, ApJ, 265, 148
- Soifer et al. (2000) Soifer, B. T., Neugebauer, G., Matthews, K., Egami, E., et al. 2000, AJ, 119, 509
- Strauss et al. (1990) Strauss, M. A., Davis, M., Yahil, A., & Huchra, J. P. 1990, ApJ, 361, 49
- Strauss et al. (1992) Strauss, M. A., Huchra, J. P., Davis, M., Yahil, A., Fisher, K. B., & Tonry, J. 1992, ApJS, 83, 29
- Veilleux, Sanders, & Kim (1997) Veilleux, S., Sanders, D. B., & Kim, D. -C. 1997, ApJ, 484, 92
- Veilleux, Kim, & Sanders (1999) Veilleux, S., Kim, D. -C., & Sanders, D. B. 1999, ApJ, 522, 113
- Veilleux, Sanders, & Kim (1999) Veilleux, S., Sanders, D. B., & Kim, D. -C. 1999, ApJ, 522, 139
- Wang et al. (1997) Wang, J., Heckman, T. M., Weaver, K. A., & Armus, L. 1997, ApJ, 474, 659