150 keV Emission from PKS2149306 with BeppoSAX
Abstract
A BeppoSAX observation of the z=2.34 quasar PKS2149306 produced a strong signal in the high energy PDS instrument up to a maximum observed energy of nearly 50 keV, 150 keV in the quasar frame. The Beppo-SAX spectrum spans almost 3 decades (0.3150 keV, quasar frame) and shows an extremely hard (=0.40.05) X-ray spectrum above 3 keV (comparable to XJB the X-ray background slope), and either a softer (=1.0) low energy component, or an ionized absorber at zero redshift. No evidence is seen of an Fe-K emission line (EW167 eV at 6.5 keV quasar frame), a Compton hump (). A bremsstrahlung fit gives kT(rest)=46 keV, similar to the X-ray background value, and a high energy cut-off power law requires E120 keV (quasar frame).
The SED of PKS 2149306 shows two peaks at 1012±0.5Hz and 1021±1.0Hz (0.3 mm and 4 MeV), strongly resembling a low energy cutoff BL Lac object (LBL). The ratio of the two peaks shows an extreme Compton dominance (), as in flat spectrum radio quasars (FSRQs). The presence of an additional ‘optical/UV big bump’ component may provide photons that cool the jet, suppressing the radio emission.
keywords:
quasars – emission mechanisms - X-rays - Gamma-rays1 Introduction
High redshift quasars are of interest not only for their ‘record setting’ quality, but also because they can tell us about the formation of quasars and about conditions in the universe at early times (Turner 1991, Hamann & Ferland 1994). We should also be able to learn about the quasar emission processes by comparing the continua of quasars at low z with those of their cousins at the epoch at which the characteristic quasar luminosity peaks around z2 (Boyle et al. 1987). Since small changes in physical conditions can greatly alter the tails of particle energy distributions the extreme high energy continuum may be a particularly good place to look for evolutionary effects.
So far though X-ray spectra of high redshift quasars from ROSAT (Elvis et al., 1994a, Fiore et al., 1998a) and ASCA (Elvis et al., 1994b, Cappi et al., 1997) have been few, and of limited signal-to-noise. Even so they have begun to show redshift dependent features that challenge models and require further XJB investigation: low energy cut-offs were discovered with ROSAT (Elvis et al., 1994a), and appear to be intrinsic (Fiore et al., 1998a, Elvis et al., 1998) and related to ultraviolet absorbing outflows; no Compton reflection component has been seen in z1 quasars ( [90%], Elvis et al. 1994b, Nandra et al., 1995, Siebert et al., 1995, see also Williams et al (1992) for low z examples); nor is a 6.4 keV (rest frame) iron line required by the fits (EW20 eV [90%] Siebert et al. 1995; EW120 eV (90%) Elvis et al., 1994b). These properties differentiate high z quasars from typical low redshift Seyfert galaxies which have strong iron K-lines (EW=100-300 eV), and a strong Compton hump that requires half the sky (as seen from the X-ray source) to be covered with Compton-thick ‘cold’ material (=1, Nandra & Pounds 1994 and references therein). This suggests a different structure within high luminosity quasars.
We observed PKS2149306 as part of an AO1 GO program on BeppoSAX in order to examine these issues. At z=2 the Compton hump region is well within the BeppoSAX (Boella et al., 1997a) 1.3–10 keV Medium Energy Concentrator Spectrometer (MECS, Boella et al., 1997b) band, making a measurement feasible. Moreover the good sensitivity of the high energy Phoswich Detector System (PDS, FWHM=1.4 degrees, Frontera et al., 1997) on BeppoSAX allows the extension of the spectrum to energies (15–100 keV) where a Compton hump, bremsstrahlung and a power law can be more readily distinguished
PKS2149-306 is a z=2.34 flat spectrum (, where , NED), core-dominated 111 The 2.3 Ghz data of Morabito et al (1986) shows the source to be % compact on a 3mas scale (24 pc at z=2.34, =50 km s-1Mpc-1, =1), using the Parkes 2.7 Ghz total flux (Quiniento & Cersosimo 1993) as a comparison. radio-loud quasar with =17.9. PKS 2149–306 is extraordinarily bright in the ROSAT Sky Survey (fX=10-11 , Siebert et al., 1995, Brinkmann et al., 1995b, Schartel et al., 1996). Being bright, PKS2149306 also promised to give the best possible limits on high energy emission from quasars. Instead, it gave us a clear detection. We present here the BeppoSAX 0.1-130 keV data for PKS2149–306, along with the broad band radio to -ray spectral energy distribution (SED) of the quasar, and we compare these with recent Blazar models.
2 Observations and data analysis
BeppoSAX observed PKS2149306 from 1997 October 31 through 1997 November 1. The two imaging detectors - the 1.3-10 keV MECS and the 0.1-10 keV Low Energy Concentrator System (LECS, Parmar et al., 1997) - detected the quasar with high signal-to-noise at the center of the their field-of-view, at 0.105 ct/s and 0.05 ct/s respectively. (With exposures of 39,439 s and 17,862 s respectively.) Unexpectedly, the co-aligned Phoswich Detector System (PDS, Frontera et al., 1997) also detected a clear signal in its 15-100 keV bandpass of 0.26 ct/s (in an effective on-source exposure time of 16,676 s).
Standard data reduction was performed using the SAXDAS software package (1997). In particular, data are linearized and cleaned from Earth occultation periods and unwanted periods of high particle background (due to satellite passages through the South Atlantic Anomaly, SAA). Data from MECS units 2 and 3 were combined after gain equalization (unit 1 has been inoperative since 1997 May 7). The MECS and LECS pulse height spectra of PKS2149306 were extracted using 3 arcmin and 8 arcmin radius extraction regions, respectively. These radii maximize the signal-to-noise ratio below 1 keV in the LECS and above 2 keV in the MECS. Background was taken from high Galactic latitude blank fields using the same extraction regions as for the source regions. Although background is negligible for this source, we checked that the level of the background in regions surrounding the source is within 10% of that recorded in the same regions in the blank fields.
For the PDS the problem of accurate background subtraction is crucial since the PDS is a non-imaging detector. The PDS uses rocking collimators, one for each of two pairs of detectors, that switch positions quickly every 92 s so that one of the pairs is always pointed at the source, while the other is monitoring the background. The spectra from the four PDS crystals were summed together. The net source spectrum was then obtained by subtracting the ‘off-source’ background from the ‘on-source’ counts, scaling by the exposure time. The background in the equatorial BeppoSAX orbit varies by only 10-20%, thanks to shielding by the Earth’s particle belts (this was the main reason for selecting an equatorial orbit for BeppoSAX), and has an active anti-coincidence CsI(Na) particle shield (which is also used to detect gamma-ray bursts, Frontera et al., 1997). The main background variations are recorded just after the passages through the SAA. (The instrument is switched off while in the SAA). The first five minutes after SAA passages are excluded from the data analysis to allow an automatic gain control system to return the high voltages to their normal working value. This system keeps the pulse-height to energy scale constant to 1%. Using the rocking technique it is possible to take into account accurately the residual background variations. The magnitude of residual systematic errors in PDS spectra have been evaluated by Guainazzi and Matteuzzi (1997) at counts s-1, using deep observations of blank fields. Even if this maximum residual is subracted from the observed count rate, the signal to noise in this observation would remain . The source is detected at up to 40-50 keV, which is about 150 keV in the quasar rest frame.
The chance of finding a source in any given 2 sq.degree, the FWHM beam area of the PDS, is small. The HEAO-1 A4 all sky catalog (Levine et al., 1984) lists just 7 high Galactic latitude () sources in the 13-80 keV band, which is closely comparable to the PDS band, down to a flux of 210-10erg cm-2 s-1 (10mCrab). The PKS2149306 signal is 7.5 times fainter so, assuming a logN-logS slope of 1.5, we expect a chance coincidence rate of 1.4%, hence we believe the PDS signal does come from PKS2149–306. Our confidence in the identification of the PDS signal with PKS2149306 is increased further by the agreement to better than 10% of the normalizations of the PDS and MECS spectra and the similarity of their slopes (see next section). The EGRET source reported later is too far away to produce the PDS signal (see §4).
3 X-ray Spectral Fitting
Spectral fits were performed using the XSPEC 10.0 software package and versions of the response matrices made public on 1997 August 31. PI channels in MECS and LECS spectra are rebinned sampling the instrument resolution with the same number of channels at all energies and ensuring at least 20 counts per bin for the other. This guarantees the applicability of the method in determining the best fit parameters, since the distribution in each channel can be considered Gaussian.
Constant factors have been introduced in the model fitting in order to take into account the intercalibration systematics between instruments (BeppoSAX Cookbook, Fiore et al. 1998b). If we use the two MECS as reference instruments, then the LECS and PDS normalizations lie in the ranges 0.7-1.0 and 0.80-0.95 relative to the MECS, respectively.
The (observed frame) energy ranges used for the fits are: 0.1-4 keV for the LECS, 1.65-10.5 keV for the MECS, and 14-130 keV for the PDS. All the results given in table 1 are in the observed frame. Quasar frame values are given in the text where appropriate. Errors in Table 1 are 90 % confidence intervals for 1 interesting parameter. A simple power-law plus absorption model gives a reasonably good fit (Figure 1, Table 1), but with systematic deviations at low energies.
PKS2149–306 appears to have faded slightly over the three years between the obsevations: the 2-10 keV BeppoSAX flux, using the simple power law fit, is ( , 80% of the flux recorded in the 1994 October ASCA observation ( , Cappi et al 1997); and the monochromatic 2 keV BeppoSAX flux is ( keV-1, 76% of the 1990/1991 ROSAT RASS detection at ( keV-1 (Schartel et al. 1996).
The LECS shows a clear excess of counts below about 1 keV. This
soft excess seems in contradiction with the above Galactic NH
reported by Yaqoob et al. (1999). While variability in the
11 months (quasar frame) between the two observations is
possible, we also note that the low energy calibration of ASCA
is uncertain
222see:
http://heasarc.gsfc.nasa.gov/docs/asca/watchout.html
http://heasarc.gsfc.nasa.gov/docs/asca/cal_probs.html
, and we have more confidence in the Beppo-SAX value (Parmar et
al., 1997, Mineo et al., 2000). The presence of a low energy
excess means that the X-ray spectrum cannot give a reliable
Galactic absorption value, so we fix the absorbing column to the
Galactic 21 cm value (2.21020cm-2, Dickey &
Lockman 1990). The resulting energy spectral index,
, is extremely flat (c.f. Sakano et al. 1998,
Sambruna et al., 1999), although consistent with other high
redshift radio-loud quasars measured with ASCA from 2-10 keV ,
including PKS2149306 itself (=0.42
Cappi et al. 1997, 0.540.05 Yaqoob et al. 1999). This slope
is close to that of the X-ray background (Marshall et al., 1980)
although this class of quasar is too rare to integrate to the
X-ray background (see Elvis et al., 1994 and
references. therein).

A better fit can be had with a broken power-law to account for the slight upturn in the LECS spectrum below 1 keV (Table 1). In this case the steeper low energy slope is allowing the absorbing column to be free to vary, or fixing to its Galactic value. Both slopes are consistent with the ROSAT RASS value of (Schartel et al., 1996). The break energy is about 0.8 keV (observed frame, 2.7 keV quasar frame) in both cases. The high energy index is indistinguishable from the single power law index.
An apparent soft excess can also be generated though an absorption edge. In the quasar frame there is no sign of an ionized oxygen absorber, although at the energy of the deepest edges usually seen in low luminosity Seyfert galaxies (OVII and OVIII) fall at 0.22 and 0.26 keV (observer frame) respectively, close to the carbon edge (0.283 keV) produced by the LECS window, and are therefore affected by large systematic errors. A fit with an absorption edge and a single power law (Table 1) gives a good . The edge energy is 2.8 keV in the quasar frame, which has no ready interpretation, but the observed energy of 0.8 keV is consistent with either OVIII at or OVII at . The optical depth is large, , implying a total hydrogen column of a few cm-2 assuming cosmic metal abundances. This is about one hundred times what it is seen from the Galactic 21 cm line. The high energy slope in this fit is consistent with the value from the broken power law fit.
No line is detected around 2 keV, the redshifted iron K energy. The 90 % upper limits to the emission line equivalent width are 50 eV and 25 eV (observer’s frame; 167 eV and 84 eV quasar frame) for the 6.4 and 6.7 keV (quasar frame energies) iron K lines respectively. No line is seen at 5.1 keV (observer’s frame, 17 keV quasar frame) with a limit of 63 eV (90% confidence, observer’s frame), or 210 eV (quasar frame). This compares with the 298 eV (quasar frame, 90% errors for two interesting parameters) measurement reported at thsi unusual energy by Yaqoob et al. (1999) from 1994 October ASCA data.
The presence of a steeper low energy component or absorption edge has little effect on the high energy slope. Since this steeper component is only important in the LECS data we shall fit only the MECS and PDS data when investigating the high energy component, as we do in the rest of this section. This has the advantage of removing extra free parameters from the models, which usefully decreases the allowed parameter space.
To determine the overall 5-150 keV rest frame spectral shape we next fitted three XSPEC models: a power-law with an exponential cutoff (cutoffpl); a Compton reflection model for neutral reflectors (pexrav, Magdziarz & Zdziarski 1995); and a thermal bremsstrahlung model. In pexrav the redshift was frozen at the quasar redshift, the disk inclination was frozen at cos =0.45, and the cosmic abundances of Anders & Ebihara (1982) were assumed. For both models the local absorption was fixed at the Galactic value.
The Compton reflection model (Table 1) gave a 90% upper limit of 0.3 to the relative normalization, , of the reflected component 333, for an isotropic source above a flat infinite disk . This compares with typical values of 1.0 in Seyfert galaxies (Matt 1998). The cut-off power-law model (Table 1) requires the cut-off energy, Ec, to be 36 keV (90% confidence, observed frame), or 120 keV in the quasar frame. A bremsstrahlung fit gives a rest frame temperature of 46 keV (90% confidence, 1 interesting parameter), similar to that found in several z=3 radio-loud quasars in the 2-10 keV band with ASCA (Cappi et al., 1998). The Beppo-SAX result suggests that these temperatures are not merely an artifact of the upper energy limit of ASCA. As for ASCA, a bremsstrahlung model is a slightly worse fit than power-law models.
| model | additional | (dof) | |||
| parameters | |||||
| LECS, MECS, PDS fits | |||||
| Power law | 2.2 FIXED | 0.40.04 | – | – | 92.3(91) |
| Broken p.l. | 5.0 | 0.390.05 | 2.0 | 0.4 | 81.2(88) |
| Broken p.l. | 2.2 FIXED | 0.370.04 | 1.0 | 0.4 | 84.1(89) |
| P. L. + edge | 2.2 FIXED | 0.49 | – | 80.9(89) | |
| MECS, PDS fits | |||||
| Power law | 2.2 FIXED | 0.410.05 | – | – | 46.9(51) |
| Cut-off p.l. | 2.2 FIXED | 0.410.05 | – | 46.9(50) | |
| Compton refl. | 2.2 FIXED | 0.410.05 | – | 46.9(50) | |
| Bremsstrahlung | 2.2 FIXED | Tb=46 | – | – | 54.9(51) |
=break energy; =cut-off energy; =edge energy; =edge optical depth. a in cm-2; b in keV (quasar frame).
4 The Spectral Energy Distribution of PKS2149306
The addition of the broad band BeppoSAX spectrum from 0.1-50 keV (observed) allows the construction of a well-sampled Spectral Energy Distribution (SED) since PKS2149306 is already XJB well-observed at radio wavelengths, as shown by a NED 444The NASA/IPAC Extragalactic Database (NED) is operated by the Jet Propulsion Laboratory, California Institute of Technology, under contract with the National Aeronautics and Space Administration. search. Additional radio (Quiniento et al., 1993) and millimeter data (Steppe et al., 1988) fill out the long wavelength SED. Although PKS2149–306 has a flat radio spectrum, Cersosimo et al (1994) include PKS2149-306 as a candidate GigaHertz Peaked Spectrum (GPS) radio source, because of a mild curvature in its radio spectrum. PKS2149–306 also has low radio polarization (% at 1.4 MHz, Condon et al 1998). These two characteristics of GPS sources make it unlikely that such sources are dominated by beamed emission (O’Dea 1998). PKS 2149–306 though, has a Blazar-like SED and is unlikely to be a normal GPS source. The curvature in the PKS2149–306 radio spectrum may instead be due to the Compton downshifting of the originating electron spectrum, caused by a quenching UV source (see §5.1)
In the 100m to 0.1m range there are only IRAS Faint Source Survey (FSS, Moshir et al., 1989) upper limits and an optical spectrum (Wilkes et al., 1983, Wilkes 1997, private communication). These few data points though are importantly constraining. A search of the IRAS FSS noise plates gives 3 upper limits of 130 mJy, 96 mJy, 70 mJy and 600 mJy at 12m, 25m, 60m and 100m respectively. These limits are stable against small changes in position, so that a complex background (e.g. from Galactic cirrus) is not causing spurious values.
The Compton Gamma Ray Observatory EGRET summed phase 1-4 (1991–1995) exposure (9108 seconds) of the field shows no evidence for emission from PKS2149–306. A point source fit at the position of the quasar gives a 3 sigma upper limit of photons cm-2s-1 (30 MeV-3 GeV). We do recover the well known BL Lac object PKS 2155–304 (3EG J2158–3023, Hartman et al 2000) with a flux of ( photons cm-2s-1 (30 MeV-3 GeV). However, this source lies 1.7 deg from PKS2149–306, well outside the 99 percent confidence region of the EGRET source position. The PDS reaches a transmission of 50 percent at 0.7 degrees and is effectively at zero transmission by 1.7 degrees, so PKS 2155–304 cannot be the origin of the PDS signal.
The complete SED of PKS2149306 (Figure 2) shows how unusually hard and energetically dominant the hard X-ray, PDS, spectrum is when compared with normal radio-loud quasar SEDs (dot-dash curve, Elvis et al., 1994c). The whole Beppo-SAX spectrum lies an order of magnitude above the normal level for radio-loud quasars. The X-ray ‘soft excess’ (E3 keV in the quasar frame) appears to be a smooth continuation of the optical slope (with the caveat that an ionized absorber could fake an excess, see §3). In contrast the 3-150 keV slope is harder by . However, unless the source varies by a factor greater than 50 at 1 GeV, this hard X-ray MECS/PDS slope cannot extend up to EGRET energies, and must instead turn down somewhere between 120 keV (the quasar frame lower limit on a cut-off in the PDS spectrum) and 40 MeV.
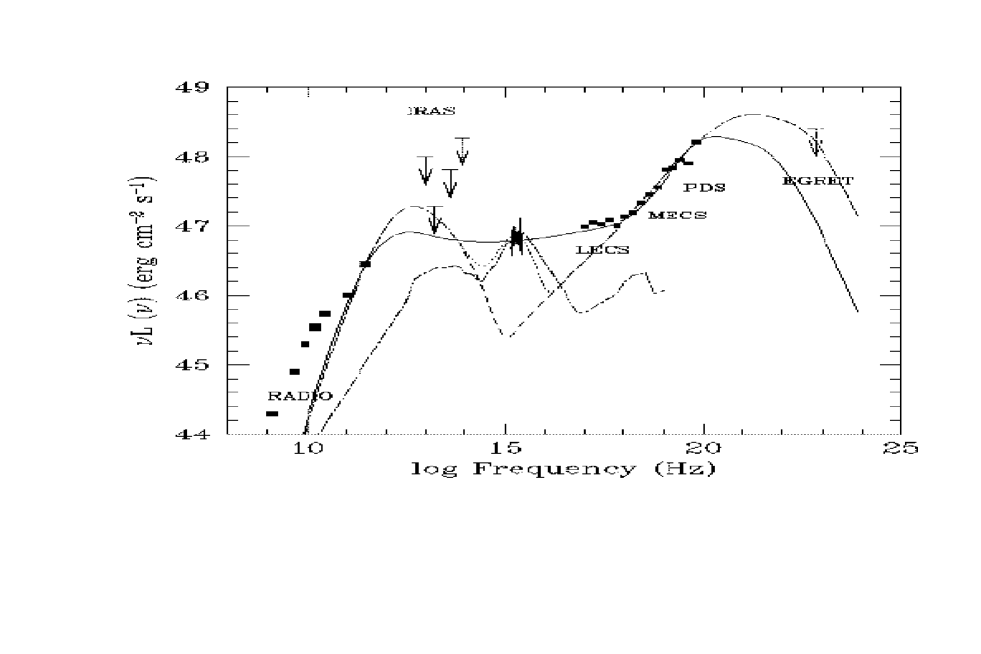
The SED of PKS 2149–306 (figure 2) seems to have two peaks at about and Hz. This ‘two peaks’ SED shape is similar to those of blazars (Fossati et al. 1998), strongly suggesting that the observed SED, outside the optical band, is dominated by a blazar continuum originating in a jet. The solid and dashed lines on the SED (figure 2) are spline interpolations of the highest frequency radio point and the X-ray data above 2 keV constrained not to exceed the IRAS and EGRET upper limits. The solid line is a spline fit close to one of the synchro-Compton models from Ghisellini et al.(1998). The lines are chosen to indicate the uncertainty in determining the ratio of the two peaks. (The lines are not fits to the data with a physical model, and are only useful to guide the eye.) The two spline curves define the ranges of the two peak frequencies and amplitudes. The -ray peak lies at a few MeV, 1021.0±1.0Hz, given the EGRET upper limit. The peak of the low frequency, radio-mm, peak is in the sub-millimeter range, Hz. These are both unusually low frequencies. The ratio of the two peak luminosities, the Compton dominance, (=, Ghisellini et al., 1998 ), is near the top of the known range.
5 Discussion
5.1 PKS 2149–306: An Extreme Compton Dominant Quasar
The detection of hard X-ray emission in PKS 2149306 reaches an energy some 4 times higher than detected in any other z1 quasar, except for the EGRET blazars. Moreover the X-ray to optical ratio of PKS 2149–306 is large, a factor 10 larger than normal for radio-loud quasars. Expressed as , the optical (2500Å) to X-ray (2 keV) slope, 0.81, is unusually small. Only two radio-loud quasars out of some 250 in the survey by Brinkmann et al. (1995a) have . Clearly there is something unusual about this quasar. The SED of PKS 2149306 is not that of a typical, unbeamed, AGN. The ‘two peaks’ SED shape has not been seen in ‘normal’ unbeamed quasars (Elvis et al., 1994, Mattox 1994), although existing limits are surprisingly weak), but is common in relativistically beamed objects, both BL Lacs and quasars (Padovani & Giommi 1996). The absence of reflection components (Compton hump and iron line) strongly limits the contribution to the observed flux of any Seyfert-like component, although these features are also weak in radio-quiet high luminosity quasars (Iwasawa & Taniguchi 1993).
The ‘two peaks’ SEDs of BL Lac objects have often been considered within the Synchrotron-Inverse Compton formalism (e.g. Sambruna, Maraschi & Urry 1996). In this scheme the low frequency (radio-mm) peak is the primary synchrotron peak, while the high frequency (-ray) peak comes from photons Inverse Compton scattered off the relativistic electrons. These scattered photons may be the synchrotron photons themselves (the self-Compton case), or from an external radiation source.
The frequencies at which the two components peak in space varies by 5 decades, which changes their observational appearance greatly. Fossati et al. (1998) and Ghisellini et al. (1998) have suggested that the Blazars form a single, smooth sequence with bolometric luminosity, from the lower luminosity High energy cut-off BL Lacs (HBL) to the Low energy cut-off BL Lacs (LBL) and then to the high luminosity flat spectrum radio quasars (FSRQs, Sambruna, Maraschi & Urry 1996, Padovani, Giommi & Fiore 1997). Unlike HBLs and LBLs, FSRQs show normal quasar emission in the optical/UV, i.e. both the broad emission lines and the ‘big bump’ blue continuum (with a presumed accretion disk origin) are seen. This optical emission can occasionally dominate, as it does in PKS2149–306. We conclude that PKS2149–306 is a high luminosity FSRQ.
In PKS2149–306 both SED peaks lie at the extreme lower ends of the distributions in the Fossati et al (1998) and Ghisellini et al (1998) samples. In the Fossati et al. scheme the ‘Compton dominance’ (the ratio between the luminosity in the two peaks) is inversely proportional to the frequency of the synchrotron peak, roughly to the one half power (Figure 3). PKS2149–306 fits this correlation, in that the large Compton dominance of PKS2149–306 agrees with low frequency position of the synchrotron peak of its SED.

Ghisellini et al. go on to suggest that a strong external radiation source, such as an accretion disk powered ‘optical/UV big bump’, provides a bath of cool photons that can efficiently drain energy from jet electrons by Compton scattering them to high energies. The low energy photons may come directly from the disk below (Dermer & Schlickeiser 1993) or from above or from the side (Siemiginowska & Elvis 1994, Sikora et al., 1996). This cooling makes inverse Compton losses dominate over synchrotron losses making the radio spectrum weak relative to the X-ray, so creating a ‘Compton dominant’ SED. PKS2149–306 seems to have a large ‘optical/UV big bump’, as expected in this model. Such large optical/UV big bumps are unusual, but not unprecedented in FSRQ (e.g. 3C273, Elvis et al., 1994c). An illustrative accretion disk spectrum, that roughly fits the big bump, is shown in figure 2 (, =0.1, from the tabulation given in Siemiginowska et al. 1995).
5.2 Low Energy Excess or Ionized Absorber?
The soft X-ray excess in PKS 2149–306 appears unusually strong (Figure 2). We noted in §3 that an absorption edge imprinted onto a single power law gives an equally good fit. Since ionized absorbers of the kind that could produce such an edge are common in AGN and blazars we must consider this interpretation on an equal footing with a ‘soft excess’ component.
An absorption edge can be more tightly constrained than a soft excess. A local z0 absorber is unlikely since no molecular cloud is nearby (Marscher 1988, Turner et al., 1995), nor is any low z galaxy seen on the STScI digitization of the sky surveys. An absorber associated with the quasar is more likely, X-ray absorption with a similar column density is common in radio-loud high redshift quasars (Elvis et al., 1994a, Cappi et al., 1997, Fiore et al., 1998a, Elvis et al., 1998), and there is evidence for high ionization oxygen absorbers of similar column density in some low redshift blazars (Canizares & Kruper 1984, Koenigl et al. 1995, Sambruna et al. 1997, Grandi et al. 1997, Cagnoni & Fruscione 2000), though these absorbers are not always seen (Chiappetti et al. 1999). Chandra high resolution grating spectra however do show comparable features (Fruscione et al. 2000, in preparation). To produce an apparent =0 absorber would require a coincidence of outflow velocity and cosmological redshift. A substantial ejection velocity, , is implied. In PKS 2155–304 the absorber has a suggested velocity of relative to the core (Canizares & Kruper 1984) so a high ejection velocity in PKS 2149–306 is not inconceivable. is larger than the seen in broad absorption line quasars (Turnshek 1988); it is much slower, though, than the velocities needed to explain superluminal radio sources (Zenzus 1997), although these may be pattern speeds rather than true expansion velocities. Only X-ray spectra with significantly better resolution can definitively identify absorption edges. Chandra grating observations are scheduled.
6 Conclusions
We have detected the z=2.34 quasar PKS2149306 up to 150 keV in its rest frame, using the PDS on BeppoSAX. This is some 4 times higher in energy than any other z1 quasar, except for the EGRET blazars. PKS 2149-306 is also an order of magnitude X-ray loud relative to the optical (=0.81). The 3 keV spectrum of PKS 2149–306, as for several other high redshift radio-loud quasars, is extremely hard (, kT=46 keV, observed frame), comparable to the X-ray background spectrum.
The PKS2149306 SED seems to show the two peaks typical of BL Lacertae objects, suggesting that the X-ray 1-100 keV observed emission is dominated by an inverse Compton component. Unusually the SED is strongly dominated by the -ray peak. A strong ‘big bump’ in the optical/ultraviolet seems to be present in PKS2149–306. Possibly, as suggested by Ghisellini et al. (1998), this bump is the source of the photons that cool the jet, suppressing the radio emission and creating the Compton dominated spectrum. This makes PKS2149306 an extreme example of the luminosity based one-parameter unification scheme of Ghisellini et al..
The low energy X-ray spectrum of PKS 2149–306 shows no absorption above the Galactic value, contrary to the ASCA 1994 data (Yaqoob et al. 1999), showing instead a soft excess. An absorption edge fits the data as well as a broken power-law. One interpretation of an absorption edge is an oxygen absorber with N1022cm-2, blueshifted from the quasar redshift and implying an ejection velocity, . Such an absorber would provide a link with absorbers in other high redshift quasars, and with the absorbers in some low z blazars. However, the data are ambiguous and higher spectral resolution observations are needed to check this result.
The Beppo-SAX data set strong limits on the X-ray reflection features: EW(Fe-K)15 eV (quasar frame) and for the Compton Hump.
Hard X-ray observations, as we hoped when initiating this project, do seem to select physically extreme objects.
Acknowledgements.
We thank Belinda Wilkes for providing a digital version of her optical spectrum of the quasar, Daryl Macomb for providing the EGRET upper limit, Seth Digel for the IRAS data, Gabriele Ghisselini for the data points in figure 3, and the referee for a careful reading that improved the paper. This work was supported in part by NASA contract NAS8-39073 (ASC), and NASA grants NAGW-2201 (LTSA) and NAGW- (ADP). This research has made use of data obtained through the High Energy Astrophysics Science Archive Research Center Online Service, provided by the NASA-Goddard Space Flight Center. This research has made use of the NASA/IPAC Extragalactic Database (NED) which is operated by the Jet Propulsion Laboratory, Caltech, under contract with the National Aeronautics and Space Administration Based on photographic data obtained using The UK Schmidt Telescope. The UK Schmidt Telescope was operated by the Royal Observatory Edinburgh, with funding from the UK Science and Engineering Research Council, until 1988 June, and thereafter by the Anglo-Australian Observatory. Original plate material is copyright (c) the Royal Observatory Edinburgh and the Anglo-Australian Observatory. The plates were processed into the present compressed digital form with their permission. The Digitized Sky Survey was produced at the Space Telescope Science Institute under US Government grant NAG W-2166.References
- (1) Anders E. & Ebihara M. 1982, Geochimica et Cosmochimica Acta, 46, 2263
- (2) BeppoSAX Cookbook, http://www.sdc.asi.it/software/cookbook/cross.html
- (3) Boella G. et al., 1997a, A&AS, 122, 299
- (4) Boella G. et al., 1997b, A&AS, 122, 327
- (5) Boyle B.J., Fong R., Shanks T., & Peterson B.A., 1987, MNRAS, 227, 717
- (6) Brinkmann W, Siebert J., Boller T. 1995a, A&A, 281, 355
- (7) Brinkmann W, Siebert J., Reich W., Fuerst E., Reich P., Voges W., Tuemper J., Wielebinski R., 1995b, A&A S, 109, 147
- (8) Cagnoni I. & Fruscione A. 1994, ApJ, submitted
- (9) Canizares C.R. & Kruper J., 1984, ApJ, 278, L99
- (10) Cappi M., Matsuoka M., Comastri A., Brinkmann W., Elvis M., Palumbo G.G.C., & Vignali C., 1997, ApJ, 478, 492
- (11) Chartas G., et al., 2000, in preparation
- (12) Chiappetti L. et al. 1999, ApJ, 521, 552
- (13) Cersosimo J.C. et al., 1994, ApJS, 95, 157
- (14) Condon J.J., Colton W.D., Greisen E.W., Yin Q.F., Perley R.A., Taylor G.B. & Broderick J.J. 1998, AJ, 115, 1693
- (15) Dermer C.D. & Schlickeiser R., 1993, ApJ, 416, 458
- (16) Dickey J. & Lockman F.J., 1990, ARAA, 28, 205
- (17) Elvis M., Fiore F., Wilkes B.J., McDowell J.C. & Bechtold J., 1994a, ApJ, 422, 60
- (18) Elvis M., Matsuoka M., Siemiginowska A., Fiore F., Mihara T., & Brinkmann W., 1994b, ApJL, 436, L55
- (19) Elvis M. et al., 1994c, ApJS, 95, 1
- (20) Elvis M., Fiore, F., Giommi P. & Padovani P., 1998, ApJ, 492, 91
- (21) Fiore F. Elvis M., Giommi P. & Padovani P., 1998, ApJ, 492, 79
- (22) Fiore F., Guainazzi M., Grandi P., 1998, SAX Data Center Technical Report.
- (23) Fossati G., Maraschi L., Celotti A., Comastri A., Ghisellini G. 1998, MNRAS, 299, 433
- (24) Frontera F. et al., 1997, A&AS, 112, 357
- (25) Fruscione A. et al., 2000, in preparation
- (26) Ghisellini G., Fossati G., Maraschi L., Celotti A., Comastri A., 1998, MNRAS 301, 451.
- (27) Grandi P. et al., 1997, A& A, 325, L17
- (28) Guainazzi M. & Matteuzzi A. 1997, BeppoSAX SDC report TR-011, ftp://www.sdc.asi.it/pub/sax/doc/reports/sdc-tr014.ps.gz
- (29) Hamann F. & Ferland G., 1993, ApJ, 418, 11
- (30) Hartman, R.C, et al., 1999, ApJS, in press
- (31) Iwasawa K. & Taniguchi Y., 1993, ApJ 413, L15.
- (32) Koenigl A. Kartje J.F., Bowyer. S, Kahn S.M. & Hwang, C.-Y. 1995 ApJ, 446, 598
- (33) Levine A.M. et al., 1984, ApJS, 54, 581
- (34) Magdziarz P. & Zdiarski A.A. 1995, MNRAS, 273, 837
- (35) Marscher A., 1988, ApJ, 334, 552
- (36) Marshall F., Boldt E.M., Holt S.S, Miller R.B., Mushotzky R.F., Rose, L.A., Rothschild R.E. & Serlemitsos P.J. 1980, ApJ, 235, 4
- (37) Matt G., 1998, astro-ph/9811053
- (38) Mattox, J.R., 1994, BAAS, 185, 8803
- (39) Mineo T., F.Fiore, Laor. A, Costantini. E, Comastri A., Elvis M., et al., A& A, 359, 471.
- (40) Morabito D.D., Niell A.E., Preston R.A., Linfield R.P., Wehrle A.E., & Faulkner J. 1986, AJ, 91, 1038
- (41) Moshir N. 1989, ‘IRAS Faint Source Survey, Explanatory Supplement version 1, [Pasadena: Infrared Processing and Analysis center] Cal. Tech.
- (42) Nandra K. & Pounds K.A. 1994, MNRAS, 268, 405
- (43) Nandra K., Fabian A.C., Brandt W.N., Kunieda, H., Matsuoka M., Mihara T., Ogasaka Y. & Terashima Y. 1995, MNRAS, 276, 1
- (44) O’Dea C.P., 1998, PASP, 110, 493.
- (45) Padovani P., Giommi P. 1996, MNRAS, 279, 526
- (46) Padovani P., Giommi P. & Fiore F., 1997, MNRAS, 284, 569
- (47) Parmar A. et al., 1997, A&AS, 112, 309
- (48) Quiniento Z. M. & Cersosimo J.C. 1993, A&AS, 97, 435
- (49) Sakano M., Koyama K., Tsuru T., Awaki H., Ueda Y., Takahashi T., Akiyama M., Ohta K. & Yamada T., 1998, ApJ, 505, 129
- (50) Sambruna, R.M., Maraschi L. & Urry C.M., 1996, ApJ, 463, 444
- (51) Sambruna, R M., George, I. M., Madejski, G., Urry, C. Megan, Turner, T. J., Weaver, K. A., Maraschi, L., Treves, A., 1997, ApJ, 483, 774.
- (52) Sambruna, R.M., Eracleous M. & Mushotzky R.F., 1999, ApJ, 526, 60
- (53) SAXDAS software package, release 1.3, Sept. 1997, http://www.sdc.asi.it/software/saxdas
- (54) Schartel N., Walter R., Fink H.H., Trümper J. 1996, A&A, 307, 33
- (55) Siebert J., Matsuoka M., Brinkmann W., Cappi M., Mihara T. & Takahashi T. 1996, A&A, 307, 8
- (56) Siemiginowska A. & Elvis M, 1994, ApJS, 92, 623.
- (57) Siemiginowska A., Kuhn O., Elvis M, Fiore F., McDowell J.C. & Wilkes B.J. 1995, ApJ, 454, 77
- (58) Sikora M., Sol H., Begelman M.C. & Madejski G.M., 1996, MNRAS, 280, 781
- (59) Steppe H., Salter C.J., Chini R., Kreysa E., Brumswig W. & Lobeto Perez J. 1988, A&AS, 75, 317
- (60) Turner T.J. et al., 1995, ApJ, 445, 660
- (61) Turner E.L. 1991, AJ, 101, 5
- (62) Turnshek D.A., 1988, in “Quasar Absorption Lines” eds. J.C. Blades, D. Turnshek & C. Norman, [CUP: Cambridge], p.17.
- (63) Williams O.R. et al., 1992, ApJ, 389, 157
- (64) Wilkes B.J., Wright A.E., Jauncey D.L. & Peterson B.A. 1983, Proc. ASA 5, 2
- (65) Wilkes B.J., 1997, private communication
- (66) Yaqoob T., George I.M., Nandra K., Turner T.J., Zobair S. & Serlemitsos P.J., 1998, ApJL, 525, L9
- (67) Yaqoob T., George I.M., Turner T.J., Nandra K., Ptak A. & Serlemitsos P.J., 1999, ApJL, 505, L87
- (68) Zenzus J.A., 1997, ARAA, 35, 607
- (69)