Detection of the thermal radio continuum emission from the G9.62+0.19-F Hot Core
Abstract
We present new high resolution and high sensitivity multi-frequency VLA radio continuum observations of the G9.62+0.19-F hot molecular core. We detect for the first time faint centimetric radio continuum emission at the position of the core. The centimetric continuum spectrum of the source is consistent with thermal emission from ionised gas. This is the first direct evidence that a newly born massive star is powering the G9.62+0.19-F hot core.
Key Words.:
Hii regions – ISM: individual G9.62+0.19 – Stars: formation1 Introduction
The formation of massive stars (M M⊙) has received growing attention in recent years, because of their important role in galactic evolution and the recognition that the majority of low-mass stars are formed together with high-mass stars in clusters (Clarke et al. C00 (2000)). One of the earliest manifestations of a newly born massive star is the appearance of an ultracompact (UC) HII region produced by the strong UV stellar radiation field. Since most massive stars are formed in clusters it is expected that other forming massive stars can be found close to UCHIIs. Indeed, NH3(4,4) high angular resolution observations of the molecular environment around UCHIIs (Cesaroni et al. Cea94 (1994)) revealed compact (size pc) and high temperature (T K) molecular clumps, so-called hot cores (HCs). HCs are indeed close, but not generally coincident with, the UCHII (Cesaroni et al. Cea94 (1994)). Given the high energy input required to maintain the HCs at the observed temperature, they are likely to be heated by young high mass stars. Since massive stars are expected to reach the main sequence while still accreting (Palla & Stahler PS93 (1993)), the lack of centimeter radio continuum emission at a few mJy level (e.g. Cesaroni et al. Cea94 (1994)) can be explained in terms of the confinement provided by the pressure of the hot molecular gas or by the infalling material accreting onto the massive star (e.g. de Pree et al. dPea95 (1995); Xie et al. Xea96 (1996); Walmsley Wmex (1995)). Either of these could effectively block the expansion of the ionised gas and make the radio continuum emission extremely compact, optically thick, and thus not easily detectable at cm wavelengths. HCs have been suggested to be sites of massive star formation (Cesaroni et al. Cea94 (1994); Kurtz et al. K00 (2000)). However, if a young massive star is indeed present inside the HC and is heating the molecular gas, a region of ionised gas should be present around the star, albeit compact. The cm radio emission from these objects should be optically thick and unresolved, with emission measures exceeding 108 cm-6 pc.
At a distance of 5.7 kpc (Hofner et al. Hea94 (1994)), G9.62+0.19 is a well known UCHII complex extensively studied at high resolution in the centimetric radio continuum (e.g. Garay et al. Gea93 (1993); Cesaroni et al. Cea94 (1994), among others). Several HII and UCHII regions in different evolutionary phases are present in the region, and there are indications of a possible age gradient going from the western, older, regions toward the eastern, younger, ones (Hofner et al. Hea94 (1994); Hea96 (1996); Testi et al. Tea98 (1998)). The centimetric radio continuum components have been designated from A to E (Garay et al. Gea93 (1993)). High resolution thermal molecular line and millimeter continuum observations revealed the presence of a HC in close coincidence with maser emission from several different molecules and located midway between radio components D and E. This new component, without detected centimeter continuum emission but associated to hot, 100 K, NH3, CH3CN and dust emission, was called F (Cesaroni et al. Cea94 (1994); Hofner et al. Hea94 (1994), Hea96 (1996)). Inside the molecular hot core a young massive star is presumed to be forming (Hofner et al. Hea96 (1996); Testi et al. Tea98 (1998)). If a young massive object is indeed present within the HC, an order-of-magnitude calculation suggests that the free-free radio continuum emission at 22 GHz should be optically thick with a total flux of – mJy and with a spatial extent of mas (Testi et al. Tea98 (1998)). We thus decided to perform VLA high sensitivity radio continuum observations to detect the faint centimetric free-free emission expected from such an object.
2 Observations
The G9.62+0.19 region was observed with the NRAO111The National Radio Astronomy Observatory is operated by Associated Universities, Inc., under contract with the National Science Foundation. VLA in the period May-June 1998 in the radio continuum at 3.6 and 1.3 cm, and on 26 January 1999 at 0.7 and 2 cm. The observing parameters are summarized in Table 1. The 2 cm dataset was obtained as a byproduct of the 0.7 cm experiment: all antennas equipped with Q-band receivers available at the time of the observations (12) were used at 0.7 cm while the remaining 15 were employed at 2 cm. At 0.7 cm we used a fast-switching observing cycle with 80 s on-source and 40 s on-calibrator (6∘ away), which resulted in a total switching cycle of 160 s and an efficiency of 50%. Hourly pointing sessions on the phase calibrator at 3.6 cm were used to correct for pointing drifts at 1.3 and 0.7 cm. 3C286 and/or 3C48 were observed to set the flux scale, which is expected to be accurate within 10–15%.
All data editing, calibration and imaging were performed within the AIPS software package. After standard flux and complex gain calibration, each dataset was self-calibrated using one phase-only and one phase and amplitude iteration. Consistency among maps at different frequencies provided an internal consistency check of our calibration procedures. Comparison of our fluxes with previous observations for component D provided an additional check. At 0.7 cm heavy data editing was required due to poor atmospheric conditions, only 12% of the entire dataset was used to produce the final maps, corresponding to the last 30 minutes of the run when atmospheric fluctuations settled. All maps presented here have been obtained using the AIPS IMAGR task with uniform weighting of the visibilities and with the ROBUST parameter set to zero. In all cases we imaged an area at least equal to the primary beam FWHM (see Table 1) to search for emission. No correction for primary beam attenuation has been applied at any frequency.
| Phase center | (J2000)=18h06m14.88s | |
|---|---|---|
| (J2000)=20∘31′40.8′′ | ||
| Parameter | 3.6 cm | 1.3 cm |
| Date | 12May/05Jun98 | 15/17Jun98 |
| Configuration | A/BnA | BnA |
| Time on source (hrs) | 0.5/1.0 | 2.0/4.0 |
| Freq./Bandwidth (GHz) | 8.46/40.05 | 22.46/40.05 |
| Flux cal 3C286/3C48 (Jy) | 5.18/– | 2.5/1.17 |
| Phase cal 1820254 (Jy) | 1.0 | 1.0 |
| Primary beam (FWHP) | 5.4 | 2′ |
| Largest structure | 10″ | 5″ |
| Syn. beam (FWHM;pa) | ;5∘ | ;64∘ |
| Noise (mJy/beam) | 0.018 | 0.062 |
| Parameter | 2 cm | 0.7 cm |
| Date | 26Jan99 | 26Jan99 |
| Configuration | C | C |
| Time on source (hrs) | 4.5 | 2.5 |
| Freq./Bandwidth (GHz) | 14.94/40.05 | 43.34/40.05 |
| Flux cal 3C286/3C48 (Jy) | 3.43/– | 1.45/0.57 |
| Phase cal 1820254 (Jy) | 0.87 | 0.86 |
| Primary beam (FWHP) | 3′ | 1′ |
| Largest structure | 30″ | 10″ |
| Syn. beam (FWHM;pa) | ;5∘ | ;33∘ |
| Noise (mJy/beam) | 0.1 | 1.0 |
3 Results
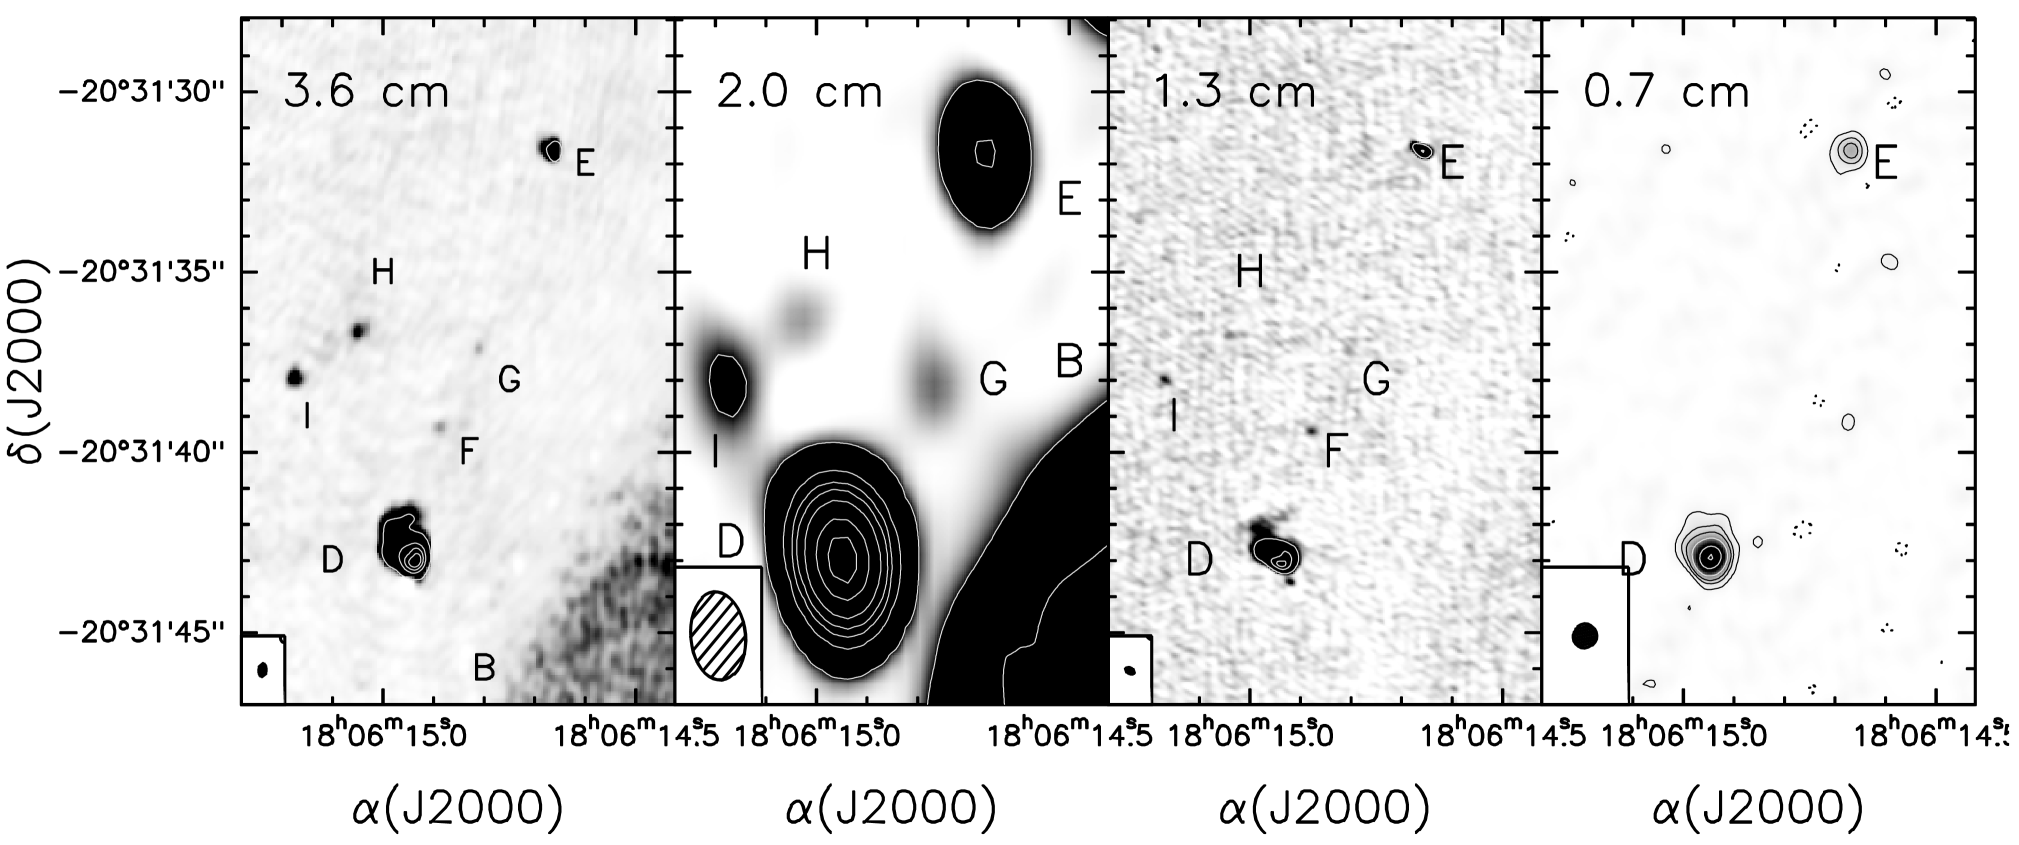
In Figure 1 we show our radio continuum images at 3.6, 2.0, 1.3, and 0.7 cm of the region containing the known cm-continuum components D–E (e.g. Cesaroni et al. Cea94 (1994)). Components A, B, and C (Garay et al. Gea93 (1993)) are detected in some of our maps depending on sensitivity and () coverage, and are outside the shown area.
In addition to all the previously known cm-continuum components, at 3.6 and 1.3 cm we detect four additional sources, labelled F to I, all above the 8 level of mJy/beam at 3.6 cm. At 2.0 cm only component F is not detected. In Table 2, 3.6 cm peak positions and integrated fluxes or upper limits at each frequency for each of the newly detected radio continuum components are reported; all the newly detected sources are unresolved by our synthesised beams. A detailed study of all the detected sources goes beyond the scope of the present letter and will be presented in a forthcoming paper.
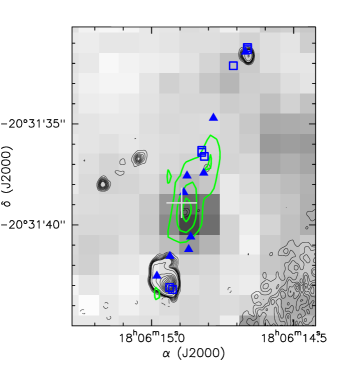
In Figure 2 we show the position of the H2O and OH masers (Forster & Caswell FC89 (1989); Hofner & Churchwell HC96 (1996)), and of the mm-continuum component F (Hofner et al. Hea96 (1996)) and our 3.6 cm (thin contours) and the thermal NH3(5,5) (thick contours, Hofner et al. Hea94 (1994)) maps overlaid on the 2.2 m near infrared image from Testi et al. (Tea98 (1998)). Within the astrometric uncertainties (1″ for the NIR data, 0.2″ for all the other data), the newly discovered cm-continuum source called F in Table 2 is coincident with the NH3(5,5) HC, the mm-continuum and the NIR source.
| (J2000) | (J2000) | F3.6cm | F2.0cm | F1.3cm | F0.7cm | |
|---|---|---|---|---|---|---|
| 18h06m | 20∘31′ | (mJy) | (mJy) | (mJy) | (mJy) | |
| F | 14.884 | 3937 | 0.22 | 0.5 | 0.62 | 3 |
| G | 14.805 | 3717 | 0.15 | 0.7a | 0.39 | 3 |
| H | 15.047 | 3672 | 0.98 | 0.4 | 0.36 | 3 |
| I | 15.172 | 3797 | 1.0 | 1.6 | 0.8 | 3 |
a) The 2 cm position of source G is not exactly coincident with that measured at 3.6 and 1.3 cm; the faint source is very close to bright and extended sources, the flux cited is thus highly uncertain due to possible imaging artifacts. Only higher angular resolution observations at 2 cm will offer a more accurate position and flux.
The HC and mm-component F located between the cm-continuum sources D and E was the primary target of our observations. We detected source F at 3.6 and 1.3 cm and set upper limits at 2.0 and 0.7 cm. In Figure 3 we show the radio continuum spectrum of source F. Data from the present work are presented as filled circles, while the open circle is from Cesaroni et al. (Cea94 (1994)), and the open square from Hofner et al. (Hea96 (1996)).

4 Discussion and Conclusions
The primary goal of our new VLA observations was the detection of radio continuum emission from the mm-component and NIR source F, as predicted by simple considerations in the case that a massive young stellar object is hidden within and is heating the HC (Testi et al. Tea98 (1998)). As shown in the previous section, one of our newly detected cm-continuum sources is coincident with the HC. In Fig. 3 we show the radio continuum spectrum of the HC. The HC emission can be well fitted by a two component model: free-free emission from ionised gas plus optically thin thermal dust emission at mm-wavelengths. The presence of ionised gas requires a continuum source of energy either in the form of a UV photoionization field or collisional ionisation. The detection of warm dust is consistent with the presence of a very young massive star, as implied also by the molecular gas observations (Cesaroni et al. Cea94 (1994); Hofner et al. Hea96 (1996)).
The ionised gas could be distributed either within a very compact ( pc) spherical homogeneous UCHII with EM310, or in a spherical wind (or density gradient) with F (Panagia & Felli PF75 (1975)), in either case the Lyman photon supply rate could be provided by a zero age main sequence star earlier than B1-B1.5 (Panagia P73 (1973)). This is in agreement with independent estimates of the expected spectral type derived from the molecular and infrared observations (O9-B0.5; Hofner et al. Hea96 (1996); Testi et al. Tea98 (1998)). The optically thin thermal dust emission requires a dust emissivity index in the range =1.5-2.0.
Only two other HCs have been detected in the cm continuum W3(H2O) (Reid et al. Rea95 (1995); Wilner et al. Wea99 (1999)) and IRAS 201264104 (Hofner et al. Hea99 (1999)). In the first case the radio emission is non-thermal from a synchrotron jet, thus no constraint can be obtained on the nature of the central (proto-)star. IRAS 201264104 has been detected at one frequency only in the cm continuum, and the mm spectrum is consistent with pure dust emission, while the cm emission is most probably due to a jet, the exact nature of which has not been firmly established yet. In the case of G9.62+0.19-F the thermal origin of the emission is confirmed by the radio spectral index constraint. The source is unresolved in our 200 mas ( AU) beam, while the two jets observed in the other cores, scaled to the distance of G9.62+0.19, would have been marginally resolved by our observations. Nevertheless, the possibility of a thermal jet cannot be completely ruled out.
An alternative interpretation for HCs is that they could be molecular clumps that are heated from the outside by a nearby star. This scenario is unlikely on theoretical grounds (Kaufman, Hollenbach and Tielens KHT98 (1998)) and the radial temperature profiles which were measured for three different HCs by Cesaroni et al. (Cea98 (1998)) indicate internal heating in those cases. In the case of G9.62+0.19–F, our data provide plausible (but not decisive) arguments for internal heating. First, the continuum source and the peak of the molecular gas as given by NH3(5,5) coincide to very high accuracy (better than ). This would not necessarily be the case for external heating by an unrelated star outside the HC. Second, the measured brightness temperature of the continuum of K, together with the indication of appreciable continuum optical depth implies a very small linear size of the emitting region of about AU. Thus, even if the object that is ionising source F is external, it must be very nearby because the fraction of ionising photons emitted into the solid angle subtended by component F scales as , where is the distance to the illuminating source and the clump size of 120 AU. For instance, at a distance of AU the required ZAMS spectral type of the illuminating star would be O9.5 and it is very unlikely that the effects of such a star on the surrounding matter would remain undetected.
In summary, the presence of unresolved, optically thick, thermal free-free emission is strong direct evidence for a newly born massive star within the G9.62+0.19-F HC. Thus, even within this complex cluster of UCHII regions, the heating of the hot molecular gas within the HC is most probably produced by an embedded young massive star. This is consistent with the idea that the HC phase is an evolutionary phase of young massive stars preceeding the formation of an UCHII. However, in order to make a firm statement in this respect, a larger sample of HCs should be observed at several frequencies in the cm radio continuum at high resolution and sensitivity.
Acknowledgements.
We thank Riccardo Cesaroni, Marcello Felli and the referee, Todd Hunter, for very useful comments and stimulating discussion, and Barry Clark for nice scheduling at the VLA. LT was partially supported by NASA Origins of the Solar System program through grant NAGW-4030.References
- (1) Cesaroni R., Churchwell E., Hofner P., Walmsley C.M., Kurtz S., 1994, A&A 288, 903
- (2) Cesaroni R., Hofner P., Walmsley C.M., Churchwell E., 1998, A&A 331, 709
- (3) Clarke C.J., Bonnell I.A., & Hillenbrand L.A. 2000, in Protostars and Planets IV, eds. V. Mannings, A. Boss & S.S. Russell (Tucson: University of Arizona Press), in press
- (4) Forster J.R. & Caswell J.L., 1989, A&A 213, 339
- (5) Garay G., Rodríguez L.F., Moran J.M., Churchwell E. 1993, ApJ 418, 368
- (6) Hofner P., Cesaroni R., Rodriguez L.F., Martí J. 1999, A&A 345, L43
- (7) Hofner P., & Churchwell E., 1996, A&AS 120, 283
- (8) Hofner P., Kurtz S., Churchwell E., Walmsley C.M., Cesaroni R., 1994, ApJ 429, L85
- (9) Hofner P., Kurtz S., Churchwell E., Walmsley C.M., Cesaroni R., 1996, ApJ 460, 359
- (10) Kaufman M.J., Hollenbach D.J., & Tielens A.G.G.M., 1998, ApJ 497, 276
- (11) Kurtz S., Cesaroni R., Churchwell E., Hofner P., Walmsley C.M. 2000, in Protostars and Planets IV, eds. V. Mannings, A. Boss, & S.S. Russell (Tucson: Univ. of Arizona Press), in press
- (12) Palla F., & Stahler S.W. 1993, ApJ 418, 414
- (13) Panagia N. 1973, AJ 78, 9
- (14) Panagia N., & Felli M. 1975, A&A 39, 1
- (15) de Pree C.G., Rodríguez L.F., & Goss W.M., 1995, Rev. Mex. de Astron. y Astrofis. 31, 39
- (16) Reid M.J., Argon A.L., Masson C.R., Menten K.M., Moran J.M. 1995, ApJ 443, 238
- (17) Testi L., Felli M., Persi P., Roth M., 1998, A&A 329, 233
- (18) Walmsley M. 1995, Rev. Mex. de Astron. y Astrofis., Ser. Conf. 1, 137
- (19) Wilner D.J., Reid M.J., & Menten K.M. 1999, ApJ 513, 775
- (20) Xie T., Mundy L.G., Vogel S.N., Hofner P. 1996, ApJ 473, L131