The Multiband Photometry of the
GRB Host Galaxies
V. V. Sokolov, T. A. Fatkhullin, V. N. Komarova
Special Astrophysical Observatory of R.A.S.,
Karachai-Cherkessia, Nizhnij Arkhyz, 369167 Russia
Email: sokolov@sao.ru, timur@sao.ru, vkom@sao.ru
We present photometric multiband spectral energy distributions for the GRB host galaxies: GRB 971214, GRB 970508, GRB 980613, GRB 980703 and GRB 990123 obtained with the 6-m telescope of SAO RAS. Using SEDs for the starburst galaxies, we made estimates of K-correction values and estimated the absolute magnitudes of the GRB host galaxies within the range of cosmological parameters. The comparison of the broad band spectra of these galaxies with the spectra of galaxies of different morphological types (Connolly et al, 1995, AJ, 110, 1071) shows that the GRB host galaxies are best fitted by the spectral properties of S2-S5 averaged SEDs of starburst galaxies.
Observations and data reduction
The observations of the GRB host galaxies were performed using primary focus CCD photometer of the 6m telescope of SAO RAS during July-August 1998 for the GRB 971214, GRB 970508, GRB 980613 and GRB 980703 host galaxies, July 1999 for the GRB 990123 host galaxy and March-April 2000 for the GRB 991208 and GRB 000301C host galaxies. It was carried out with standard (Johnson-Kron-Cousins) photometric system. Using the Landolt (Landolt, 1992) standard field, the photometric calibrations were performed. Using the Galactic extinction curve from Cardelli, Clayton & Mathis 1989, we obtained values of the foreground extinction. Tables 1 and 2 present the dereddened magnitudes and fluxes of the host galaxies instead of the uncorrected for Galactic extinction magnitudes of the GRB 980703 and GRB 990123 host galaxies are presented in Sokolov et al. 2000.
| Host | Date UT | Band | Exp. | Dereddened | Seeing | spectrum |
|---|---|---|---|---|---|---|
| (s) | magnitude | |||||
| GRB 971214 | 24.85 Jul. 1998 | 600 | emission host+OT (z=3.42) | |||
| 24.84 Jul. | 600 | (Kulkarni et al. 1998) | ||||
| GRB 970508 | 21.74 Aug. 1998 | 4200 | emission host+OT (z=0.835) | |||
| 23.95 Jul. 1998 | 2000 | (Metzger et al. 1997, | ||||
| 21.74 Aug. | 3000 | Bloom et al. 1998b) | ||||
| 23.95 Jul. | 2000 | |||||
| GRB 980613 | 24.80 Jul. 1998 | 700 | emission host (z=1.096) | |||
| 24.82 Jul. | 600 | (Djorgovski et al. GCN 189) | ||||
| 23.00 Jul. | 1800 | |||||
| GRB 980703 | 24.05 Jul. 1998 | 480 | emission host+OT (z=0.966) | |||
| 24.06 Jul. | 320 | (Djorgovski et al. 1998) | ||||
| 24.06 Jul. | 300 | |||||
| 24.07 Jul. | 360 | |||||
| GRB 990123 | 8.85 Jul. 1999 | 600 | absorbtion host+OT (z=1.6) | |||
| 8.86 Jul. | 600 | (Kelson et al. 1999, | ||||
| 8.84 Jul. | 600 | Hjorth et al. 1999) | ||||
| 8.87 Jul. | 600 | |||||
| GRB 991208 | 31.90 March 2000 | 1795 | emission host+OT | |||
| 31.84 March | 1490 | (z=0.70630.0017) | ||||
| 31.96 March | 1260 | (Dodonov et al. GCN #475) | ||||
| 31.87 March | 360 | |||||
| GRB 000301C | 01.04 April 2000 | 1500 | absorbtion host+OT (z=2.0335) | |||
| 01.06 April | 1200 | (M. Castro et al., GCN #605) | ||||
| 01.00 April | 900 | |||||
| 01.01 April | 900 |
| Host galaxy | Band | , | |
|---|---|---|---|
| Jy | |||
| GRB 971214 | |||
| GRB 970508 | |||
| GRB 980613 | |||
| GRB 980703 | |||
| GRB 990123 | |||
| GRB 991208 | |||
Cosmological models
Here we use three Friedman cosmological models:
For these models the relation is valid, where , , and . Here , , , and are density, cosmological constant, curvature constant, and radius of curvature, respectively, and “0” denotes the present epoch.
Comparision photometry with spectra
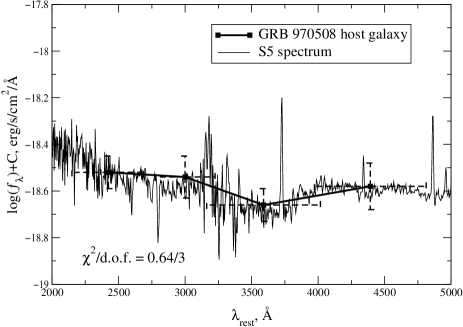
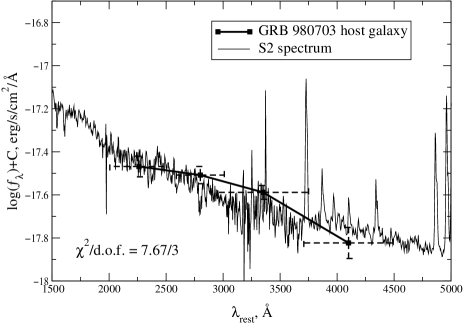
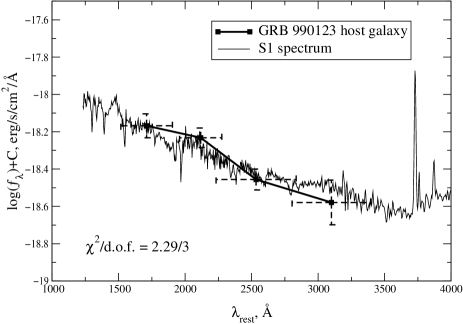
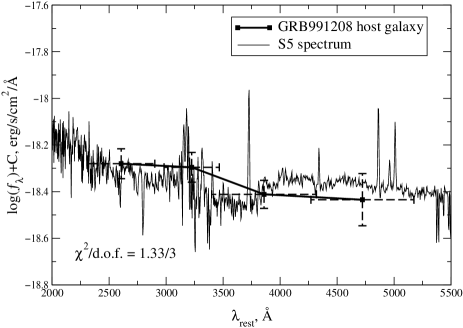
It would be interestingly to compare our broadband photometry to spectra of the host galaxies. Figures 1 and 2 present this comparision.


Comparision with local starburst galaxies
To compare our broad band spectra we have used the S1, S2, S3, S4, S5, S6 averaged spectral energy distrubutions (SEDs) for starburst galaxies from Calzetti et al. (1994). The spectra of starburst were grouped according to increasing values of the color excess : from S1, with to S6, with . It should be noted that this SEDs are not observed but are the templates that have been constructed using real observed starburst SEDs up to a redshift of (Connolly et al. 1995).
The fluxes of starburst SEDs have been convolved with sensitivity functions of the filters (sentivity functions have been used from Bessel, 1990) and the derived values was compared to our observed fluxes. For each SED the was calculated. The values of the was calculated in follow way:
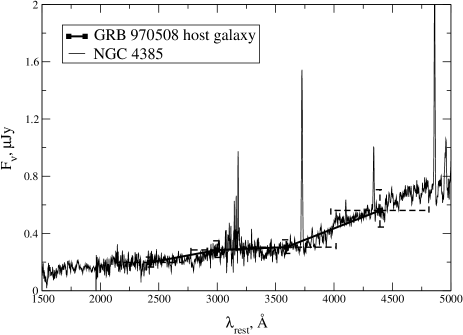
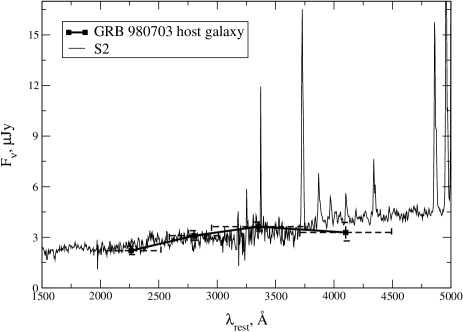
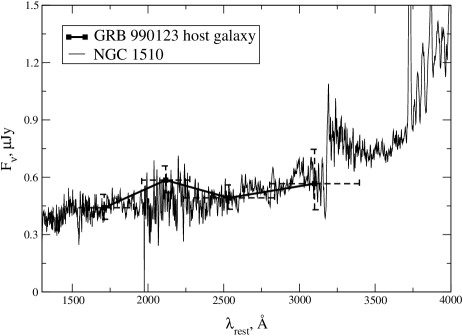
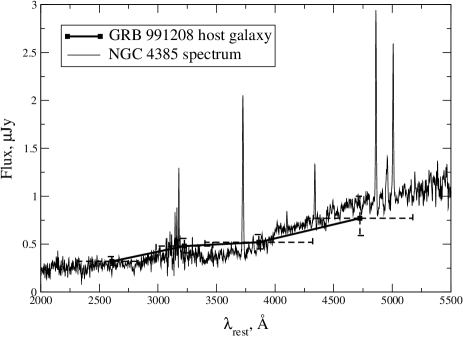
Here denote the filters (), is the flux of the GRB host galaxies in the filter , is the convolved with filter flux of the template SED on effective wavelength of filter , is the error of flux of the GRB host galaxy in filter and is the normalization coefficient. The definition of group of the starburst allows us to compare our broadband spectra to SEDs of real galaxies. Table 3 from Calzetti et al. (1994) was used to select real galaxies. Figures 3, 4, 5 and 6 present comparision of the photometry with average starburst and real galaxy SEDs.
K-correction and absolute magnitudes
According to the our definitions of spectral types of host galaxies we can to estimate the K-correction. Using the definition of the K-correction (see Oke & Sandage, 1968):
| (1) |
and SEDs from Connolly et al. (1995) estimates of K-correction for the band are: for the GRB 970508 host galaxy, for the GRB 980703 host galaxy, for the GRB 990123 host galaxy and for the GRB 991208. This estimates allow us to derive the absolute magnitudes of the host galaxies. The absolute magnitude in filter of the source can be calculated from magnitude-redshift relation:
| (2) |
where is the observed magnitude in filter , is the K-correction at redshift , is the luminosity distance. Using the magnitudes from Table 1 and the K-correction given above for cosmological models (A), (B), (C) we yield:
for the GRB 970508 host galaxy,
for the GRB 980703 host galaxy,
for the GRB 990123 host galaxy and
for the GRB 991208 host galaxy.
In the case of the GRB 970508 () and GRB 991208 (z=0.7063) host galaxies the band roughly correspond to the band in rest frame. This allow us to calculate directly from Eq. (1) the value of the K-correction for -magnitude, replacing with . We derived: and for the GRB 970508 and GRB 991208 host galaxies respectively. Then absolute -magnitudes of the host galaxies are:
for the GRB 970508 host galaxy and
for the GRB 991208 host galaxy.
Conclusions
We presented the multiband photometry of the seven GRB host galaxies. It should be noted that observations were carried out with one instrument and in one photometric system. To solve the progenitors problem we obviously need the statistics of photometric and spectroscopic properties of the host galaxies. Our photometry of the GRB 970508, GRB 980703, GRB 990123 and GRB 991208 hosts has shown that the broadband spectra are best fitted by starburst spectral energy distributions. Moreover, there is evidence showing that GRBs spatially coincident with a bright star-forming region (Bloom et al. 1999). Probably, GRBs are associated with young stellar population what can be an evidence of SNe—GRBs connection.
References
- [1] Bessel M. S., 1990, PASP, 102, 1181
- [2] Bloom J. S., Frail D. A., Kulkarni S. R., Djorgovski S. G., Halpern J. P., Marzke R. O., Patton D. R., Oke J. B., Horne K. D., Gomer R., Goodrich R., Campbell R., Moriarty-Schieven G. H., Redman R. O., Feldman P. A., Costa E., 1998a, ApJ, 508, L21
- [3] Bloom J. S., Djorgovski S. G., Kulkarni S. R., Frail D. A., 1998b, ApJ, 507, L25
- [4] Bloom J. S. et al., 1999, ApJ, 518, L1-L4
- [5] Calzetti D., Kinney A. L., Storchi-Bergmann T., 1994, ApJ, 429, 582
- [6] Cardelli J. A., Clayton G. C. & Mathis J.S., 1989, ApJ, 345, 245
- [7] Connolly A. J., Szalay A. S., Bershady M. A., Kinney A. L., Calzetti D., 1995, AJ, 110, 1071
- [8] Djorgovski S. G., Kulkarni S. R., Bloom J. S., Goodrich R., Frail D. A., Piro L., Palazzi E., 1998, ApJ, 508, L17
- [9] Hjorth J., et al. 1999, GCN Circ. 219
- [10] Kelson D. D., Illingworth G. D., Franx M., Magee D., & van Dokkum P. G., 1999, IAU Circ. 7096
- [11] Kulkarni S. R., Djorgovski S. G., Ramaprakash A. N., Goodrich R., Bloom J. S., Adelberger K. L., Kundic T., Lubin L., Frail D. A., Frontera F., Feroci M., Nicastro L., Barth A. J., Davis M., Filippenko A. V., 1998, Nature, 393, 35
- [12] Landolt A. U., 1992, AJ, 104, 340
- [13] Metzger M. R., Djorgovski S. G., Kulkarni S. R., et al., 1997, Nature, 387, 878
- [14] Oke J. B., Sandage A., 1968, ApJ, 154, 21
- [15] Sokolov V. V., Fatkhullin T. A., Komarova V. N., astro-ph/0001357, http://xxx.lanl.gov