GRB 991216 Joins the Jet Set:
Discovery and Monitoring of its
Optical Afterglow
Abstract
The optical light curve of the energetic -ray burst GRB 991216 is consistent with jet-like behavior in which a power-law decay steepens from at early times to in a gradual transition at around 2 d. The derivation of the late-time decay slope takes into account the constant contribution of a host or intervening galaxy which was measured 110 days after the event at , although the light curve deviates from a single power law whether or not a constant term is included. The early-time spectral energy distribution of the afterglow can be described as or flatter between optical and X-ray, which, together with the slow initial decay, is characteristic of standard adiabatic evolution in a uniformly dense medium. Assuming that a reported absorption-line redshift of 1.02 is correct, the apparent isotropic energy of ergs is reduced by a factor of in the jet model, and the initial half-opening angle is . GRB 991216 is the third good example of a jet-like afterglow (following GRB 990123 and GRB 990510), supporting a trend in which the apparently most energetic -ray events have the narrowest collimation and a uniform ISM environment. This, plus the absence of evidence for supernovae associated with jet-like afterglows, suggests that these events may originate from a progenitor in which angular momentum plays an important role but a massive stellar envelope or wind does not, e.g., the coalescence of a compact binary.
1 Introduction
GRB 991216 was one of the brightest -ray bursts detected by the Burst and Transient Source Experiment (BATSE), with a fluence of ergs cm-2 above 20.6 keV (Kippen 1999). Rapid follow-up by the Rossi X-ray Timing Explorer Proportional Counter Array (RXTE PCA) detected a fading X-ray afterglow in two sets of scans 4.0 and 10.9 hr after the burst (Takeshima et al. 1999). We began optical observations at 10.8 hr using the 1.3m telescope of the MDM Observatory, covering a field that was large enough to encompass both preliminary and final RXTE derived positions. We discovered the optical afterglow (Uglesich et al. 1999), initially at , during the course of 8 hr of nearly continuous monitoring, by employing the image subtraction technique of Tomaney & Crotts (1996) to search the entire field at once for variable objects. Its position is (J2000) in the USNO–A2.0 reference system (Monet et al. 1996).
Radio observations within the first two days detected a compact, variable source with flux density mJy at 4.8, 8.5 and 15 GHz (Taylor & Berger 1999; Rol et al. 1999; Pooley 1999). A VLBA observation 40 hr after the burst yielded a size less than 1 mas (Taylor & Frail 1999). An spectrum of the optical transient (OT) obtained on the VLT-Antu telescope revealed three systems of absorption lines, at , , and (Vreeswijk et al. 1999). If the burst were located in the highest redshift system, its isotropic -ray energy was ergs (assuming km s-1 Mpc-1, , ), second only to GRB 990123 ( ergs, Kulkarni et al. 1999) among those bursts with measured redshifts.
A key question about energetic bursts such as this one is whether evidence for collimation can be found, and the extent to which such jet behavior reduces the total inferred energy to a value compatible with that available in compact-object binaries. The principal manifestation of a jet geometry is a gradual achromatic steepening of the light curve to a decay after the edge of the jet becomes visible and shortly thereafter begins to spread laterally (Panaitescu, Mészáros, & Rees 1998; Rhoads 1999; Sari, Piran, & Halpern 1999; Moderski, Sikora, & Bulik 2000; Kumar & Panaitescu 2000). Alternatively, such a steepening may occur when the jet becomes non-relativistic (Huang, Dai, & Lu 1999,2000). In this paper, we present evidence for a jet in GRB 991216.
Also of interest is any information that can be gleaned about the environment in which the burst occurs, and what this suggests about the possible progenitor star(s). The spectral and temporal evolution of the afterglow can distinguish between a uniform interstellar medium (ISM), and a nonuniform medium of density , e.g., as is appropriate for a pre-existing stellar wind (Chevalier & Li 1999,2000). We will argue that the afterglow observations of GRB 991216 are more consistent with a uniform ISM.
2 Optical and Infrared Observations
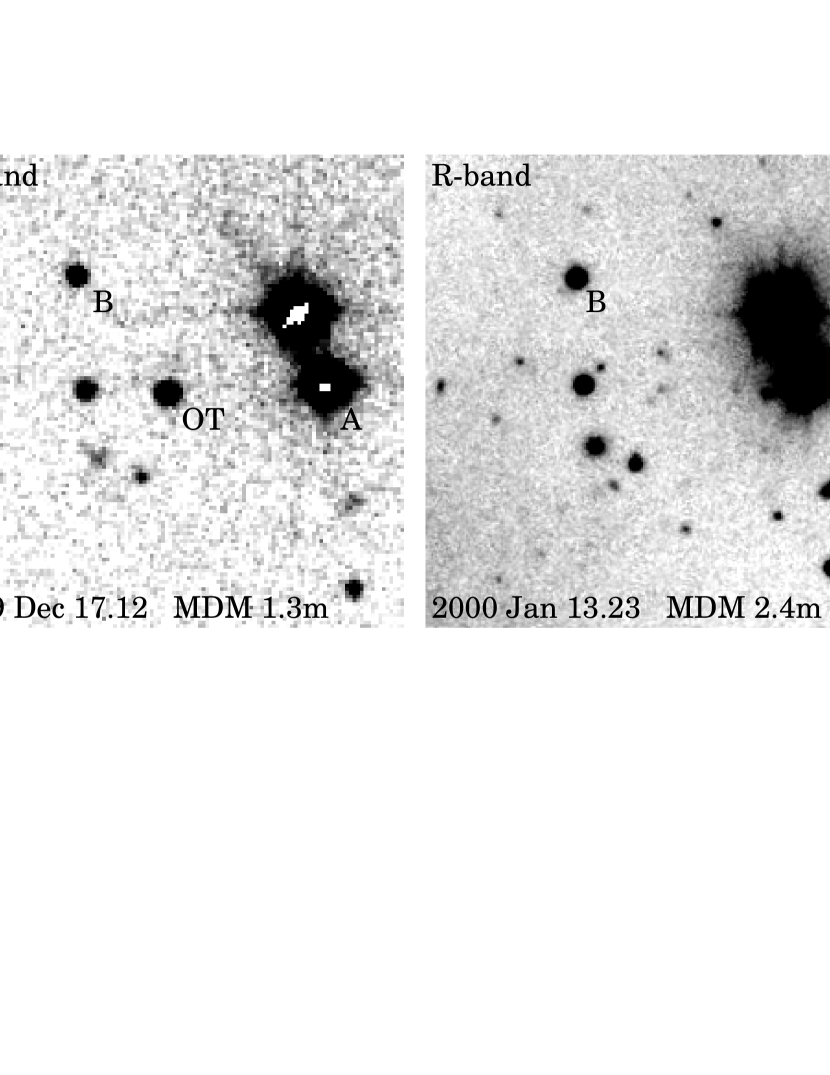
Optical and IR photometry of GRB 991216 was collected at various telescopes as listed in Table 1. We placed all of the optical observations on a common system using the calibrations made of this field by Henden, Guetter, & Vrba (1999). In this system, stars A and B in Figure 1 have and , respectively. Except for the final point on January 13, all of the MDM data were obtained through non-standard broad and filters which we calibrated using 66 Landolt (1992) standard stars. The rms scatter in the fitted transformation is 0.024 mag, which we have included in Table 1 as a systematic error. Gunn and measurements at Palomar and Keck were also transformed to and using Landolt standards. For the observations at MDM, we used UKIRT faint standard stars for calibration. In Figure 2 we graph the light curves in , , and , together with a model developed for the band as described below.
Beginning 10.8 hr after the burst, we obtained a nearly continuous set of -band observations for 8 hr on the MDM 1.3m telescope. This uniform set of data, shown in Figure 3, can be fitted assuming statistical uncertainties only with a power-law decay of . The rms scatter about this fit is only 0.019 mag, which is less than the typical statistical uncertainty of 0.03 mag in the individual points. Therefore, we conclude that any intrinsic fluctuation about the mean decay on time scales from 10 minutes to hours is less than 1%. However, an extrapolation of this power law is strongly inconsistent with the observations after about 3 d. By day 10, when the extrapolation would predict , we observe . Furthermore, there is evidence that the decay flattened after day 20, which we interpret as the increasing dominance of a host or intervening galaxy. In view of this behavior, we subtracted a constant flux from each of the data points. The value of this constant was varied in the range ; the measurement of this contribution is explained in the following paragraph. After day 1, all of the corrected data points are well fitted by a steeper decay, . The error quoted here includes both the statistical uncertainty in the fit () and the the systematic range () introduced by the estimated uncertainty in the subtracted galaxy contribution.
The fit of the late-time slope is dependent upon the interpretation of the latest photometric point as dominated by the constant contribution of a galaxy, which could be either the host or an intervening galaxy in view of the three absorption-line redshifts seen in the optical spectrum of the OT. Here we describe some details of the images that are relevant to this conclusion. All of the images obtained after day 10, when we surmise that galaxy contribution became significant, show some extension to the west of the OT, and the penultimate image from January 13, taken in seeing, looks quite extended. The final image obtained on 2000 April 3 under similar seeing shows no indication of the OT. Rather, an object extended by in the east-west direction is centered approximately west of the previously measured position of the OT. In addition, there is a faint galaxy only to the southeast of the OT, which makes it tricky to measure an integrated magnitude for the OT/galaxy at late times. The estimated total magnitude of the “host” galaxy is , but not all of this flux is included in the photometry of the OT. Instead, a lesser contamination of the OT is achieved by measuring its magnitude after day 10 in a radius aperture centered on the OT position. This procedure produces a relatively robust measurement of the OT plus superposed galaxy contribution. The galaxy contribution alone at the position of the OT is measured in the same way on April 3. The result is , which is the final magnitude listed in Table 1 and the constant that we subtracted from the previous measurements to fit the OT decay curve.
It has become customary to fit such steepening afterglow decays with a smooth function that has asymptotic power-law behavior at early and late times. One such simple function is
Here and represent the asymptotic early and late time slopes, is the constant galaxy contribution, and is the OT flux at the cross-over time . Unfortunately, the data on GRB 991216 do not permit many interesting constraints on these parameters to be derived. Our experiments with such fits show that could be as steep as –2.1. Therefore, we consider that is the allowed range on the late-time decay, while is certainly true at early times. There aren’t observations at sufficiently early times to constrain an upper limit on , and is essentially unconstrained within a factor of 10 due to the sparse data at late times. In Figure 2, we draw an acceptable fit to Equation 1 in which was fixed, which results in best-fitted parameter values , d, and . The latter is consistent with as the constant contribution of the portion of the host or intervening galaxy which contaminates the OT photometry. We stress that such a fit is illustrative only. More important, we note that the decay parameters of GRB 991216 are strikingly similar to that of GRB 990123 (Kulkarni et al 1999), the most energetic event yet observed.
3 Broad-Band Continuum Shape and Reddening
It is possible to synthesize a broad-band spectrum from these data by interpolating the magnitudes to a particular time using the observed decay rates. We chose a time of December 18.34 UT, 40 hr after the burst, which falls close to the largest number of measurements at different frequencies from radio through X-ray. The interpolated magnitudes were converted to fluxes using standard calibrations, and are graphed as filled circles in Figure 4. Galactic reddening is a significant factor in this field because of its intermediate Galactic latitude, . The selective extinction can be estimated in at least two ways. First is the value of Schlegel, Finkbeiner, & Davis (1998) from the IRAS m maps, mag. This is significantly larger than a second estimate, mag, which can be derived from the Galactic 21 cm column density in this direction, cm-2 (Zhang & Green 1991; Stark et al. 1992), and the standard conversion cm-2 mag-1 (Savage & Mathis 1979). It is likely that H I underestimates the extinction to GRB 991216 because this position falls on the edge of a CO cloud that is part of an expanding molecular and dust ring energized by the Orionis H II region away (Maddalena & Morris 1987; Zhang et al. 1989). Associated with this CO cloud is the Lynds (1962) dark nebula LDN 1571, only from GRB 991216.
Figure 4 shows the results of applying each of these extinction corrections. In neither case is the dereddened spectrum a good fit to a power law, although illustrative extreme fits are drawn corresponding to the two suggested values of the extinction. In particular, the turn-down in the band is puzzling in view of the higher radio flux which was observed at mJy on several occasions before and up to this time (Taylor & Berger 1999; Rol et al. 1999; Pooley 1999; Taylor & Frail 1999). Such a break would require a concave upward inflection at longer wavelengths, which is not accommodated by any afterglow model. A similar peak was seen in the IR photometry of GRB 971214 (Ramaprakash et al. 1998), but it too could not be satisfactorily explained (Wijers & Galama 1999) in a manner consistent with all of the other data on that burst. In the case of GRB 991216, additional IR data which do not show such a peak have been reported by Garnavich et al. (2000). In particular, they find on Dec. 18.25, which corresponds to about 45% more flux than our own nearly simultaneous measurement ( on Dec. 18.18) when extrapolated to the same time. If our own -band point is in error, such a correction would essential restore a power-law form to our optical and IR photometry, so we suspect that this may be the case.
An additional constraint on the spectral slope and extinction can be obtained in a weakly model-dependent way by comparing the extrapolated optical spectrum to the simultaneously measured X-ray flux. In the X-ray, five measurements were made between 1 and 40 hr after the burst, starting with the All-Sky Monitor (ASM, Corbet & Smith 1999), continuing with the PCA (Takeshima et al. 1999), and ending with the Chandra High-Energy Transmission Grating (HETG, Piro et al. 1999). All of these X-ray fluxes can be fitted by a power-law temporal decay of index , as noted by the above authors (see Fig. 5). This decay was used to determine the X-ray flux on December 18.34 shown in Figure 6. It is evident that the smaller value of the extinction, mag, is probably an underestimate, and that the larger value is possibly an overestimate unless the spectrum steepens from in the optical to at least from the ultraviolet through X-ray. Allowing these extreme limits for Galactic extinction, the slope between the band and the 2–10 keV X-rays can be characterized as , although a broken power law as illustrated in Figure 6 is allowed since the X-ray spectrum itself has (Takeshima et al. 1999).
At the beginning of our optical monitoring, 10.8 hr after the burst, there was also a simultaneous X-ray observation (Takeshima et al. 1999). At that earlier time the -band to X-ray spectrum of GRB 991216 can be described by the slightly flatter index , where the error is again dominated by the uncertainty in optical extinction suggested above.
4 Geometry and Environment
The early-time decay rate and broad-band spectral energy distribution of GRB 991216 from optical through X-ray are consistent with the standard theory of adiabatic evolution in a uniformly dense medium (e.g., Sari, Piran, & Narayan 1998). In such a model, a decaying synchrotron spectrum follows the form with in the regime where . Here is the index of the power-law electron energy distribution, and is the “cooling frequency” at which the electron energy loss time scale is equal to the age of the shock. At frequencies , the power law steepens by 1/2 to because of synchrotron losses, and decreases by 1/4 to . At a time of 10.8 hr the optical-to-X-ray spectrum of GRB 991216 can be described as . At the same time the optical decay rate must follow , depending upon whether a simple power law or a dual power-law function is fitted, which is therefore consistent with . Since in the X-ray (Takeshima et al. 1999), the overall spectrum is consistent with falling between the optical and X-ray at times between 10.8 and 40 hr, and . Extrapolation of the X-ray spectrum to the extension of the optical points shows that Hz at 40 hr (Fig. 6). Only the X-ray decay rate, (Takeshima et al. 1999), is slightly discrepant from the predicted value which should be .
The gradual steepening of the -band decay is in accord with some models of jet-like afterglows. Numerous authors have discussed the possible effects of collimation. At first, analytic arguments indicated that a steepening of the light curve is expected after the edge of a jet is seen when it slows to a Lorentz factor , where is the initial opening angle of the jet (Panaitescu et al. 1998). At the same time, or soon thereafter, the jet would begin to spread (Rhoads 1999; Sari et al. 1999), resulting in an asymptotic decay rate and spectral shape which is constant in time. Other authors have shown through numerical simulations that such a transition, if visible at all, is not very sharp. The transition produces at best a gradual transition to extended over two orders of magnitude in time (Moderski et al. 2000). Kumar & Panaitescu (2000) found that in a uniform density medium the decay index steepens by over a factor of 10 in time. Both of these predictions are consistent with the behavior of GRB 991216, for which in the range –1.5 to –2.1 describes the decay from 2 to days. It has also been shown that breaks are expected to result from the later transition of a jet to the non-relativistic regime even when they don’t occur earlier in the relativistic phase (Huang et al. 1999,2000). While the possible causes of temporal breaks in afterglow decays are still uncertain, it is generally agreed that when breaks are seen, collimated jets are likely to be responsible.
If the steepening in the optical decay of GRB 991216 to occurred at 1 d or later, then we need to explain why a steeper X-ray decay () was observed at earlier times. In the context of the transition, this might be understood in terms of the evolution of a layered jet, in which the higher-energy emission is concentrated in a narrower core which began to spread earlier.
The jet theory is most consistent with the observations of GRB 991216, while an alternative interpretation of the observed steepening as the passage of the cooling frequency through the optical band is less plausible for three reasons. First, the expected decay exponent in the cooling regime is only , which is not steep enough to account for the observations at late times. Second, declines as in a spherical afterglow. Since Hz is observed at 40 hr, we would expect Hz at 3 d, which is still in the extreme ultraviolet. Third, the decay rate in the band through day 3 is at least as steep as it is in the band.
Another class of models provides a better fit to several of the GRB afterglows, but it is less compatible with GRB 991216. This is the wind interaction (Chevalier & Li 1999,2000), in which the afterglow develops in a nonuniform medium of density as appropriate for a pre-existing stellar wind from a massive stellar progenitor. In the wind model for , and the same evolution as the constant density case applies for . If we make the plausible assumption that , then in a wind environment, and the slow initial decay of GRB 991216 with is difficult to accommodate. Alternatively, if we hypothesize that at the time of the earliest observations of the afterglow, then the spectral index is too flat to meet the requirement for in this cooling regime, and the observed spectral and temporal steeping in the X-rays is unexplained. In wind models, the X-ray decay should not be steeper than the optical decay, which is in contradiction to the observations of GRB 991216. We conclude that afterglow of GRB 991216 does not show a stellar wind interaction, but behaves like a jet in a uniform ISM.
5 Energetics and Origin
Under the assumption that a jet-like GRB is collimated into the same solid angle as its early afterglow, Sari et al. (1999) argue that the cross-over time in the afterglow light curve can be related to the -ray energy via
where is the apparent (isotropic) energy in units of ergs, is the ISM density in cm-3, and is the half opening angle of the jet. The factor is required if is in the observer’s frame. For the case of GRB 991216, with d and ergs, we infer that , and that the energy is reduced by a factor of to ergs, within the range of compact-object coalescence. Even if d, the energy reduction is still a factor of 100. However, the assignment of the -ray energy to in this analysis is not an obvious choice. The energy powering the afterglow expansion could be either more or less than the observed -rays. As an alternative, we can estimate the observed energy in the afterglow itself, which is dominated by the X-rays at early times. If we integrate the observed (2–10 keV) X-ray flux back to a time of 600 s, when its flux would have been mJy, comparable to the radio peak, we get ergs cm-2, or almost 10% of the -ray burst fluence in less than one decade of frequency. Thus, it seems that we cannot be far from wrong in using either the burst or the afterglow energy in Equation (2). In particular, we are probably not underestimating the opening angle of the jet. Also, because of the extreme energy, it is unlikely that the jet has become non-relativistic during the times considered here. For this to have occurred, densities in excess of cm-3 would be required, and there is little evidence for the excess extinction that would be expected from such an environment.
GRB 991216 is the third good example of a jet-like afterglow following GRB 990123 (Kulkarni et al. 1999) and GRB 990510 (Harrison et al. 1999; Stanek et al. 1999; Beuermann et al. 1999), supporting a trend in which the apparently most energetic -ray events have the narrowest collimation and a uniform ISM environment. [The only other event with a demonstrated isotropic energy ergs was GRB 971214 at (Kulkarni et al. 1998), but its afterglow was not well characterized because it was both faint and reddened.] Chevalier & Li (2000) classified afterglows into two types according to whether their evolution best matches an ISM (constant density) or stellar wind () environment. Only GRB 990123 and GRB 990510 definitely fell in the ISM category, leading Chevalier & Li to speculate that these were compact-object mergers. They also noted an absence of evidence for supernovae associated with these jet-like afterglows, although supernovae may be difficult to see in these hosts at (Bloom et al. 1999). In the case of GRB 990510, no host galaxy has been found to a limiting magnitude of (Fruchter et al. 1999; Beuermann et al. 1999). Although host galaxies as faint as this are not unexpected (Hogg & Fruchter 1999), the possibility is at least allowed that GRB 990510 occurred outside its parent galaxy. A massive star is expected to explode close to its birth site, whereas an evolved compact binary may or may not escape its parent galaxy. If the mechanism of collimation, probably magnetic in nature, can be at least as effective in compact binary mergers as it is in the collapse of a single massive star (MacFadyen & Woosley 1999), then the merger is a plausible origin of jet-like bursts. However, this would certainly contradict the prevailing theory (e.g., Fryer, Woosley, & Hartmann 1999) that massive stars are the progenitors of the long-duration GRBs which comprise all of the ones that have been localized, while compact binary mergers are responsible for the as-yet unidentifed sources of the short-duration GRBs.
References
- (1) Beuermann, K., et al. 1999, A&A, 352, L26
- (2) Bloom, J. S., et al. 1999, Nature, 401, 453
- (3) Chevalier, R. A., & Li, Z.-Y. 1999, ApJ, 520, L29
- (4) Chevalier, R. A., & Li, Z.-Y. 2000, ApJ, in press
- (5) Corbet, R., & Smith, D. 1999, GCN Circ. 506 (http://gcn.gsfc.nasa.gov/gcn/gcn3/506.gcn3)
- (6) Djorgovski, S. G., Goodrich, R., Kulkarni, S. R., Bloom, J. S., Diercks, A., Harrison, F., & Frail, D. A. 1999, GCN Circ. 510 (http://gcn.gsfc.nasa.gov/gcn/gcn3/510.gcn3)
- (7) Fruchter, A., Ferguson, H., Pepper, J., Gibbons, R., Sahu, K., & Pian, E. 1999, GCN Circ. 386 (http://gcn.gsfc.nasa.gov/gcn/gcn3/386.gcn3)
- (8) Fryer, C. L., Woosley, S. E., & Hartmann, D. H. 1999, ApJ, 526, 152
- (9) Garnavich, P., Jha, S., Stanek, K., Pahre, M., Garcia, M., Szentgyorgyi, A., & Tonry, J. 1999, GCN Circ. 495 (http://gcn.gsfc.nasa.gov/gcn/gcn3/495.gcn3)
- (10) Garnavich, P. M., Jha, S., Pahre, M. A., Stanek, K. Z., Garcia, M., Szentgyorgyi, A., & Tonry, J. 2000, ApJ, submitted
- (11) Harrison, F. A., et al. 1999, ApJ, 523, L121
- (12) Henden, A., Guetter, H., & Vrba F. 1999, GCN Circ. 518 (http://gcn.gsfc.nasa.gov/gcn/gcn3/518.gcn3)
- (13) Hogg, D. W., & Fruchter, A. S. 1999, ApJ, 520, 54
- (14) Huang, Y. F., Dai, Z. G., & Lu, T. 1999, MNRAS, 309, 513
- (15) Huang, Y. F., Dai, Z. G., & Lu, T. 2000, A&A, 335, L43
- (16) Jensen et al. 1999, GCN Circ. 498 (http://gcn.gsfc.nasa.gov/gcn/gcn3/498.gcn3)
- (17) Jha, S., Kirshner, R., Stanek, K., Garnavich, P., Garcia, M., Szentgyorgyi, A., & Tonry, J. 1999, GCN Circ. 476 (http://gcn.gsfc.nasa.gov/gcn/gcn3/476.gcn3)
- (18) Kippen, R. M. 1999, GCN Circ. 504 (http://gcn.gsfc.nasa.gov/gcn/gcn3/504.gcn3)
- (19) Kulkarni, S. R., et al. 1998, Nature, 393, 35
- (20) Kulkarni, S. R., et al. 1999, Nature, 398, 389
- (21) Kumar, P., & Panaitescu, A. 2000, ApJ, submitted
- (22) Landolt, A. U. 1992, AJ, 104, 372
- (23) Leibowitz, E. M. 1999, GCN Circ. 491 (http://gcn.gsfc.nasa.gov/gcn/gcn3/491.gcn3)
- (24) Lynds, B. T. 1962, ApJS, 7, 1
- (25) MacFadyen, A. I., & Woosley, S. E. 1999, ApJ, 525, 262
- (26) Maddalena, R. J., & Morris, M. 1987, ApJ, 323, 179
- (27) Moderski, R., Sikora, M., & Bulik, T. 2000, ApJ, 529, 151
- (28) Monet, D., et al. 1996, USNO–SA2.0, (Washington DC: US Naval Observatory)
- (29) Panaitescu, A., Mészáros, P., & Rees, M. J. 1998, ApJ, 503, 314
- (30) Piro, L., Garmire, G., Garcia, M., Marshall, F., & Takeshima, T. 1999, GCN Circ. 500 (http://gcn.gsfc.nasa.gov/gcn/gcn3/500.gcn3)
- (31) Pooley, G. 1999, GCN Circ. 488 (http://gcn.gsfc.nasa.gov/gcn/gcn3/488.gcn3)
- (32) Ramaprakash, A. N., et al. 1998, Nature, 393, 43
- (33) Rhoads, J. E. 1999, ApJ, 525, 737
- (34) Rol, E., Vreeswijk, P. M., Strom, R., Kouveliotou, C., Pian, E., Castro-Tirado, A., Hjorth, J., & Greiner, J. 1999, GCN Circ. 491 (http://gcn.gsfc.nasa.gov/gcn/gcn3/491.gcn3)
- (35) Sari, R., Piran, T., & Narayan, R. 1998, ApJ, 497, L17
- (36) Sari, R., Piran, T., & Halpern, J. P. 1999, ApJ, 519, L17
- (37) Savage, B. D., & Mathis, J. S. 1979, ARAA, 17, 73
- (38) Schlegel, D. J., Finkbeiner, D. P., & Davis, M. 1998, ApJ, 500, 525
- (39) Stanek, K. Z., Garnavich, P. M., Kaluzny, J., Pych, W., & Thompson, I. 1999, ApJ, 422, L39
- (40) Stark, A. A., Gammie, C. F., Wilson, R. W., Bally, J., Linke, R. A., Heiles, C., & Hurwitz, M. 1992, ApJS, 79, 77
- (41) Takeshima, T., Markwardt, C., Marshall, F., Giblin, T., & Kippen, R. M. 1999, GCN Circ. 478 (http://gcn.gsfc.nasa.gov/gcn/gcn3/478.gcn3)
- (42) Taylor, G. B., & Berger, E. 1999, GCN Circ. 483 (http://gcn.gsfc.nasa.gov/gcn/gcn3/483.gcn3)
- (43) Taylor, G. B., & Frail, D. A. 1999, GCN Circ. 514 (http://gcn.gsfc.nasa.gov/gcn/gcn3/514.gcn3)
- (44) Tomaney, A. B., & Crotts, A. P. S. 1996, AJ, 112, 2872
- (45) Vreeswijk, P. M., et al. 1999, GCN Circ. 496 (http://gcn.gsfc.nasa.gov/gcn/gcn3/496.gcn3)
- (46) Uglesich, R., Mirabal, N., Halpern, J., Kassin, S., & Novati, S., 1999, GCN Circ. 472 (http://gcn.gsfc.nasa.gov/gcn/gcn3/472.gcn3)
- (47) Wijers, R. A. M. J., & Galama, T. J. 1999, ApJ, 523, 177
- (48) Zhang, C. Y., & Green, D. A. 1991, AJ, 101, 1006
- (49) Zhang, C. Y., Laureijs, R. J., Chlewicki, G., Clark, F. O., & Wesselius, P. R. 1989, A&A, 218, 231


| Date (UT) | Telescope | Filter | Magnitude | Reference |
|---|---|---|---|---|
| 1999 Dec 18.341 | Lowell 1.8m | 1 | ||
| 1999 Dec 17.12 | MDM 1.3m | 1 | ||
| 1999 Dec 17.139 | MDM 1.3m | 1 | ||
| 1999 Dec 17.149 | MDM 1.3m | 1 | ||
| 1999 Dec 17.153 | Lowell 1.8m | 1 | ||
| 1999 Dec 17.157 | Lowell 1.8m | 1 | ||
| 1999 Dec 17.158 | MDM 1.3m | 1 | ||
| 1999 Dec 17.166 | MDM 1.3m | 1 | ||
| 1999 Dec 17.174 | MDM 1.3m | 1 | ||
| 1999 Dec 17.183 | MDM 1.3m | 1 | ||
| 1999 Dec 17.206 | MDM 1.3m | 1 | ||
| 1999 Dec 17.217 | MDM 1.3m | 1 | ||
| 1999 Dec 17.229 | MDM 1.3m | 1 | ||
| 1999 Dec 17.260 | MDM 1.3m | 1 | ||
| 1999 Dec 17.272 | MDM 1.3m | 1 | ||
| 1999 Dec 17.310 | MDM 1.3m | 1 | ||
| 1999 Dec 17.326 | MDM 1.3m | 1 | ||
| 1999 Dec 17.340 | MDM 1.3m | 1 | ||
| 1999 Dec 17.374 | MDM 1.3m | 1 | ||
| 1999 Dec 17.40 | MDM 1.3m | 1 | ||
| 1999 Dec 17.424 | MDM 1.3m | 1 | ||
| 1999 Dec 17.451 | MDM 1.3m | 1 | ||
| 1999 Dec 17.61 | Hawaii 2.2m | 2 | ||
| 1999 Dec 17.733 | Wise 1m | 3 | ||
| 1999 Dec 18.11 | Danish 1.5m | 4 | ||
| 1999 Dec 18.191 | Lowell 1.8m | 1 | ||
| 1999 Dec 18.32 | Danish 1.5m | 4 | ||
| 1999 Dec 18.398 | Palomar 5m | 1 | ||
| 1999 Dec 18.32 | Hawaii 2.2m | 5 | ||
| 1999 Dec 18.56 | Hawaii 2.2m | 5 | ||
| 1999 Dec 19.10 | NOT 2.5m | 4 | ||
| 1999 Dec 20.31 | Lowell 1.8m | 1 | ||
| 1999 Dec 27.217 | MDM 2.4m | 1 | ||
| 1999 Dec 29.405 | Keck II | 1,6 | ||
| 2000 Jan 13.232 | MDM 2.4m | 1 | ||
| 2000 Apr 4.23 | Keck II | 1 | ||
| 1999 Dec 17.220 | Palomar 5m | 1 | ||
| 1999 Dec 17.463 | Palomar 5m | 1 | ||
| 1999 Dec 17.483 | MDM 1.3m | 1 | ||
| 1999 Dec 17.491 | MDM 1.3m | 1 | ||
| 1999 Dec 18.278 | Palomar 5m | 1 | ||
| 1999 Dec 18.366 | Lowell 1.8m | 1 | ||
| 1999 Dec 19.342 | HET | 1 | ||
| 1999 Dec 17.35 | FLWO 1.2m | 5 | ||
| 1999 Dec 18.16 | MDM 2.4m | 1 | ||
| 1999 Dec 18.30 | FLWO 1.2m | 5 | ||
| 1999 Dec 18.21 | MDM 2.4m | 1 | ||
| 1999 Dec 18.18 | MDM 2.4m | 1 |