VLT-ISAAC near-IR Spectroscopy of ISO selected Hubble Deep Field South Galaxies111Based on observations with ISO, an ESA project with instruments funded by ESA member states (especially the PI countries: France, Germany, the Netherlands, and the United Kingdom) with the participation of ISAS and NASA. 222Based on observations collected at the European Southern Observatory, Chile, ESO No 63.O-0022
Abstract
We report the results of near-infrared VLT-ISAAC spectroscopy of a sample of 12 galaxies at z = 0.4–1.4, drawn from the ISOCAM survey of the Hubble Deep Field South. We find that the rest frame R-band spectra of the ISOCAM galaxies resemble those of powerful dust-enshrouded starbursts. Hα emission is detected in 11 out of 12 objects down to a flux limit of 710-17 erg cm-2 s-1, corresponding to a luminosity limit of 1041 erg s-1 at z = 0.6, (for an Ho = 50 and = 0.3 cosmology). From the Hα luminosities in these galaxies we derive estimates of the star formation rate in the range 2–50 M for stellar masses 1–100 M⊙. The raw Hα–based star formation rates are an order of magnitude or more lower than SFR(FIR) estimates based on ISOCAM LW3 fluxes. If the Hα emission is corrected for extinction the median offset is reduced to a factor of 3. The sample galaxies are part of a new population of optically faint but infrared–luminous active starburst galaxies, which are characterized by an extremely high rate of evolution with redshift up to z1.5 and expected to contribute significantly to the cosmic far-IR extragalactic background.
1 Introduction
Until recently, most of our knowledge about high-z galaxies has come from optical surveys. The COBE detection of an extragalactic far–infraredsubmm background (Puget et al. 1996), with an integrated intensity similar to or greater than that of optical light (e.g. Hauser et al. 1998), strongly suggests that a significant fraction of the cosmic star formation in the Universe is obscured by dust and thus missed by the various optical surveys.
With the advent of the Infrared Space Observatory (ISO, Kessler et al. 1996) deep mid–IR surveys for distant galaxies, have been successfully carried out for the first time. Operating in the 5 – 18 m band sensitive to warm dust and emission from Polycyclic Aromatic Hydrocarbons (PAH), ISOCAM on board ISO was more than 1000 times more sensitive than IRAS and thus had the potential to study infrared bright galaxies at redshifts beyond 0.5. A number of cosmological surveys have been performed with ISOCAM especially in the LW3 filter (12 – 18m). These surveys range from the wide and shallow European Large Area ISO Survey (ELAIS, Oliver et al. 2000), to deep pencil–beam surveys in the Lockman Hole, the Marano field, the Northern and Southern Hubble Deep Fields (HDF–N, HDF–S) and the distant cluster Abell 2390, reaching limiting flux densities of 50 – 100 Jy (Elbaz et al. 1999).
At the bright end the ISOCAM source counts combined with those of IRAS are in good agreement with no or moderate evolution. At fainter flux densities the counts steepen considerably and at 200 – 600 Jy they are about an order of magnitude greater than the predictions of no evolution models. This steepening in the log N–log S plot and a pronounced maximum in the differential number counts at 400 Jy suggest that the ISOCAM surveys have revealed a population of strongly evolving galaxies. Elbaz et al. (2000, in preparation) show that this population plausibly accounts for a significant fraction of the far-IR background. The next step is to explore the nature of the ISOCAM population with opticalnear-IR spectroscopy. In this letter we report on the first near-IR (rest-frame R–band) spectroscopic survey of a representative sample of faint ISOCAM galaxies in the HDF–S field.
2 Sample Selection
The HDF–S was observed by ISOCAM as part of the ELAIS survey. The observations were carried out at two wavelengths, LW2 ( 6.75 m) and LW3 (15 m). Oliver et al. (2000, in preparation) and Aussel et al. (2000, in preparation) analyzed the data independently. Aussel et al. used the PRETI method and detected 63 sources brighter than S15μm = 100 Jy in the LW3 band. We used this source list as input for our observations.
We selected the sample for ISAAC follow up from the HDF–S LW3 sources based on the following criteria: a) a reliable LW3 detection, b) Hα in the wavelength range of ISAAC and, c) a secure counterpart in the I band image (Dennefeld et al. 2000, in preparation), or a counterpart in the K band image (ESO Imaging Survey (EIS) Deep). We did not apply any selection based on colors. Our reference sample contains 25 galaxies with 15 m flux densities ranging between 100–800 Jy. It is thus a fair representation of the strongly evolving ISOCAM population near the peak of the differential source counts (Elbaz et al. 1999). From these 25 optically identified sources we randomly selected 12 sources for ISAAC–follow up. To select the near-IR band (Z, SZ, J, H) for our spectroscopy we used spectroscopic redshifts from optical spectroscopy, where available, for z0.7 (Dennefeld et al. 2000, in prep.). Otherwise we used photometric redshift estimates based on the model PEGASE (Fioc and Rocca-Volmerange 1997). Our photometric redshift determinations turned out to be accurate to z0.1.
3 Observations and Results
We collected the spectra during 1999 September 20–24 with the infrared spectrometer ISAAC (Moorwood et al. 1998) on the ANTU–ESO telescope (formerly UT1), on Paranal, Chile. For the observations we used the low resolution grating R 600 and a 1″2′ long slit. To maximize the observing efficiency each slit position included on average two galaxies at any given orientation. Most of the targets were first acquired directly from a 1–2 min exposure in the H-band. In the case of the very faint objects (H 20.0 mag) we offset from a brighter star in the HDF-S field. Observations were made by nodding the telescope 20″ along the slit to facilitate sky subtraction (always avoiding overlap of the two objects in the slit). Individual exposures ranged from 2–4 minutes. Sky conditions were excellent throughout the acquisition of the spectra, with seeing values in the range 0.4″–1.0″. For each filter, observations of spectroscopic standard stars were made in order to flux calibrate the galaxy spectra.
The data were reduced using applications from ECLIPSE (Devillard 1998) and IRAF packages. Accurate sky subtraction is critical to the detection of faint lines. Sky was removed by subtracting the pairs of offset frames. In some cases this left a residual signal (due to temporal sky changes) which was then removed by performing a polynomial interpolation along the slit. OH sky emission lines were also carefully removed from the spectra. Spectrum extraction for each galaxy was performed using the APEXTRACT package. Standard wavelength calibration was applied.
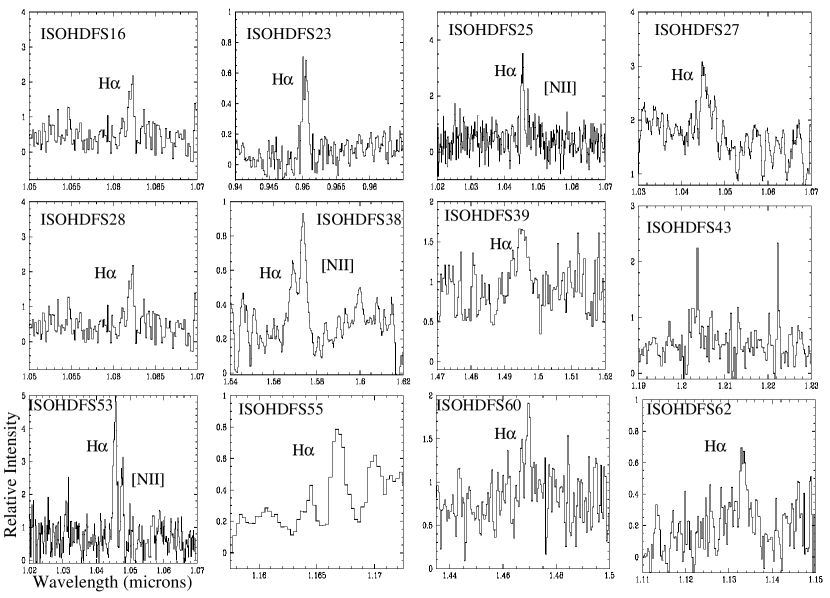
The spectra for all 12 galaxies observed with ISAAC are shown in Figure 1. Table 1 contains exposure times, HAB magnitudes, measured spectroscopic redshifts (from Hα detections), Hα line fluxes and Equivalent Widths (EW) (and where resolved [NII] fluxes). We convert the Hα line fluxes to luminosities using Ho = 50 km s-1 Mpc-1 and = 0.3. We also list in Table 1 FIR luminosities based on LW3 fluxes (see Section 5 for more details). We note that we have not detected any Hα Broad Line components.
4 The nature of the ISOCAM faint galaxies: Dusty and Luminous Starbursts
Prior to our study no near-infrared (rest-frame R-band) spectroscopy had been carried out for the ISOCAM population, primarily because of the faintness of the galaxies. Aussel et al. (1999) and Flores et al. (1999) have presented optical spectroscopic analysis (rest-frame B-band) for HDF-N and the 141552 field of the Canada-France Redshift Survey (CFRS), respectively. Aussel et al. (1999) cross-correlated the ISOCAM HDF-N galaxies with the optical catalog of Barger et al. (1999) resulting in 38 galaxies with confirmed spectroscopic redshifts. Flores et al. have identified 22 galaxies with confirmed spectroscopic information. In both of these samples the median redshift is about 0.7. Our ISOHDFS sample contains 7 galaxies 0.4z0.7 and 5 galaxies with 0.7z1.4 and thus, has a z-distribution very similar to the HDF-N (Aussel et al.) and CFRS (Flores et al.) samples.
Rest-frame B-band spectra host a number of emission and absorption lines related to the properties of the starburst in the galaxy. Based on these features galaxies can be classified according to their starburst history. Strong Hδ, Hϵ Balmer absorption and no emission lines are characteristic of passively evolving kA galaxies. The presence of Balmer absorption lines implies the presence of a dominating A-star population formed about 0.1–1 Gyr ago. The simultaneous presence of Balmer absorption and moderate flux [OII] and Hβ emission termed as e(a) or SA galaxies, indicates that, in addition, there is ongoing star formation. The relative importance of these star formation episodes depends on the extinction (especially of the current star formation component). If the extinction is low the galaxy is primarily a post–starburst system. If the extinction toward the star forming region is high then the galaxy could be a powerful starburst. The majority of the galaxies in the CFRS field ( 70%) display optical spectra characteristic of e(a) galaxies. As evidenced by the detections in Figure 1, the ISOCAM galaxies are in fact powerful starbursts hidden by large amounts of dust extinction.
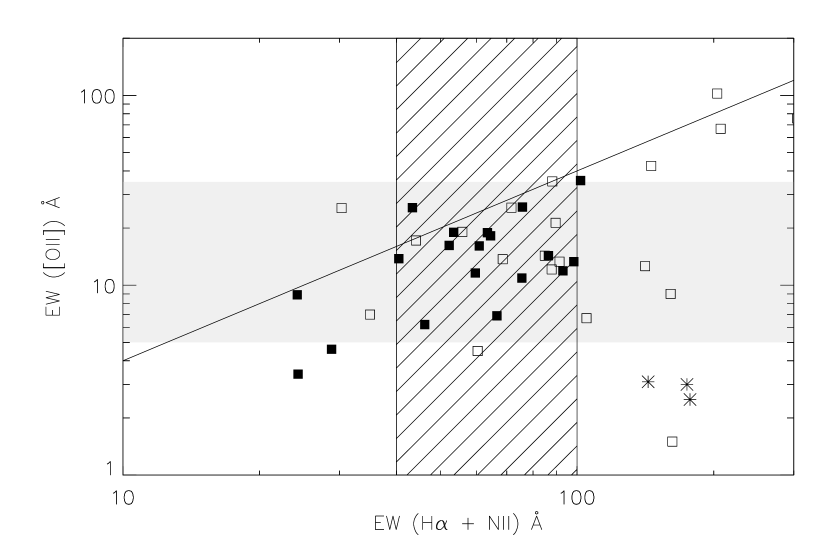
Remarkably, dusty starbursts such as M82 (L 1010 L⊙, Kennicutt et al. 1992), LIRGs (Luminous InfraRed Galaxies, L 1011 L⊙, Wu et al. 1998), and many bright ULIRGs (L 1012 L⊙, Liu and Kennicutt 1995), show e(a) B–band spectra. Local e(a) galaxies have large Hα equivalent widths (EW), at the same time demonstrating active current star formation and differential dust extinction. The measured EW ratio ([OII]Hα) for e(a) galaxies appears to be somewhat low. Such low ratios have already been observed in the spectra of distant clusters (Dressler et al. 1999), nearby mergers (Poggianti and Wu 2000), the dusty LIRGs studied by Wu et al. (1998) or the interactingmerging systems studied by Liu and Kennicutt (1995). The behaviour of the (OII)(HNII) ratio is shown in the EW(OII)–EW(H NII) diagram of Figure 2: the majority of the points lie below the straight line. For our ISOHDFS sample we use the EW(Hα) measured from the observations presented here. For the EW(OII) we use a median value of 2015 Ȧ which was recently measured from FORS2 I-band spectra of a small sample of ISOHDFS galaxies (Franceschini et al. 2000, in preparation). This value is in agreement with the results presented by Flores et al. (1999) for the CFRS galaxies.
It follows from Figure 2 that the ISOHDFS galaxies occupy the same region in the EW(OII)EW(H NII) diagram as actively starforming galaxies. Intrinsic differential dust extinction is responsible for the somewhat low EW(OII) EW(HNII) ratio. The [OII] emission is affected more than Hα simply because of its shorter wavelength. The continuum is due to A-stars which come from earlier (0.1–1.0 Gyr) star formation activity that is not energetically dominant and plays a small role once the dusty starburst is dereddened. This scenario implies that these galaxies undergo multiple burst events: the less extincted population is due to an older burst while in the heavily dust enshrouded HII regions there is ongoing star formation. We conclude that ISOCAM galaxies are actively starforming, dust enshrouded galaxies, akin to local LIRGs (e.g. NGC 3256, Rigopoulou et al. 1996).
5 Star Formation Rates and Extinction Corrections
The conversion factor between ionizing luminosity and star formation rate (SFR) is usually computed using an evolutionary synthesis model. Only massive stars ( 20 M⊙) with short lifetimes ( 106 yrs) contribute to the integrated ionizing flux. Using the stellar synthesis code STARS (Sternberg 1998) we create models for solar abundances, a Salpeter IMF (1–100 M⊙) and slowly decaying bursts with ages in the range of a few 107–108 yrs, and SFR decay time-scales in the range 107-109 yrs. Averaging, we obtain:
SFR(M) = 5 10-42L(erg s-1).
| (1) |
We have used this formula to estimate the SFR rates in Table 2. The SFR estimates based on Eqn.(1) are a factor of 1.6 smaller than the SFR estimates based on the Kennicutt (1998) relationship that refers to stars in the range 0.1–100 M⊙. Averaging over our models, the SFR scales with the FIR luminosity as:
SFR(M) = 2.6 10-44LFIR(erg s-1)
| (2) |
Since extinction is at play, the SFR estimates we quote in the first column of Table 2 are lower limits to the real SFR in these galaxies. We derive the extinction based on V–K color indices (magnitudes taken from the EIS Survey). Using STARS as well as the Starburst99 (Leitherer et al. 1999) codes for various star formation histories (ie bursts of different duration, and continuous star formation) we calculate the range of intrinsic colors. The model predicted intrinsic V–K colors are in the range 1.1 – 1.5. We have applied infrared and optical K-corrections from Poggianti (1997) and Coleman (1980), respectively. Comparing the observed V–K colors to the predicted ones we obtain a median color excess of 2.0 which corresponds to a median AV of 1.8 assuming a screen model for the extinction. This AV value corresponds to a median correction factor for the SFR(Hα) of 4.
The SFR can also be inferred from far-infrared (FIR) luminosities according to Eqn. (2). The SFR(FIR) estimates in Table 2 are based on the method of Franceschini et al. (2000, in prep.) which makes use of the 15 m flux and assumes a LLMIR ratio of 10 (for an M82 like SED, Vigroux et al. 1999). The SFR(FIR) estimates turn out to be a factor of 5 to 50 higher than the SFR estimates inferred from the non-extinction corrected Hα. However, if we apply the correction factor of 4 we deduced for the Hα then SFR(FIR)SFR(Hα) 3, confirming that the extinction is much higher than can be predicted using (UV or) optical observations. Thus, ISOCAM galaxies are in fact actively star forming highly dust enshrouded galaxies. One exception is source ISOHDFS 38 for which we have evidence for the presence of a dominant AGN component (both from the LW2LW3 ratio and the H[NII] ratio).
Based on our SFR estimates, and the evidence for exinction presented in section 4.1 we conclude that ISOCAM galaxies are indeed dust enshrouded actively star-forming galaxies and not decaying post-starburst systems.
6 Conclusions
We have presented NIR spectroscopy, rest frame R-band, of a sample of ISO selected galaxies from the Hubble Deep Field South. We have detected Hα emission in almost all of them. The detections of the Hα line combined with the large Hα EWs are consistent with the idea that these galaxies are ongoing powerful dusty starbursts.
Using the observed Hα emission lines we estimate that the SFR rate in the ISOHDFS galaxies ranges between 2 and 50 M yr, far higher than those inferred from local Starbursts (Calzetti 1997) and local spirals (Kennicutt 1992). We have compared these rates of SF with the values estimated from the FIR luminosities, which are typically a factor 5 to 50 larger because of dust obscuration. We estimated the Hα extinction using standard extinction laws. The Hα extinction corrected SFR estimates are then higher although still fall short of the SFR estimates based on FIR luminosities ( SFR(FIR):50–400 M yr). This result demonstrates that it is very dangerous to derive star formation rates from UV or optical data alone since these wavelengths are susceptible to higher extinction. Thus a significant fraction of star formation is missed by optical surveys. We conclude that ISO has detected in the mid-IR the most active, luminous and dust-enshrouded starbursts at z 0.4-1.4, which would have remained otherwise unnoticed by optical surveys. This population of strongly evolving active dusty starbursts is likely to account for a substantial fraction of the FIRsubmm background (Elbaz et al. 2000, in preparation).
References
- (1) Aussel, H., Cesarsky, C.J., Elbaz, D., Starck, J.L., 1999 A&A 342, 313
- (2) Barger, A.J., Cowie, L.L., Trentham, N., Fulton, et al., 1999 AJ 117, 102
- (3) Calzetti, D., 1997, AJ, 113, 162
- (4) Coleman, G.D., Chi-Chao, W., Weedman, D.W., 1980, ApJS 43, 393
- (5) Fioc, M., Rocca-Volmerange, B., 1997, A&A 326, 950
- (6) Flores, H., Hammer, F., Thuan, T.X., Cesarsky, C., 1999, Ap.J., 517, 148
- (7) Dressler, A., Smail, I., Poggianti, B.M., Butcher, H., et al. 1999, astroph9901263
- (8) Elbaz, D., Cesarsky, C.J., Fadda, D., Aussel, H., et al., 1999, A&A 351, L37
- (9) Hauser, M.G., Arendt, R.G., Kelsall, T., 1998, ApJ 481, 49
- (10) Kennicutt, R.C., 1992, Ap.J., 388, 310
- (11) Kennicutt, R.C., 1998, Ann. rev. Astr. Ap. 36, 189
- (12) Kessler, M.F., et al., 1996, A&A 315, L27
- (13) Leitherer, C., et al., 1999, ApJS 123, 3
- (14) Liu, C.T., Kennicutt, R.C., 1995, Ap.J., 450, 547
- (15) Moorwood, A.F.M., et al., 1998, Msngr 74, 7
- (16) Poggianti, B.M., 1997, A&A Suppl. 122, 399
- (17) Poggianti, B.M., Wu, H., 2000, Ap.J. 529, 157
- (18) Puget, J-L., Abergel, A., Bernard J-P., Boulanger, F., Burton W.B., et al., 1996, A&A 308, L5
- (19) Oliver, S., et al., 2000, MNRAS, in press
- (20) Rigopoulou, D., et al, 1996, A&A, 305, 747
- (21) Sternberg, A., 1998, ApJ, 506, 721
- (22) Vigroux, L., et al. 1999, in : “The Universe as seen by ISO” eds. P. Cox and M.F. Kessler, ESA SP-427, 805
- (23) Wu, H., Zou, Z.L., Xia, X.Y., Deng, Z.G., 1998, A&AS, 127, 521
FIGURES
ISOHDFS-VLT spectra
EW(OII) – EW(HNII)
| name | Exp. | zspec | Hmag | F(Hα)1 | EW(H[NII]) | L(Hα) | L(FIR) |
|---|---|---|---|---|---|---|---|
| F([NII])1 | EW([NII]) | ||||||
| (sec) | (mag) | Ȧ | |||||
| ISOHDFS16 | 3720 | 0.62 | 20.73 | 1.17 | 45 | 0.29 | 0.54 |
| ISOHDFS23 | 3720 | 0.46 | 19.26 | 1.86 | 50 | 0.23 | 2.5 |
| ISOHDFS25 | 3720 | 0.59 | 19.80 | 3.12 | 1105 | 0.67 | 2.0 |
| 0.72 | 35 | ||||||
| ISOHDFS27 | 3720 | 0.58 | 18.39 | 3.28 | 47 | 0.71 | 1.61 |
| ISOHDFS28 | 3720 | 0.56 | 20.36 | 0.78 | 47 | 0.16 | 0.77 |
| ISOHDFS38 | 7400 | 1.39 | 21.67 | 1.95 | 355 | 3.62 | 23.0 |
| 4.22 | 50 | ||||||
| ISOHDFS39 | 7400 | 1.27 | 20.95 | 7.13 | 67 | 10.4 | 6.15 |
| ISOHDFS434 | 3720 | – | 21.92 | – | – | – | – |
| ISOHDFS53 | 3720 | 0.58 | 19.47 | 6.08 | 705 | 1.32 | 1.53 |
| 2.8 | 50 | ||||||
| ISOHDFS55 | 3720 | 0.76 | 20.05 | 2.41 | 40 | 0.98 | 1.27 |
| ISOHDFS60 | 7400 | 1.23 | 20.63 | 2.73 | 44 | 3.69 | 2.42 |
| ISOHDFS62 | 3720 | 0.73 | 20.67 | 2.54 | 62 | 0.95 | 1.19 |
| name | SFR(Hα) | SFR(FIR) |
|---|---|---|
| uncorrected for extinction | based on FIR estimates | |
| ISOHDFS16 | 1.5 | 14 |
| ISOHDFS23 | 1.2 | 65 |
| ISOHDFS25 | 3.5 | 52 |
| ISOHDFS27 | 3.6 | 42 |
| ISOHDFS28 | 0.8 | 20 |
| ISOHDFS38 | 18 | 600 |
| ISOHDFS39 | 52 | 160 |
| ISOHDFS53 | 7.0 | 40 |
| ISOHDFS55 | 5.0 | 33 |
| ISOHDFS60 | 18.5 | 63 |
| ISOHDFS62 | 4.8 | 31 |