Multiperiodicity in semiregular variables
Abstract
We present a detailed lightcurve analysis for a sample of bright semiregular variables based on long-term (70–90 years) visual magnitude estimates carried out by amateur astronomers. Fundamental changes of the physical state (amplitude and/or frequency modulations, mode change and switching) are studied with the conventional Fourier- and wavelet analysis.
The light curve of the carbon Mira Y Per showing a gradual amplitude decrease has been re-analysed after collecting and adding current data to earlier ones. The time scales of the sudden change and convection are compared and their similar order of magnitude is interpreted to be a possible hint for strong coupling between pulsation and convection. The periods of the biperiodic low-amplitude light curve and their ratios suggest a pulsation in the first and third overtone modes. An alternative explanation of the observed behaviour could be a period halving due to the presence of weak chaos.
Beside two examples of repetitive mode changes (AF Cyg and W Cyg) we report three stars with significant amplitude modulations (RY Leo, RX UMa and RY UMa). A simple geometric model of a rotationally induced amplitude modulation in RY UMa is outlined assuming low-order nonradial oscillation, while the observed behaviour of RX UMa and RY Leo is explained as a beating of two closely separated modes of pulsation. This phenomenon is detected unambiguously in V CVn, too. The period ratios found in these stars (1.03–1.10) suggest either high-order overtone or radial+non-radial oscillation.
Key Words.:
stars: pulsation – stars: AGB1 Introduction
Semiregular stars (SRVs) of type SRa and SRb are pulsating red variables on the asymptotic giant branch (AGB) of the Hertzsprung-Russell diagram. According to the definition in the General Catalogue of Variable Stars (GCVS), their visual amplitude does not exceed 2.5 mag and the light variation is not as strictly cyclic as in Mira stars. The attribute “semiregular” refers to the complexity of their light curves, which has been usually interpreted as being caused by cycle-to-cycle variations in a relatively simple pulsating environment. There has been an increasing amount of empirical evidence that multiperiodicity occurs is some stars (Mattei et al. 1998, Kiss et al. 1999 – Paper I), which suggests the existence of many simultaneously excited modes of pulsation. Lebzelter (1999) and Lebzelter et al. (2000) presented radial velocity measurements and their comparison with simulteneous light curves for several bright semiregular variables, which confirmed that main periodicities are most likely due to pulsation and partly due to large-scale motions in the extended atmospheres of red giants.
From the observational point of view, the main parameters characterizing the pulsation are as follows: periods and amplitudes, the number of excited modes, their nature (radial or non-radial) and orders (in case of overtone pulsation). Fundamental changes of these parameters (e.g. mode-switching, repetitive turning on and off of different modes, long-term amplitude or frequency modulations) may indicate incomplete understanding of the physical processes governing the pulsation and stellar evolution. Mode-changes were reported in several stars (Cadmus et al. 1991, Percy & Desjardins 1996, Bedding et al. 1998, Kiss et al. 1999), however, no firm conclusion was drawn about the responsible physical mechanism. Since these red giants have extended convective envelopes around the stellar cores, earlier linear stability surveys (e.g. Fox & Wood 1982, Ostlie & Cox 1986), ignoring or oversimplifying the coupling between convection and pulsation, may suffer from serious incompleteness. Xiong et al. (1998) performed linear survey treating the dynamic and thermodynamic couplings by using a statistical theory of nonlocal and time-dependent convection and outlined the “Mira” pulsational instability region (see also Gautschy 1999). Their calculations support the possible existence of high-order (up to 3rd and 4th) overtone modes, which has been suggested by empirical studies, e.g. Percy & Parkes (1998), Kiss et al. (1999).
| GCVS | IRAS | Type | Dataset(s) | Periods |
|---|---|---|---|---|
| [JD+2400000] | [days] | |||
| RS Aur | – | SRa | 28485 – 50890 (AFOEV, VSOLJ) | 173, 168 |
| V CVn | 13172+4547 | SRa | 37600 – 51208 (AAVSO) | 194, 186 |
| 23808 – 50907 (AFOEV, VSOLJ, HAA/VSS) | ||||
| W Cyg | 21341+4508 | SRa | 17404 – 50902 (AFOEV, VSOLJ, HAA/VSS) | 240, 130 |
| AF Cyg | 19287+4602 | SRb | 22456 – 50902 (AFOEV, VSOLJ, HAA/VSS) | 921, 163, 93 |
| RY Leo | 10015+1413 | SRb | 28598 – 50933 (AFOEV, VSOLJ, HAA/VSS) | 160, 145 |
| Y Per | 03242+4400 | M | 37602 – 51210 (AAVSO) | 245, 127 |
| 23057 – 51547 (AFOEV, VSOLJ, HAA/VSS) | ||||
| RX UMa | 09100+6728 | SRb | 17689 – 50808 (AFOEV, VSOLJ, HAA/VSS) | 201, 189, 98 |
| RY UMa | 12180+6135 | SRB | 37600 – 51208 (AAVSO) | 305, 287 |
The first part of this series addressed the general properties of semiregular variables of types SRa and SRb based on a set of semiregulars containing almost 100 stars. A few special cases were reported to illustrate such phenomena as long-term amplitude modulations, amplitude decrease and mode switching. In the meantime, new and newly computerized archive data were added to those analysed previously; therefore, some of the special cases in Paper I are worth studying in more details. The main aim of this paper is to discuss the observed changes of the pulsational properties through well-observed light curves in terms of multimode pulsation, possible non-radial modes, coupling between oscillation and/or rotation and convection. Also, we want to extend the list of stars with such phenomena and to point out that the discussed behaviours are much more common in red semiregulars than was thought earlier. The paper is organised as follows. Sect. 2 deals with the observations and basic data handling, Sect. 3 contains the results on the individual variables, while a brief summary is given in Sect. 4.
2 Observations
The presented results are based on long-term visual observations for eight stars carried out by amateur astronomers. The data were extracted from the same international databases as in Paper I (Association Francaise des Observateurs d’Etoiles Variables – AFOEV, Variable Star Observers’ League of Japan – VSOLJ, American Association of Variable Star Observers – AAVSO, Hungarian Astronomical Association/Variable Star Section – HAA/VSS). In the meantime newly computerized historic and very recent data, collected by the AAVSO111http://www.aavso.org and VSNET222http://www.kusastro.kyoto-u.ac.jp/vsnet, have been added to the earlier observations. The data were analysed with the conventional Fourier and wavelet analysis after calculating 5-day or 10-day bins of visual light curves depending on the length of the most characteristic period (see details and references in Paper I). The list of programme stars and details on the datasets are presented in Table 1.
3 Results on the individual variables
3.1 Changing the type of variability: Y Persei
Y Per is a well-known carbon Mira star, though its period (about 250 days) is the shortest one among them (Groenewegen et al. 1998). There was no indication of peculiarity until 1987, when its amplitude dropped significantly. Furthermore, it fits exactly the PL relation of galactic carbon LPVs (Bergeat et al. 1998), thus this star has been considered as a typical member of its type.
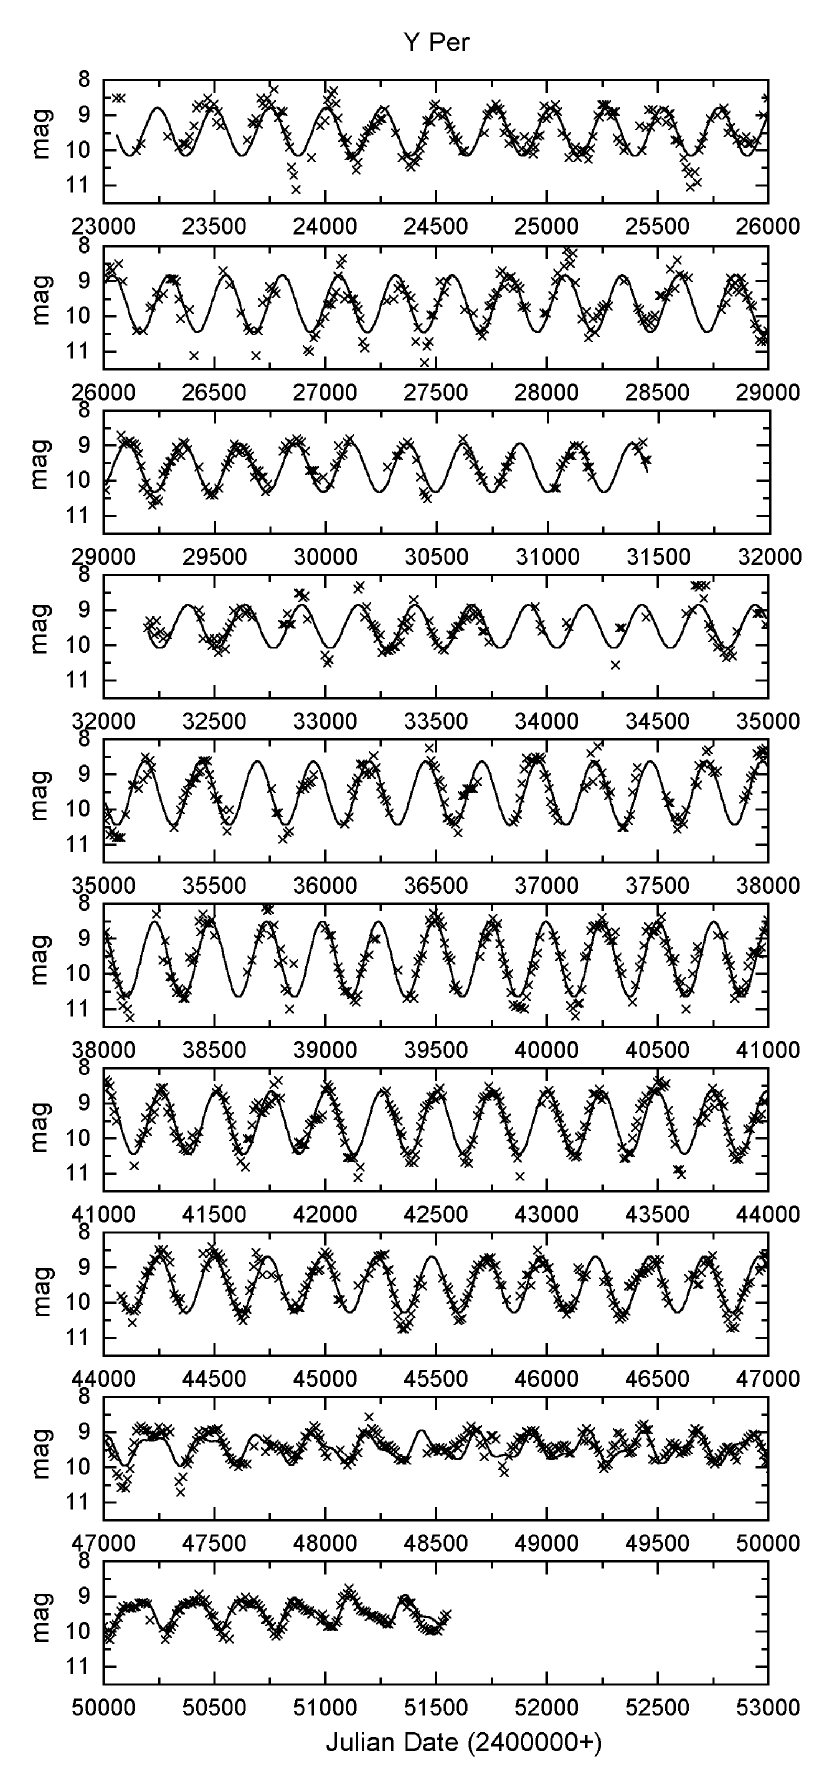
However, as has been pointed out in Paper I, the appearance of the visual light curve changed dramatically around JD 2447000 (1987). The earlier Mira-type variations disappeared and were replaced by a semiregular and low-amplitude brightness change. In order to trace the time-dependent variations and quantify the sudden change, we performed a detailed lightcurve analysis utilizing subsets of the whole dataset.
The finally merged and averaged light curve covers 28500 days (more than 110 cycles). There are smaller gaps in the fist half of the data, while the second half is completely continuous. We divided the data into eight 3000 day-long segments (each containing about 12 cycles) and one 4500 day-long segment. This enabled an accurate period determination in every segment avoiding the possible period smearing due to its long-term variation. The period was calculated with the conventional Fourier-analysis and was checked independently with a non-linear regression analysis.
Data in the first eight segments can be described very well with only one harmonic, but the last one with a two-component harmonic sum. None of the residuals shows significant periodic signals. The fitted curves are plotted in Fig. 1, while the resulting parameters are presented in Table 2. Although the formal standard errors are quite small, the real uncertainties are a little larger, most probably due to the intrinsic variations of Y Per. Therefore, we adopted a period uncertainty of 1 day and an amplitude error of 0.05 mag.
| No. | |||
|---|---|---|---|
| (s.e.) | (s.e.) | ||
| 1 | 3.950 (0.080) | 253.2 | 0.67 (0.09) |
| 2 | 3.915 (0.009) | 255.4 | 0.81 (0.03) |
| 3 | 3.954 (0.007) | 252.9 | 0.69 (0.03) |
| 4 | 3.930 (0.012) | 254.5 | 0.63 (0.04) |
| 5 | 3.953 (0.006) | 253.0 | 0.91 (0.03) |
| 6 | 3.959 (0.004) | 252.6 | 1.07 (0.03) |
| 7 | 4.023 (0.005) | 248.6 | 0.89 (0.02) |
| 8 | 4.058 (0.005) | 246.4 | 0.80 (0.02) |
| 9 | 4.095 (0.005) | 244.2 | 0.36 (0.02) |
| 7.864 (0.012) | 127.2 | 0.16 (0.02) |
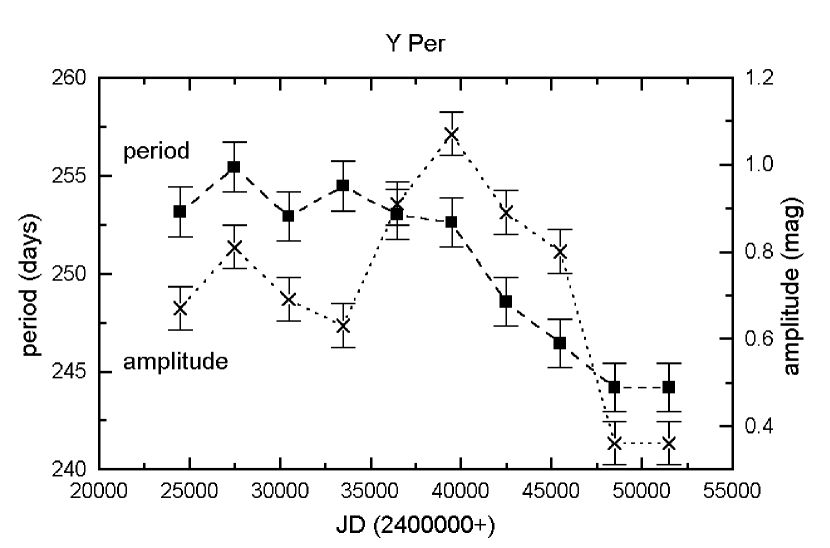
The amplitude and period changes seem to be well correlated as shown in Fig. 2., which is a well-known property of non-linear oscillators. A further interesting point is that the secondary period occuring in the last segment is exactly the half of the earlier dominant period within the error bars (the mean period in the first six segments is 253.8 days). Although it can be pure numeric coincidence, we will shortly discuss the possible relevance of this period halving.
As has been mentioned in Paper I, the abruptness of this amplitude change is quite surprising. The characteristic time scale of the amplitude decrease in other stars (V Boo - Szatmáry et al. 1996, R Dor - Bedding et al. 1998, RU Cyg - Paper I) varies from few hundred to few thousand days, typically tens of pulsation cycles. In Y Per the change happened in 400 days, between JD 2447200 and 2447600, or less than 2 cycles. Adopting a pulsational approach, it can be interpreted as a fast appearance of a new mode beside a slightly changing dominant mode. Recent models by Xiong et al. (1998) suggest a first and third overtone combination (observed periods: 245 and 127 days; theoretical prediction: P1=231 days, P3=130 days). According to Xiong et al. (1998), the coupling between convection and pulsation depends critically on the ratio of the timescale of convective motion and that of pulsation. The effect is stronger for overtone oscillation, as the turbulent viscosity becomes the main damping mechanism of the high overtones (it converts the kinetic energy of ordered pulsation into random kinetic energy). There have been a considerable number of theoretical and observational efforts in order to quantify this coupling and to detect observables related to it. Anand & Michalitsanos (1976) have already formulated a simple nonlinear model assuming that the convective envelope of M giants is composed of giant convection cells comparable in size to the stellar radius. They showed that the coupling can produce asymmetric fluctuations of the entire star. Such large perturbations may cause also fast changes in the pulsational properties. The earlier theoretical models are supported by modern high-resolution spectroscopic observations. Nadeau & Maillard (1988) observed velocity gradients of a few km s-1 for lines of different excitation potentials, which was interpreted as being caused by convective motions. Most recently, Lebzelter (1999) presented such radial velocity measurements of semiregular variables, which implied the possibility of large convective cells with radial motions close to a few km/s. A simple estimate of the convective time scale can be found from the ratio of the thickness of the convective envelope and the observed order of magnitude of convective velocity. For 100 R⊙ and 1 km s-1 one get a result of 800 days being close to the duration of sudden changes in SRVs. Unfortunately, present instability surveys cannot calculate the amplitude of pulsation and, consequently, its long-term variation can be interpreted only speculatively.
We note that the first and third overtone model is very similar to that derived for R Dor by Bedding et al. (1998). They concluded in this instance that the rapid changes can be described very well with chaotic effects discussed by Icke et al. (1992). Furthermore, the period halvings noted above might be another hint for the presence of weak chaos. It can be interpreted as an inverse process of the period doubling bifurcation which may happen just beyond the onset of chaos (Kovács & Buchler 1988). It has been shown in a number of papers (e.g., Kovács & Buchler 1988, Saitou & Takeuti 1989, Moskalik & Buchler 1990), that different stellar pulsation models (W Vir, RV Tau, yellow semiregulars) show period doubling bifurcation leading from a regular to a quite irregular variation. Although the behaviour of Y Per does not fit exactly the proposed way of transition from regular to irregular state through cascades of period doubling bifurcations (and simultaneous noisy period halvings), this kind of explanation cannot be excluded.
Finally, the conventional classification of long period variables (LPVs) into Mira and SRa, SRb, and SRc type semiregular variables, as given in the GCVS, is not based on physical parameters and does not adequately cover even the behavior of some of the brightest and most studied LPVs. This has been improved by Kerschbaum & Hron (1992) by involving the ‘blue’ and ‘red’ subgroups of semiregulars. The SRa stars seem to form a mixture of intrinsic Mira and SRb variables. For Mira stars no similar definition using various stellar parameters exists. Unfortunately, the fact that Y Per does not fit neither of main types of LPVs (Mira and semiregular), does not uncover the underlying physical processes being responsible for its peculiarity.
3.2 Amplitude modulation I.: beating in RX Ursae Majoris and RY Leonis
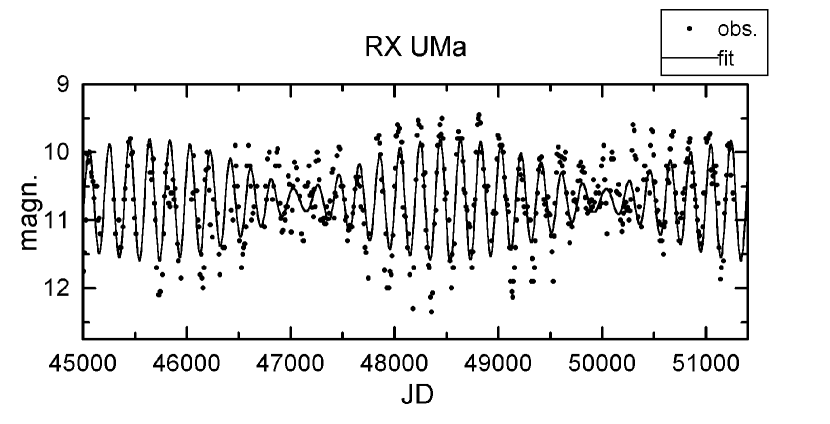
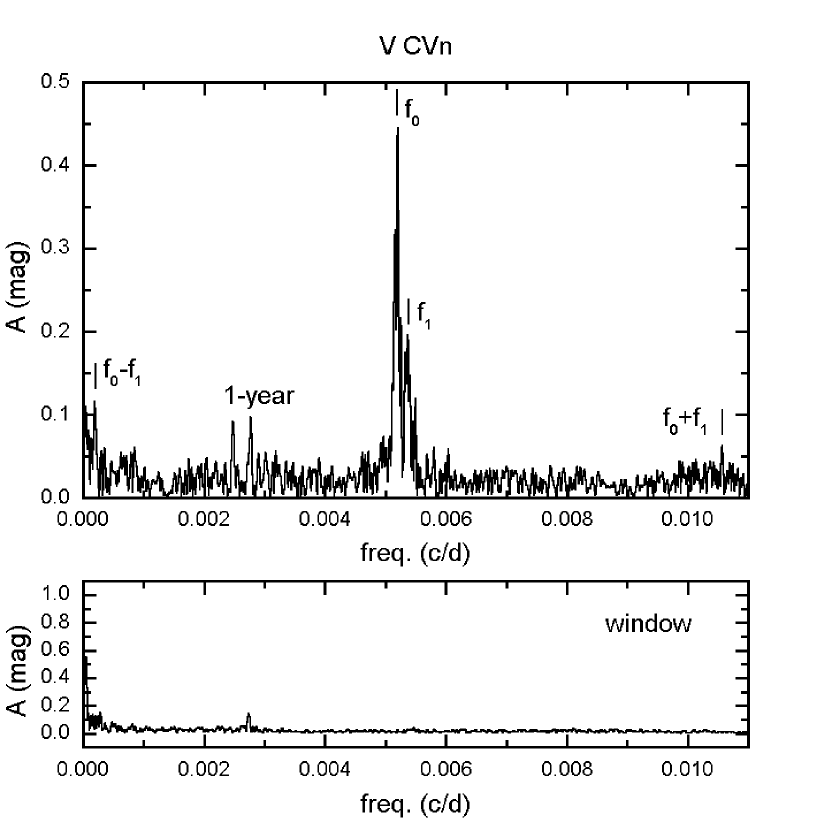
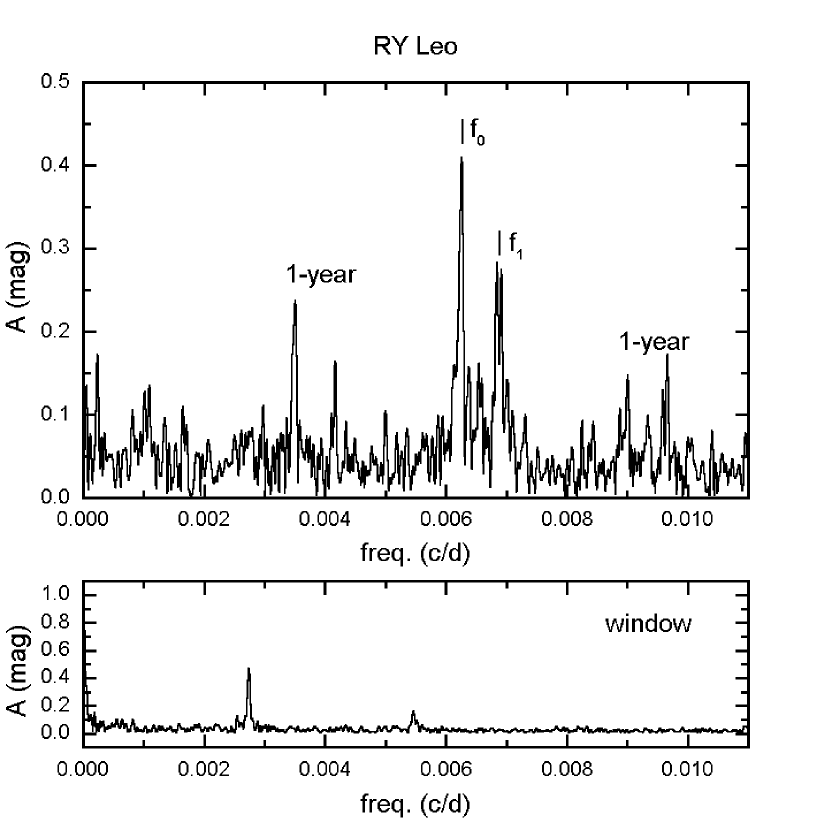
In Paper I we presented eight stars with closely separated frequencies. A few of them are triply periodic stars, in which mode changes occur quite frequently (see Sect. 3.4) and the close frequency components do not exist simultaneously. However, we found two variables with stable biperiodic variation, where various subsets show the same frequency content (V CVn and RY Leo). In those cases the amplitudes of components are quite different, therefore, no clear beating occurs, as in RX UMa. We plotted a typical subset of the light curve of RX UMa in Fig. 3 where a three-component fit is also shown (f0=0.005000 c/d, A0=0.37 mag, f1=0.005288 c/d, A1=0.26 mag, f2=0.010236 c/d, A2=0.16 mag). The frequency spectrum of the whole dataset is plotted in Fig. 4.
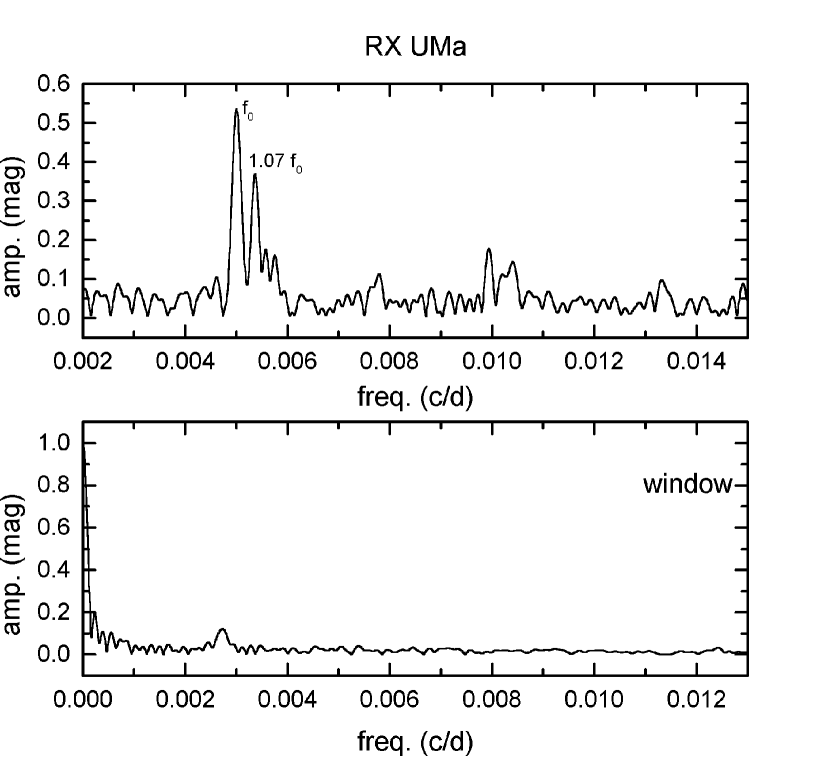
If these frequencies have pulsational origin, then their ratios (f1/f0=1.06, f2/f1=1.93) may give information about the mode of pulsation. Period ratios near 1.9 are very common in semiregular variables (see Paper I and Mattei et al. 1998) which was identified in case of R Dor to correspond to the first and third overtones (Bedding et al. 1998). Period ratios close to 1 may suggest high (3-5th) overtones, but theoretical calculations suggest strong damping in this mode domain (Xiong et al. 1998). Mantegazza (1988) found similar close frequency doublet in the red semiregular Z Sge and using models by Fox & Wood (1982) speculated about the possibility of second and third overtones. It is also possible, that one of the frequencies correspond to a non-radial mode (e.g. Loeser et al. 1986), but not much is known about the non-radial pulsation of red giant stars. In the other two stars mentioned earlier there are also two closely-spaced periods, which are demonstrated by the DFT spectra in Figs. 5-6. Note, that in V CVn even the cross-production terms (f0f1) are present unambiguously.
3.3 Amplitude modulation II.: pulsation + rotation in RY Ursae Majoris?
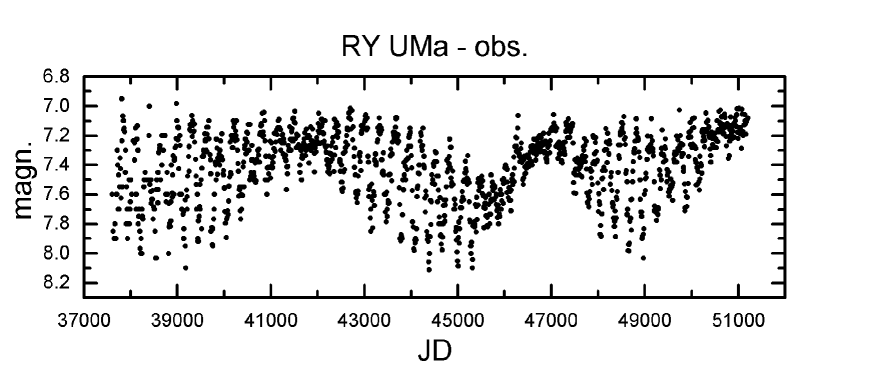
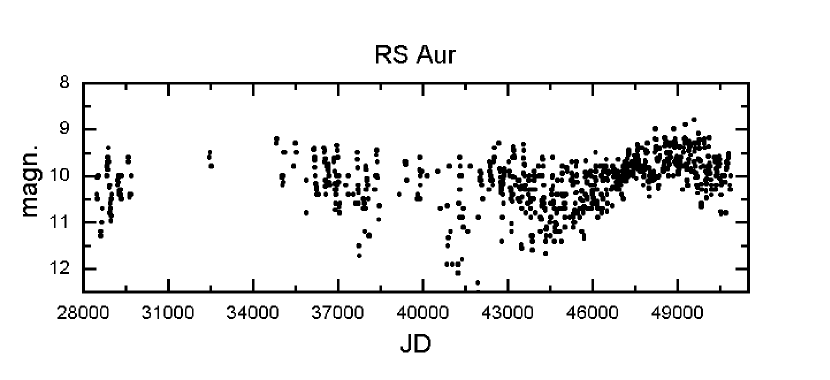
The amplitude modulation discussed in the previous subsection can be simply described by the beating of two close frequencies, since the mean brightness did not change with time in those stars. However, RY UMa (and partly RS Aur) shows amplitude variations which highly resembles those observed in RR Lyrae variables with Blazhko effect, where the minimum brightness changes much more significantly, than the maximum brightness. Therefore, a significant mean brightness variation can be observed.
This interesting light curve variation has been highlighted in Paper I, where a 9800-day segment was analysed. In the meantime, historical AAVSO observations were added, extending the light curve to a whole length of 17000 days. Unfortunately, the early light curve during the first 3000 days has a less dense coverage, thus the most homogeneous data cover about 14000 days. The corresponding averaged light curve is shown in Fig. 7. In our sample of 93 stars studied in Paper I this behaviour is quite rare, only RS Aur seems to have similar light curve phenomenon (Fig. 8).
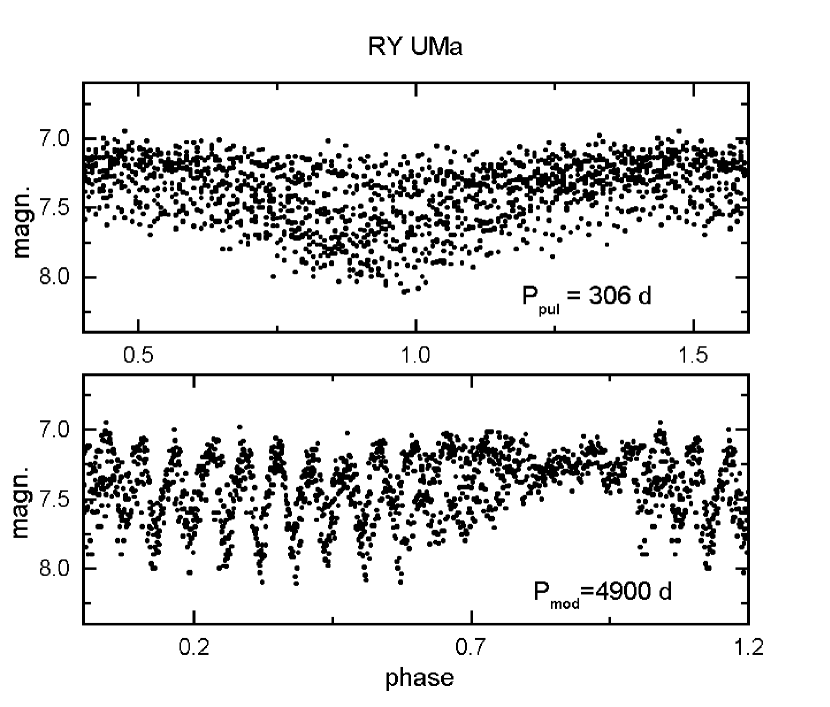
We have tried to explain the observed amplitude modulation with rotational effects. Earlier theoretical studies have generally neglected the stellar rotation, since typical rotational periods of red giants, usually obtained theoretically, are about 4000–10000 days, much longer than the characteristic times of pulsation. However, RY UMa shows such complex light variation and frequency spectrum (see later), that a possible explanation could be the rotation-pulsation connection. The amplitude variations turned out to be highly repetitive, which is shown in Fig. 9, where the light curve has been folded with two periods (Ppul=306 days, Pmod=4900 daysPpul).
We have tried to build a simple model, which involves a rotationally modulated non-radial oscillation. Our very approximate model consists of: i) a distorted stellar shape caused by a low-order non-radial oscillation; ii) stellar rotation with a period of 9800 days (i.e. twice of the period of modulation); iii) simple limb darkening (u=0.6). We have considered a triaxial ellipsoid having a short axis of unity, while the other axes change sinusoidally in time between 1.0–2.0 and 1.75–2.0 with the period of pulsation (306 days). The whole ovoid rotates and the intensity is integrated over the surface elements assuming normal limb darkening with coefficient u=0.6. The light curve is calculated as the logarithm of the change of the surface facing the observer.
All aspects of this approach can be, of course, easily challenged. The introduced distorsion in our model is much larger than that of predicted by traditional description of non-radial oscillations. However, there have been a number of high-resolution observations (imaging and interferometry) of nearby Mira variables showing substantial asymmetric structures (Tuthill et al. 1999, Lopez et al. 1997, Karovska et al. 1997), which imply the incompleteness of spherical assumptions. Furthermore, fully three dimensional and turbulent dynamic numerical simulations of red giant stars (Jacobs et al. 1998) also suggest occurence of bipolar atmospheric motions and distorted stellar (photospheric) shape. Thus, we conclude, that it may be possible that the assumed maximum oblateness for RY UMa is not completely unlikely.
The second aspect is stellar rotation. Asida & Tuchmann (1995) explored theoretically the asymmetric mass-loss from rotating red giant variables and presented a scenario for an anisotropic mass ejection from AGB variables caused by rotational effects. Further support of rotationally induced variations in red giants was given by Barnbaum et al. (1995), who suggested a possible connection between rapid rotation (P 530 days) and pulsation in the carbon star V Hya (type SRa). In our case there is no need for assuming unusual rotation, since the required rotational period (9800 days) is in the range of what we expect for such extended and evolved objects as red giants.
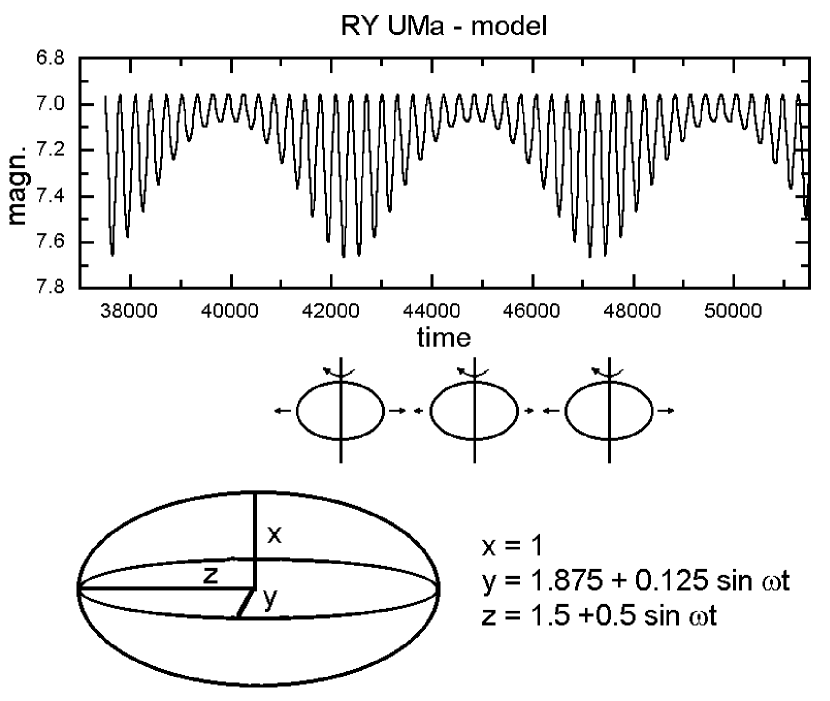
The weak point in our model is the neglect of temperature variations along the pulsation and the assumption of constant (and solar) value for the limb-darkening coefficient. The latter is less significant, because even completely neglecting the limb darkening (i.e. using a uniform disk) does not change the calculated light curve significantly. This is especially fortunate keeping in mind dynamical model analyses by Beach et al. (1988), performed in order to determine limb darkening/brightening function for Mira atmospheres, which illustrated that the usual limb darkening correction of uniform disk model in lunar occultation measurements can be even in the wrong direction in certain pulsational phases. The temperature variations could not be taken into account, since we have no information neither about its range nor about its phase dependence. The strong non-radial assumption would imply weaker temperature effects, but without any kind of phase dependent temperature measurements, we cannot draw a firm conclusion. Nevertheless, our main purpose is rather to get a qualitative “fit” of the observed behaviour than to quantitatively model a visual light curve. A graphical representation of the model and the resulting light curve is given in Fig. 10.
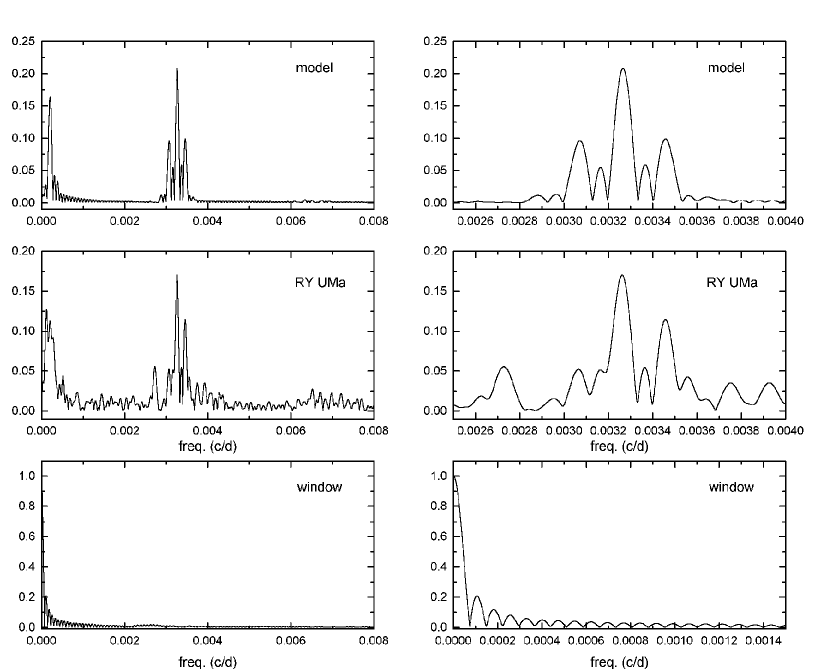
The resulting model light curve was compared with the observed one through their frequency spectra. This comparison can be seen in Fig. 11, where the corresponding Fourier spectra are shown. Beside the overall similarity the most striking feature is the frequency splitting of the main component at f0=0.003268 c/d. Such a splitting has been well-known behaviour in pulsating white dwarfs and roAp stars (e.g. Shibahashi & Saio 1985, Buchler et al. 1995, Kurtz et al. 1996, Baldry et al. 1998), while recently it has been detected in several RRab stars showing Blazhko effect (e.g. Kovács 1995, Nagy 1998, Chadid et al. 1999) and in a number of MACHO RRc variables (Alcock et al. 2000). One of the commonly accepted views is the oblique pulsator model, where a non-radial oscillation is coupled with the rotation, as the rotational axis does not coincide with the symmetry axis of pulsation (Shibahashi 1999). In the case of RY UMa, a frequency triplet is present with 0.0002 c/d, which correspond to the frequency of amplitude modulation. Also, the triplet has an asymmetric amplitude distribution with respect to the central frequency peak. Similar asymmetry can be attributed to intrinsic nonlinear mechanisms (Buchler et al. 1995), that seems to be quite likely in a highly non-spherical environment. We note the presence of a peak at 0.00273 c/d corresponding exactly to one year. This is little surprising, because the light curve has no seasonal gaps (it is circumpolar from Europe, Japan and North America), therefore a such alias peak is not expected. A possible reason for this could be the seasonal increase of the scatter, since despite its circumpolarity it is more difficult to observe near the horizon.
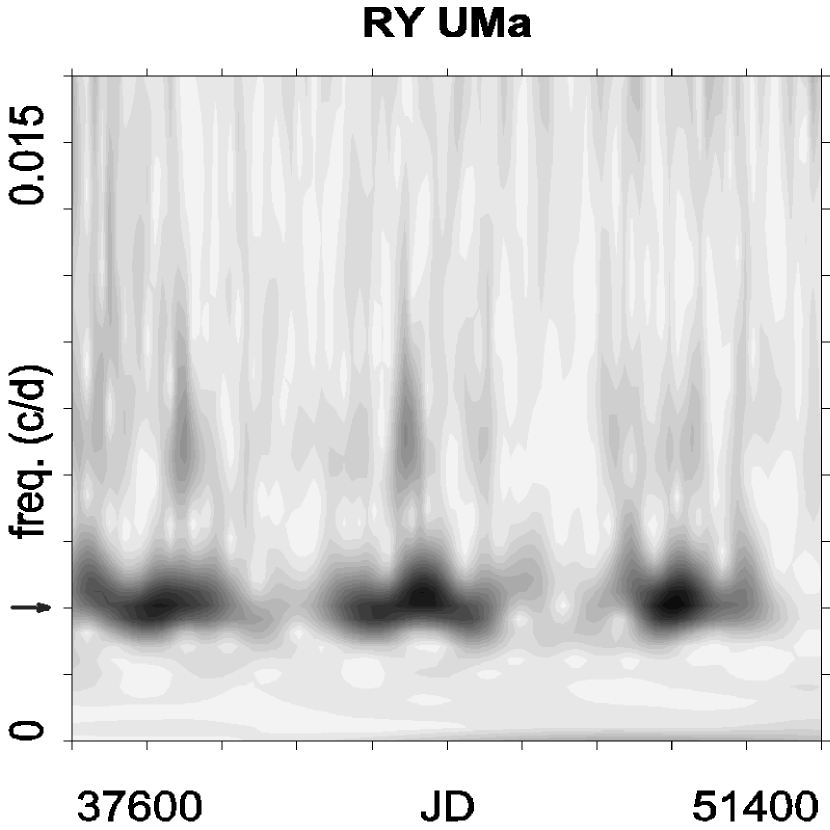
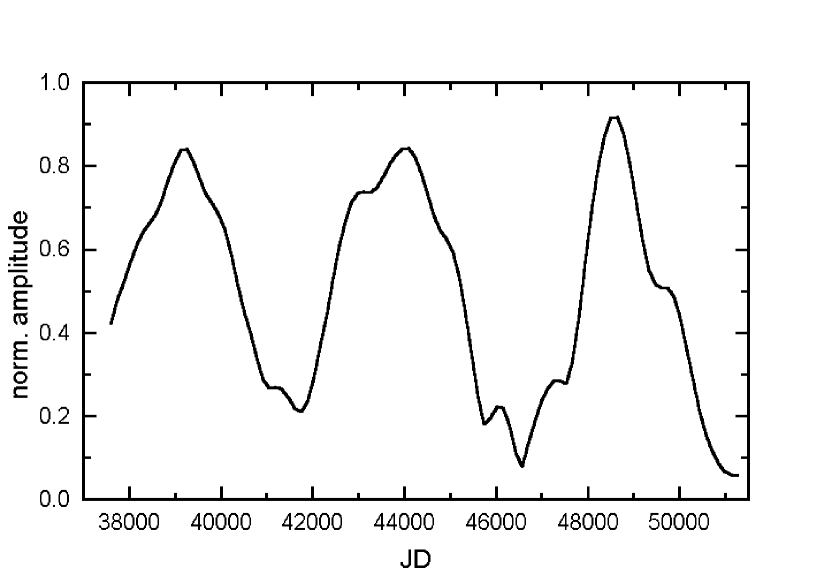
We give further illustration of the amplitude variations by the wavelet transform shown in Fig. 12. This time-frequency analysing method is quite successful in quantifying the time-dependent variations in astronomical time series (see, e.g., Szatmáry et al. 1994, Szatmáry et al. 1996, Foster 1996 and Paper I). The overall pattern is quite systematic suggesting the regularity of the underlying process(es). The amplitude of the main ridge has been extracted along the time axis in order to plot its variations in Fig. 13. Our conclusion is that despite the local irregularities of the visual light curve (see the larger scatter in the bottom panel of Fig. 9 between =0.6–0.8), the amplitude modulation implies a regular physical process, e.g. rotation or binarity. In this paper we adopted to rotation, however, other possibilities cannot be excluded using the presently available observations.
3.4 Amplitude variations due to repetitive mode changes: W Cygni, AF Cygni
W Cyg and AF Cyg are two of the most popular and well-observed semiregular stars (e.g. Percy et al. 1993, 1996). These stars are two illustrative examples of repetitive mode changes, where some modes turn on and off on a time scale of few hundreds of days (a few cycles). This has been partly highlighted in Paper I, where TX Dra and V UMi were discussed in terms of varying dominant modes. In this paper we focus on two other stars, which further supports our belief that this phenomenon may be quite frequent in semiregular variables.
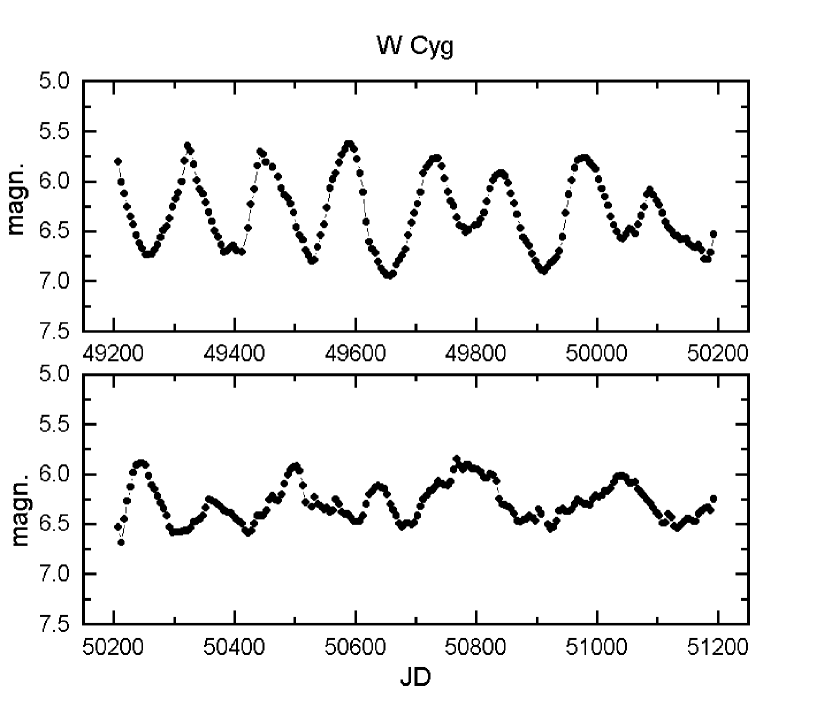
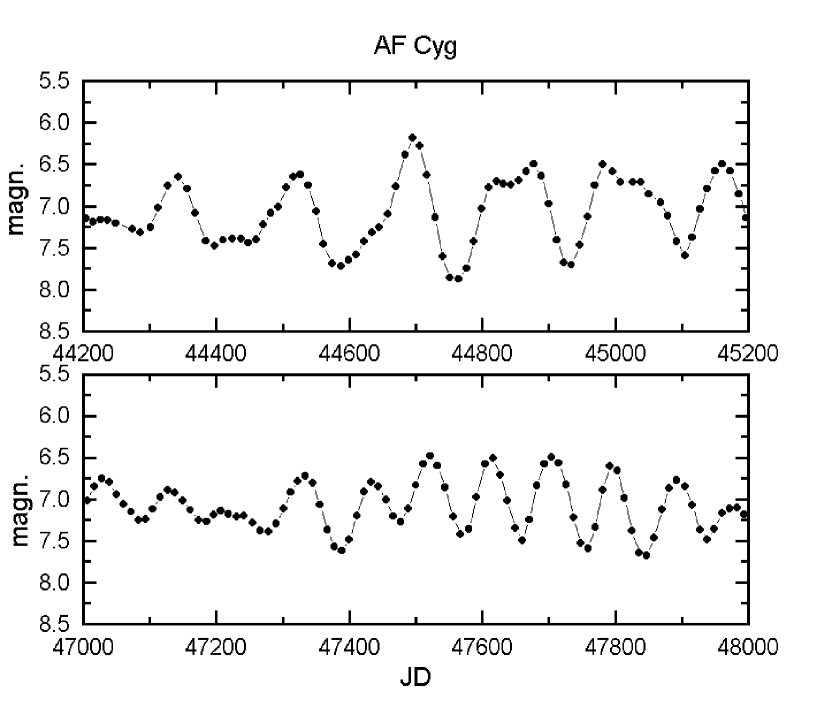
Both stars have continuous light curves covering more than 28000 days, which corresponds to 300 and 215 cycles for AF Cyg and W Cyg, respectively, considering their shorter periods (93 and 130 days). There are several occasions when their light curves completely change. This is illustrated in Figs. 14–15, where we plotted two 1000-days long subsets for both stars. The photometric behaviour (cycle lengths and their amplitudes) changes dramatically from time to time. The wavelet map of W Cyg (Fig. 16) and the cross sections of the main ridges (Fig. 17) clearly illustrate the amplitude variations. We obtained similar results with AF Cyg.
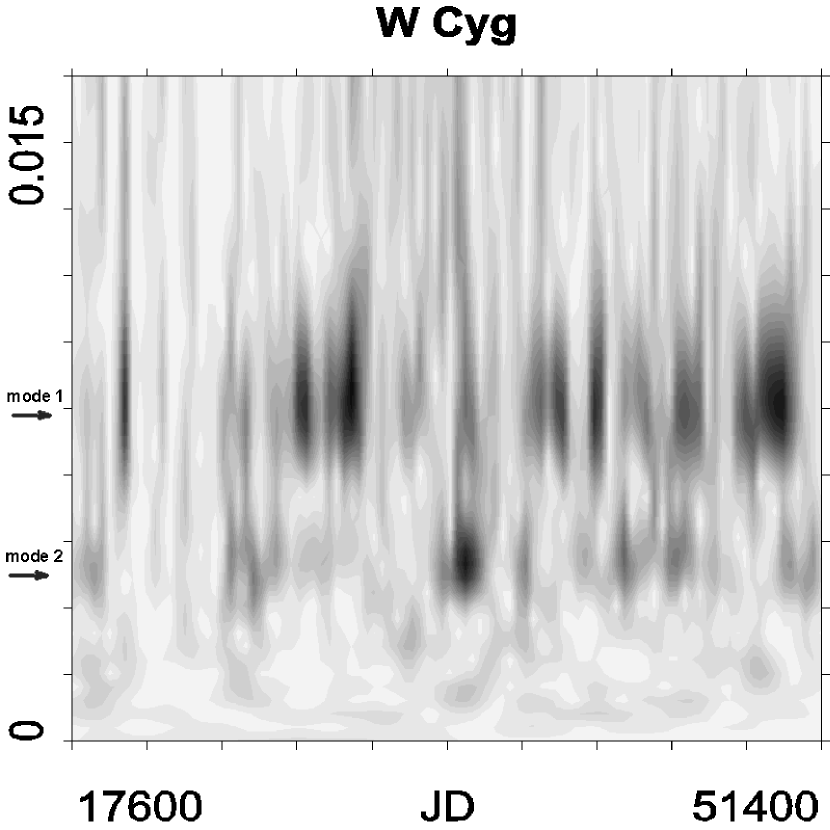
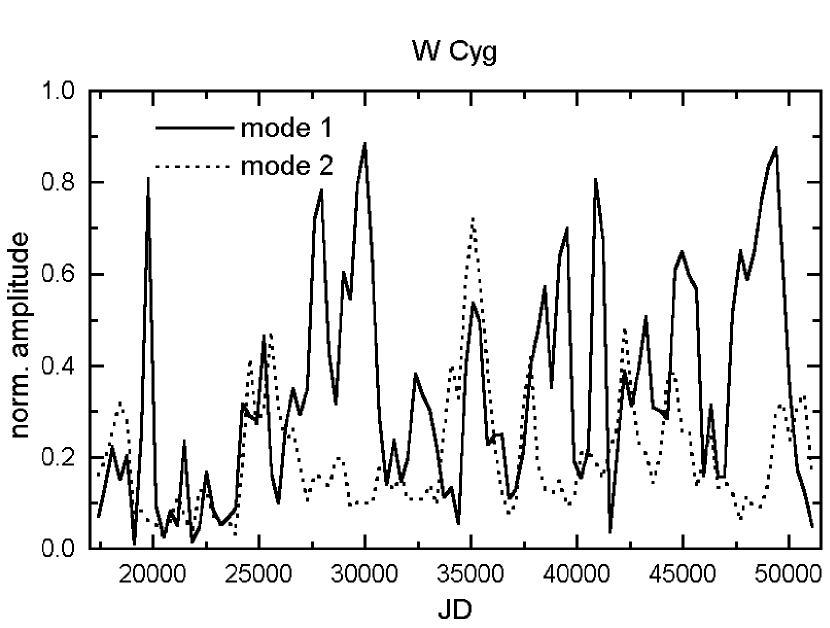
There are no obvious indications for periodicity in Fig. 17. However, a few important points can be drawn. The first is that the plotted amplitude changes should be considered real, as the light curve has no gaps after JD 2421000 (1916). Therefore, the repetitive amplitude decreases and increases are not numerical artifacts caused by the inappropriate data distribution (see Szatmáry et al. 1994 for testing the method with simulated light curves). The amplitude of the dominant mode (“mode 1”, P=130 days) changes on a time scale of 2000-3000 days. This may imply that the exciting mechanism of pulsation is intermittent and the damping is strong. The bimodal state (i.e. simultaneous high amplitudes of “mode 1” and “mode 2”) is quite rare. Furthermore, only weak hints are present for simultaneous or alternating modes suggesting different and independent excitations for the two modes corresponding to the first and third overtones in theoretical models of Xiong et al. (1998) – P1=231 days, P3=130 days.
As has been mentioned above, AF Cyg has similar unstable behaviour, only the periods (and possibly the modes) are different. The two main periods (163 days and 93 days) would suggest second and fourth overtones adopting models of Xiong et al. (1998) (P2=173 or 154 days, P4=103 or 91 days).
Finally, episodic amplitude and period changes were also reported for three semiregulars (RV And, S Aql, U Boo) by Cadmus et al. (1991), where the dominant period was the shorter one during the low-amplitude epsides. In addition, Mattei & Foster (2000), who studied long-term trends of period, amplitude, mean magnitude and asymmetry in the AAVSO light curves, reported several stars with such trends. But what we see here is completely different in W Cyg and AF Cyg, where the shorter period is mainly the dominant one with higher amplitude.
4 Conclusions and summary
Our conclusions based on the results presented in this paper can be summarized as follows.
1. We have re-analysed the light curve of the carbon Mira star Y Per complemented with the most recent observations. Its variation has been transformed from a monoperiodic oscillation to a bimodal one since 1987, which periods suggest first and third overtone pulsation. The suddennes of this switch is interpreted as a consequence of a strong coupling between pulsation and convection. We conclude that the unphysical classification scheme of LPVs (Mira and semiregulars) could be misleading when speculating on different evolutionary states of these variables. A simple distinction between monoperiodic and multiply periodic red variables may be more straightforward in some cases. Another important consequence of first plus third overtone assumption is that Y Per, a typical carbon Mira before 1987, has pulsated in the first overtone mode. That would imply short period Miras to pulsate in the first overtone, but no firm conclusion can be drawn on this issue based on only one star.
2. We report two stars (RX UMa and RY Leo) with significant amplitude modulation with no changes of the mean brightness. We have interpreted this behaviour as beating of two closely separated periods, most likely high-order radial or radial plus non-radial oscillation. Similar frequency doublet is reported for V CVn, confirming earlier results of Loeser et al. (1986). Unfortunately, there is no thorough theoretic study on the non-radial oscillations of red giants so far, thus we could only speculate on this explanation comparing semiregulars with other well-documented types of variables with similar close frequencies (i.e. Scuti and ZZ Ceti stars). However, the relatively large fraction of such SRVs in our sample of 93 stars implies that this phenomenon may be quite common in these stars.
3. We have also found another type of amplitude modulation resembling RR Lyrae variables with Blazhko effects in RY UMa and possibly in RS Aur. Again, since this aspect has no firm theoretic background yet, we assumed similar physical mechanism being responsible for similar light variations. Our qualitative model involving highly distorted stellar shape describes very well the observed modulation, though the initial physical assumptions may be considered quite unlikely. However, there are indications for oblate stellar shapes from high-resolution observations in several Mira stars and also there are empirical pieces of evidence for complex circumstellar structures around semiregular variables, though mainly observed in the infrared (Bergman et al. 2000, Kerschbaum & Oloffson 1999, Knapp et al. 1998). Further observation with high spatial and spectral resolution are highly recommended in order to clarify the situation.
4. Two bright semiregular stars, W Cyg and AF Cyg, are used to illustrate the repetitive excitation and damping of main modes of pulsation. The characteristic time scale is roughly 2000–3000 days. We have shown that only weak evidence is present for correlated or anticorrelated amplitude changes of different modes implying the possibility of independent excitation mechanisms. Theoretical pulsation models including the coupling between convection and pulsation were used to identify W Cyg and AF Cyg to be first+third and second+fourth overtone pulsators, respectively.
Acknowledgements.
We sincerely thank variable star observers of AFOEV, VSOLJ, HAA/VSS and AAVSO whose dedicated observations over many decades made this study possible. This research was supported by Hungarian OTKA Grants #F022249, #T022259, #T032258 and Szeged Observatory Foundation. The NASA ADS Abstract Service was used to access data and references.References
- (1) Alcock C. et al. (the MACHO Collaboration), 2000, ApJ, in press, (astro-ph/0005361)
- (2) Anand S.P.S., Michalitsanos A.G. 1976, Ap&SS 45, 175
- (3) Asida S.M., Tuchman Y. 1995, ApJ 455, 286
- (4) Baldry I.K., Kurtz D.W., Bedding T.R. 1998, MNRAS 300, L39
- (5) Barnbaum C., Morris M., Kahane C. 1995, ApJ 450, 862
- (6) Beach T.E., Willson L.A., Bowen G.H. 1988, ApJ 329, 241
- (7) Bedding T.R., Zijlstra A.A., Jones A., Foster G. 1998, MNRAS 301, 1073
- (8) Bergeat J., Knapik A., Rutily B. 1998, A&A 332, L53
- (9) Bergman P., Kerschbaum F., Olofsson H. 2000, A&A 353, 257
- (10) Buchler J.R., Goupil M-J., Serre T. 1995, A&A 296, 405
- (11) Cadmus R.R., Willson L.A., Sneden C., Mattei J.A. 1991, AJ 101, 1043
- (12) Chadid M., Kolenberg K., Aerts C., Gillet D. 1999, A&A 352, 201
- (13) Foster G. 1996, AJ 112, 1709
- (14) Fox M.W., Wood P.R. 1982, ApJ 259, 198
- (15) Gautschy A. 1999, A&A 349, 209
- (16) Groenewegen M.A.T., Whitelock P.A., Smith C.H., Kerschbaum F. 1998, MNRAS 293, 18
- (17) Icke V., Frank A., Heske A., 1992, A&A 258, 341
- (18) Jacobs M.L., Porter D.H., Woodward P.R. 1998, AAS 193, 4405
- (19) Karovska M., Hack W., Raymond J., Guinan E. 1997, ApJ 482, L175
- (20) Kerschbaum F., Hron J. 1992, A&A 263, 97
- (21) Kerschbaum F., Olofsson H. 1999, A&AS 138, 299
- (22) Kiss L.L., Szatmáry K., Cadmus Jr. R.R., Mattei J.A. 1999, A&A 346, 542 (Paper I)
- (23) Knapp G.R., Young K., Lee E., Jorissen A. 1998, ApJS 117, 209
- (24) Kovács G. 1995, A&A 295, 693
- (25) Kovács G., Buchler J.R. 1988, ApJ 334, 971
- (26) Kurtz D.W., Martinez P., Koen C., Sullivan D.J. 1996, MNRAS 281, 883
- (27) Lebzelter T. 1999, A&A 351, 644
- (28) Lebzelter T., Kiss L.L., Hinkle K.H. 2000, A&A, submitted
- (29) Loeser J.G., Baliunas S.L., Guinan E.F., Mattei J.A., Wacker S. 1986, in the Proceedings of “Cool Stars, Stellar Systems and the Sun”, Eds. M. Zeilik & D.M. Gibson, Springer, p.460
- (30) Lopez B., Danchi W.C., Bester M. et al. 1997, ApJ 488, 807
- (31) Mantegazza L. 1988, A&A 196, 109
- (32) Mattei J.A., Foster G. 2000, in the Proceedings of “Variable stars as Essential Astrophysical Tools”, ed. C. İbanoğlu, Kluwer Academic Publishers, Netherlands
- (33) Mattei J.A., Foster G., Hurwitz L.A. et al. 1998, in the Proceedings of the ESA Symposium “Hipparcos - Venice’97”, ESA SP-402, p.269
- (34) Moskalik P., Buchler J.R. 1990, ApJ 355, 590
- (35) Nadeau D., Maillard J.P. 1988, ApJ 327, 321
- (36) Nagy A. 1998, A&A 339, 440
- (37) Ostlie D.A., Cox A.N. 1986, ApJ 311, 864
- (38) Percy J.R., Ralli J.A., Sen L.V. 1993, PASP 105, 292
- (39) Percy J.R., Desjardins A. 1996, PASP 108, 847
- (40) Percy J.R., Desjardins A., Yu L., Landis H.J. 1996, PASP 108, 139
- (41) Percy J.R., Parkes M. 1998, PASP 110, 1431
- (42) Saitou M., Takeuti M. 1989, PASJ 41, 297
- (43) Shibahashi H., 1999, in the Proceedings of IAU Coll. 176 “The impact of large-scale surveys on pulsating star research”, Eds. L. Szabados & D.W. Kurtz, ASP Conf. Series, in press
- (44) Shibahashi H., Saio H. 1985, PASJ 37, 601
- (45) Szatmáry K., Vinkó J., Gál J. 1994, A&AS 108, 377
- (46) Szatmáry K., Gál J., Kiss L.L. 1996, A&A 308, 791
- (47) Tuthill P.G., Haniff C.A., Baldwin J.E. 1999, MNRAS 306, 353
- (48) Xiong D.R., Deng L., Cheng Q.L. 1998, ApJ 499, 355