THE OBSERVED MASS PROFILES OF DARK HALOS
AND THE FORMATION EPOCH OF GALAXIES
Abstract
We have determined the mass profiles of dark halos in 83 objects observed by ASCA. The point spread function of X-ray telescope was deconvoled by the Richardson-Lucy algorithm and the temperature profiles were calculated to obtain the mass profiles. The derived mass profiles are consistent with the NFW model in . We found a good correlation between the scale radius and the characteristic mass density , which indicates the self-similarity of dark halos. The spectrum index of primordial density fluctuation, , was determined from the slope of relation. For , our analysis gives with a confidence level of . The mass density of dark halos is a good indicator of the mean mass density of the universe at the time when the halos were assembled, . Assuming , we have determined the epoch when each dark halo was assembled. Our analysis indicates that the field elliptical galaxies and groups of galaxies formed approximately at and at respectively.
1 Introduction
Early on, the density fluctuation grows linearly as the universe expands, . Once a density enhancement of a spherical region approaches , the sphere begins to turn around from the Hubble flow and collapse rapidly to form a virialized halo. The over density of virialized halo reaches , where is the collapse redshift and is the critical mass density in the present (Kaiser, 1986). As the universe expands, the virial radius expands gradually by steady mass accretion. N-body simulations show that the accreting dark matter forms an extended envelope, while the density profile of the original halo remains unchanged. The mass profile of a dark halo is rearranged only by a major merger through violent relaxation. A halo formed by a major merger at is characterized by the mass density of , and it is preserved until the next major merger takes place (Salvador-Solé, Solanes & Manrique, 1998; Raig, González-Casado & Salvador-Solé, 1998; Henriksen & Widrow, 1999). By this means, the density profile of a dark halo can be a good indicator of the redshift when the last merger took place.
Navarro, Frenk & White (1996) (hereafter NFW) suggested that all of the dark halos have the self-similar mass profile described as
| (1) |
where and are the critical mass density of universe, the scale radius and the characteristic density respectively. In this case, the would be a direct indicator of the formation epochs of dark halos.
In this paper, we will present the mass profiles of dark halos over the mass range of using a sample of 83 objects observed with ASCA. This furnishes us with a possible way to determine the formation epochs of galaxies and clusters of galaxies.
Throughout the paper, we assume , and .
2 SAMPLE AND ANALYSIS
Our sample consists of rich clusters, poor clusters, groups of galaxies and elliptical galaxies. The spectrum analysis was performed by the standard method using the and the software to determine the HI absorption, the metal abundance and the luminosity weighted temperature. The results of spectrum analysis are described in the forthcoming paper along with a full description of our sample objects (Akimoto et al., 2000).
The point spread function (PSF) of the ASCA telescope is characterized by a sharp central peak (FWHM ) and a significant scattering tail extending to . We have deconvolved this scattering tail by the Richardson-Lucy algorithm (Lucy, 1974). The observed images of 3C273 were employed as the PSFs. The deconvolutions were performed in the three energy bands ( and ) separately, since the PSF has a weak dependence on the photon energy. All of the observed images went through 100 iterations.
We have calculated the X-ray brightness profiles from the deconvoled images, masking the bright sub-peaks and obvious sub-clusters. The brightness profiles obtained in the lowest energy band, , were compared to those from ROSAT PSPC in the energy band of , and good agreements were found in these independent observations.
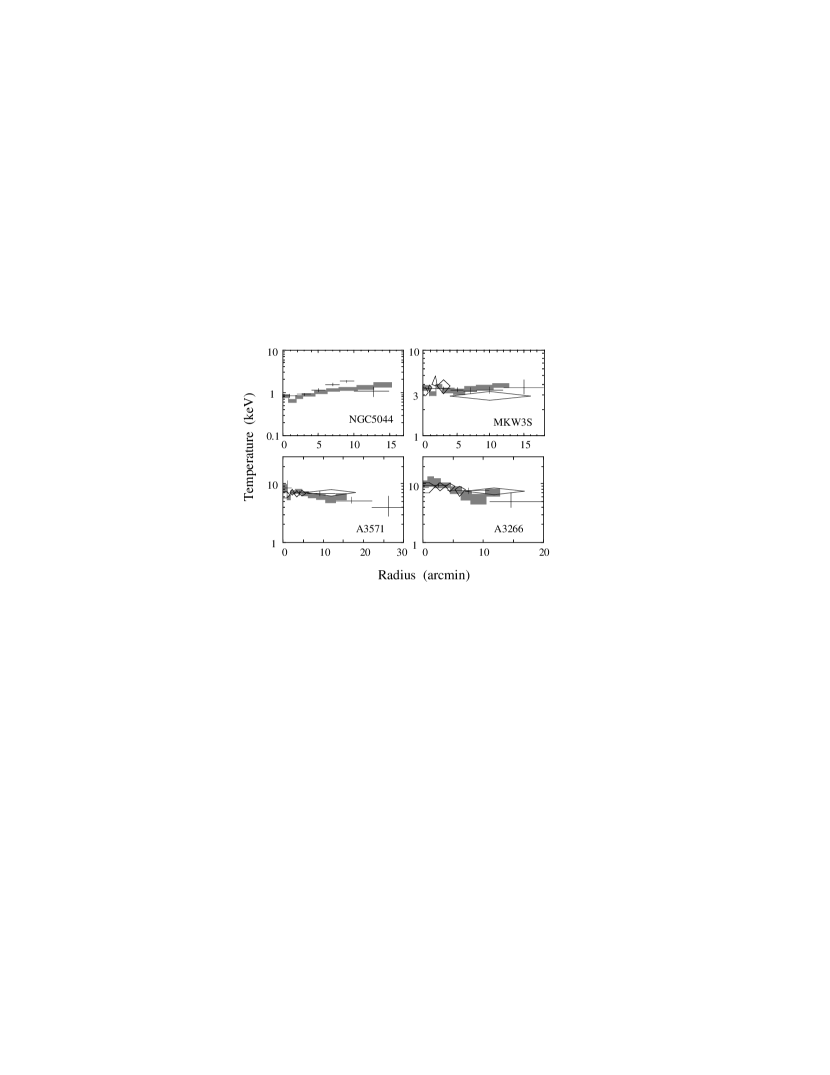
The temperature profiles are calculated from the brightness ratio of the X-ray profiles in the three energy bands, . We assumed that there were no radial gradients in metal abundance and HI absorption. The typical temperature profiles of our sample are shown in Figure 1, together with a comparison with the previous measurements.
3 CALCULATION OF MASS PROFILE
The total mass of a dark halo can be calculated from the gas density and the temperature profiles of ICM, assuming the hydrostatic equilibrium.
If the observed X-ray surface brightness profile is described by the model, , where , and are the angular radius, the core radius and the parameter respectively, and the radial gradient of temperatures is relatively small as compared with that of the gas density, the total mass within radius r is given by
| (2) |
where , , and are the gas temperature, the Boltzmann′s constant, the mean molecular weight of the hot gas and the core radius respectively.
We found that , and were not constant in a single cluster, but changed slowly with radius. The angular profiles of two parameters, and , were calculated by fitting the model to the local brightness profiles of . Although the angular profiles, , and , are the luminosity weighted properties of the hot gas along the line of sight, these are nearly equal to the radial profiles, , and , if the radial gradient of gas density (or ) is much larger than those of , and . In our sample, , and change factor 2 at most, while the changes 2 or 3 orders of magnitude. We therefore assumed that the observed angular profiles represented the radial profiles of these parameters. The local gas density profile was therefore given by and the total mass was calculated from the equation (2). The mass density was obtained from and , keeping .
We have constructed the models of gas halos bound by the NFW dark halos to evaluate the systematic errors in our method. The mass profiles were calculated from the model profiles, which correspond to typical galaxies, poor clusters and rich clusters, by applying the same method. The best-fit and are then calculated by fitting the NFW model to the mass profiles. Comparing the calculated and with the original values, we have confirmed that the systematic errors of our method were much smaller than the typical photon noise of our sample objects.
In our analysis, the brightness profile within were excluded to avoid the contribution of the cooling flow component. The maximum radii were extending up to depending on the photon number available. We define as the radius where the mean interior density becomes 200 times the critical mass density of the universe, and as the total mass within . In this paper, we consider and is the virial radius and the virial mass (Cole & Lacey, 1996) respectively.
4 THE OBSERVED MASS PROFILES
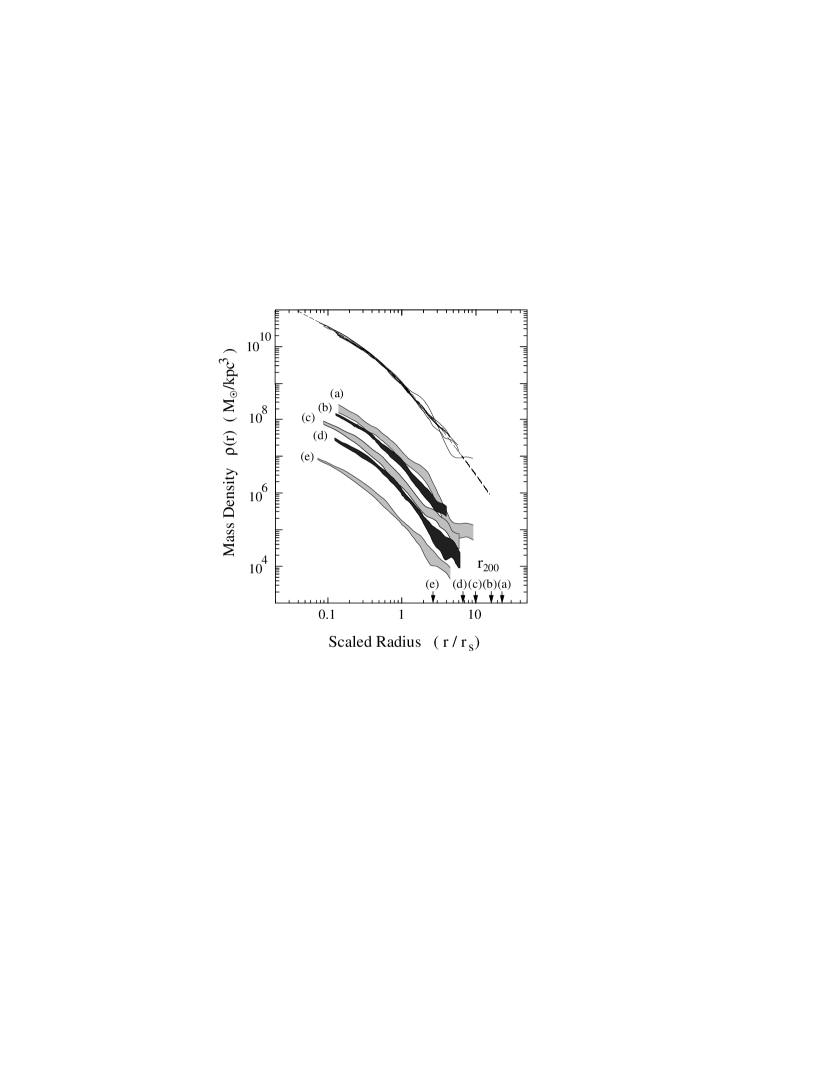
The NFW model was fitted to our mass profiles to determine , , and . The mass profiles of several objects, which have similar characteristic radius, are co-added to improve the signal to noise ratio. The composite mass profiles, scaled by are shown in Figure 2 by the shaded lines. The widths of lines correspond to the errors. The average scale radii are and in (a), (b), (c) and (d) respectively. The NFW model and the model were fitted to these composite profiles. Since the composite mass profiles drop more quickly at larger radii, the NFW model gives better fit to the observations. The of the NFW model are 3.0/4, 4.3/5, 5.5/5 and 3.6/5 in (a), (b), (c) and (d), while those of the model are 2.0/4, 24/5, 23/5 and 14/5. To illustrate a similarity of mass profile, we have normalized the composite density profiles by and illustrated in the upper portion of Figure2 by the solid lines. It is remarkable that these haloes have very similar mass profiles.
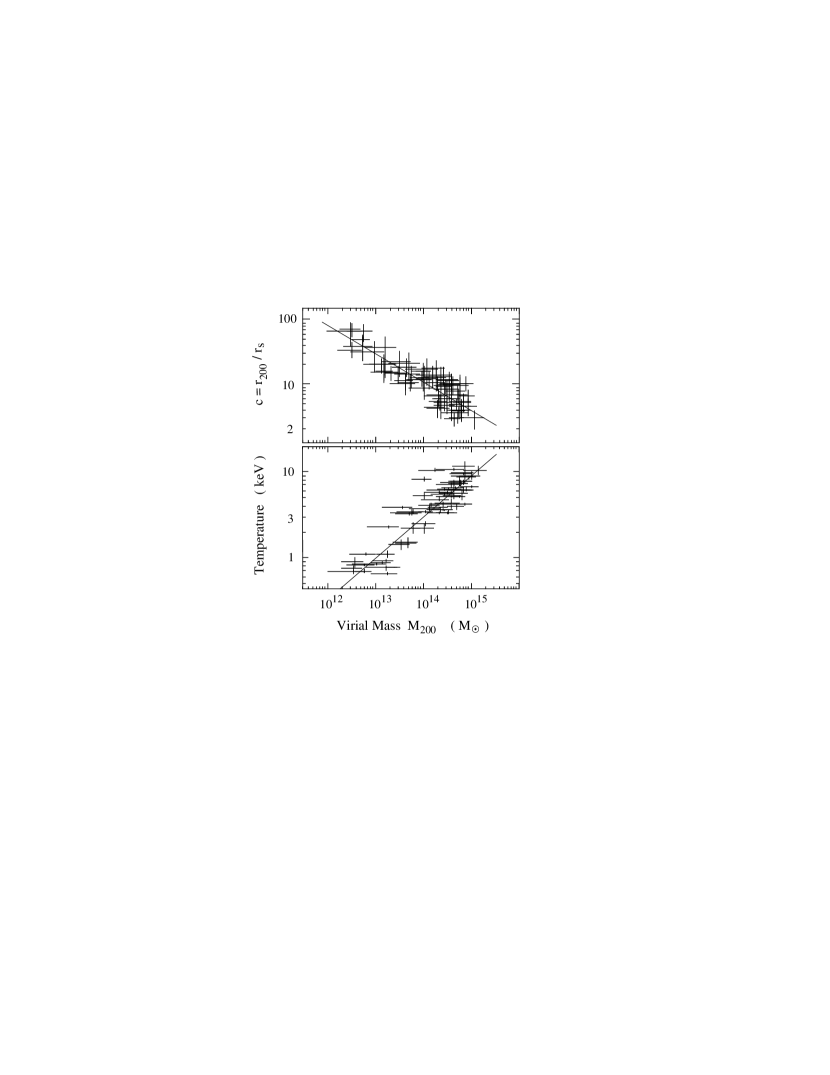
The brightness profiles scaled by can be a good indicator of mass profiles. Ponman, Cannon & Navarro (1999) illustrated the scaled brightness profiles of 25 clusters, normalized by the viral radius, and pointed out the systematic change of profiles with . Our measurements, however, do not conflict with this result. Since the observed dark halos have different concentration parameters with as shown in the upper panel of Figure 3, the virial radius is not an adequate scale to illustrate the similarity of mass profiles. If our results are scaled by , we see the same systematic trend as found by Ponman, Cannon & Navarro (1999).
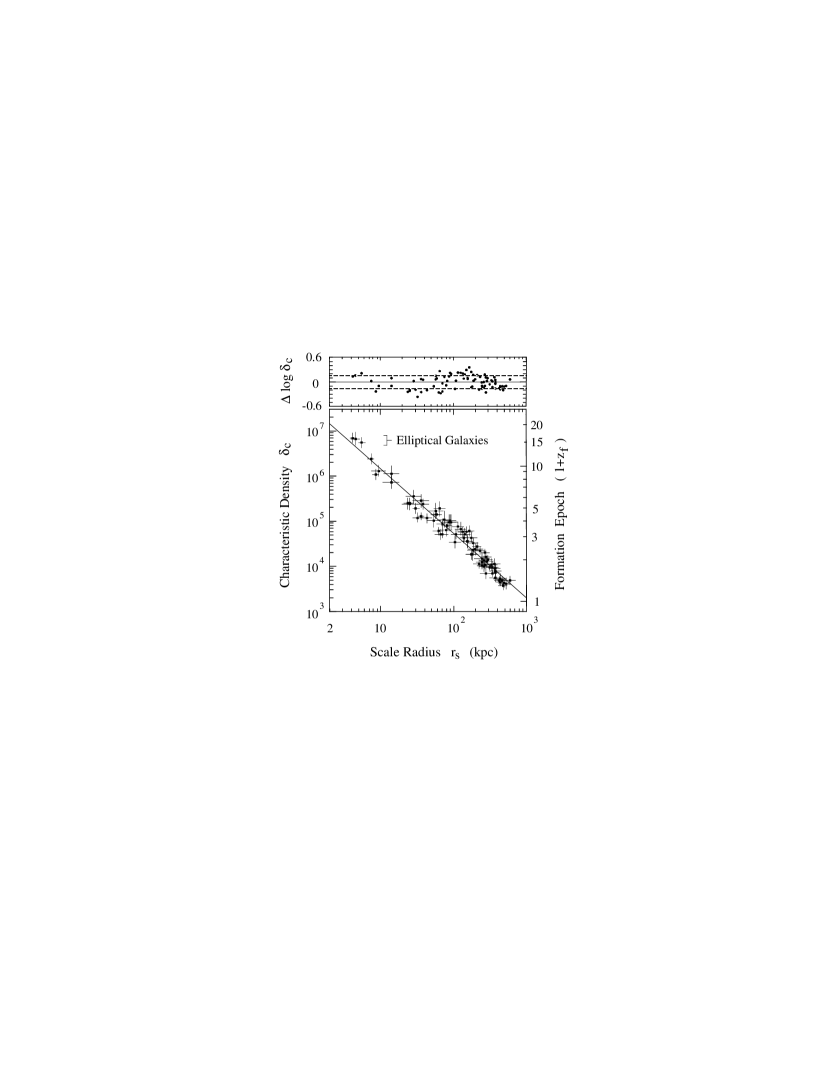
The correlation between the and the luminosity weighted temperature is shown in the lower panel of Figure 3. Our measurements give with a confidence level of . We have found a good correlation between and in our 83 objects as shown in Figure 4. Our result is essentially the same as the and correlations found by Wu & Xue (2000), but have larger dynamic ranges and smaller errors. The upper panel indicates residuals from the best-fit model. The rms scattering of shown by the dashed lines ( ) is significantly larger than the errors of measurements. Our results indicate that the mass profile of a dark halo is described by a single parameter, such as or .
5 THE SPECTRUM INDEX OF PRIMORDIAL FLUCTUATION AND THE FORMATION EPOCH OF GALAXIES
The amplitude of primordial density fluctuation, , is characterized by the spectrum index . In the CDM universe, the radius and the mass density of dark halo are connected to as (Peebles, 1980). The slope of relation shown in Figure 4 is therefore the direct indicator of the power spectrum. If the is described by a single power in the mass range of our sample , the relation gives with a confidence level of . The error is calculated from the intrinsic scattering of the objects. When the objects of are excluded, we get , which is consistent with the result of Wu & Xue (2000), .
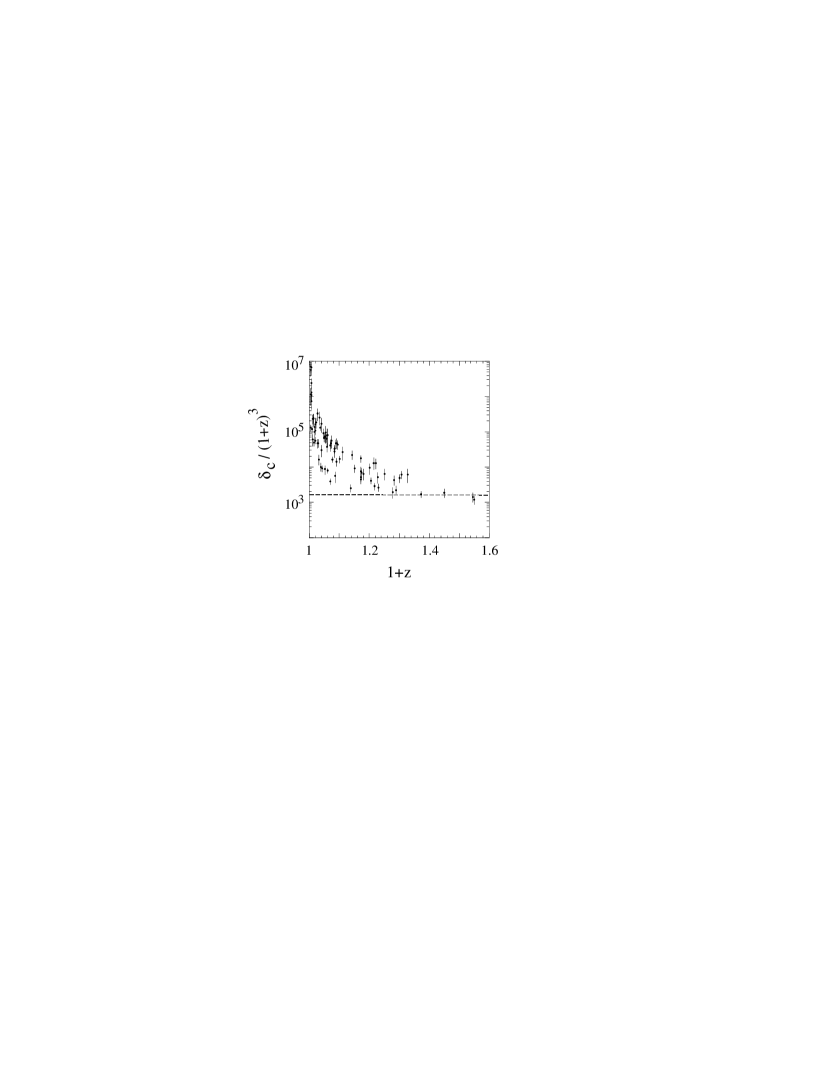
We assume that the characteristic density is preserved during the steady accretion phase as N-body simulations suggest. In that case, should be proportional to the mean mass density of the universe when the halo was assembled, , where , and are a proportional constant, the formation epoch and the observed redshift of object respectively. As , . If our sample includes the zero age clusters , the of these objects would be equal to . As shown in Figure 5, we found the clear locus in the lower end of v.s. plot, and five clusters on the locus (A370, A1758, CL0016+16, MS04516 and RXJ1347.5-1145) were designated to the zero age clusters. These zero age clusters give the proportional constant and the formation epoch as and . Applying this equation to individual objects, we get for the formation epochs of 3 elliptical galaxies in our sample (NGC1399, NGC3923 and NGC4636). Our results are nearly independent of the cosmological parameters as illustrated in Wu & Xue (2000).
References
- Akimoto et al. (2000) Akimoto, F., Furuzawa, A., Kumai, Y., Sato, S., Tawara, Y., & Watanabe, M. 2000, in preparation.
- Carlberg et al. (1997) Carlberg, R. G., et al. 1997, ApJ, 485, L13
- Cole & Lacey (1996) Cole, S., & Lacey, C. 1996, MNRAS, 281, 716
- Fukazawa et al. (1996) Fukazawa, Y., et al. 1977, PASJ, 48, 395
- Henriksen & Widrow (1999) Henriksen, R. N., & Widrow, L. M. 1999, MNRAS, 302, 321
- Kaiser (1986) Kaiser, N. 1986, MNRAS, 222, 323
- Kikuchi et al. (1999) Kikuchi, K., Furushyo, T., Ezawa, H., Yamasaki, N. & Ohashi, T. 1999, PASJ, 51, 301
- Lucy (1974) Lucy, L. B. 1974, ApJ, 79, 745
- Markevitch (1998) Markevitch, M., Forman, W. R. , Sarazin, C. L. & Vikhlinin, A. 1998, ApJ, 503, 77
- Navarro, Frenk & White (1996) Navarro, J. F., Frenk, C. S., & White, S. D. M. 1996, ApJ, 462, 563
- Peebles (1980) Peebles, P. J. E. The Large-Scale Structure of the Universe, Princeton:Princeton Univ. Press, 1980
- Ponman, Cannon & Navarro (1999) Ponman, T. J., Cannon, D. B., & Navarro, J. F. 1999, Nature, 397, 135
- Raig, González-Casado & Salvador-Solé (1998) Raig, A., González-Casado, G.,& Salvador-Solé, E. 1998, ApJ, 508, L129
- Salvador-Solé, Solanes & Manrique (1998) Salvador-Solé, E., Solanes, J. M., & Manrique, A. 1998, ApJ, 499, 542
- White (2000) White, D. A. 2000, MNRAS, 312, 663
- Wu & Xue (2000) Wu, X. -P., & Xue, Y. -J. 2000, ApJ, 529, L5