X-ray observations of supernova remnant G54.1+0.3: X-ray spectrum and the discovery of an X-ray jet
Abstract
We present in this paper analyses of the PSPC and SIS and GIS observations of the Crab-like supernova remnant (SNR) G54.1+0.3. Its spectrum obtained by PSPC favors a power law model with a photon index of -0.8, absorbed energy flux in 0.1-2.4 keV of 1.0 erg cm-2 s-1, and absorption column density of 12.3 cm-2. SIS observation shows that its spectrum can also be best fitted with power law model. The fitted parameters are, photon index -1.9, absorbed energy flux in 0.7-2.1 keV 6.510-13 erg cm-2 s-1, and column density 17.9 cm-2. The high absorption column density indicates a distance similar to the radius of the galaxy. The 0.1-2.4 keV X-ray luminosity of G54.1+0.3 is 3.21033 erg s-1, where is the distance in 10 kpc. With an image restoration method we have obtained high spatial resolution X-ray image of the remnant, which clearly shows an X-ray jet pointing to the northeast with a length about 40 from the center of the nebula. Its X-ray luminosity in 0.1-2.4 keV is about 5.11032 erg s-1. The X-ray jet is consistent with the radio extension to the northeast in both direction and position. We propose that the X-ray jet is connected with the pulsar assumed to exist in the remnant.
Key Words.:
X-ray: ISM – ISM: supernova remnants – ISM:jet and outflows –ISM: individual: G54.1+0.31 Introduction
Radio source G54.1+0.3 was first suggested to be a Crab-like SNR by Reich et al. (1985) for its flat spectral index of , filled-center morphology and significant polarization. This identification to G54.1+0.3 was confirmed by Velusamy Becker (1988) with high resolution multifrequency observations with the VLA and OSRT. In the high resolution VLA maps, G54.1+0.3 has a filled-center brightness distribution peaks around R.A.(2000) =19:30:30, DEC(2000)=18:52:11 and extends to the northeast and north (Velusamy & Becker 1988). They pointed out that these extensions are reminiscent of the radio jets seen in the Crab (Velusamy 1984), CTB80 (Angerhofer et al. 1981) and G332.4+0.1 (Roger et al. 1985).
X-rays from G54.1+0.3 was detected by IPC (resolution 1) with a source strength of 0.0160.004 counts s-1 in the energy band 0.5-4.0 keV (Seward 1989). No extent to the X-ray emission was found, due to both its small angular size (2.0) (Velusamy & Becker 1988) and its low flux. A power law spectral fitting with energy index of 1.0 gives column density NH between 51021 and 11023 cm-2, with the best fit value of 31022 cm-2, indicating a large distance of this source.
In the paper we present the analyses of PSPC and GIS and SIS observations of G54.1+0.3. We obtain its spectral information, and, with the aid of an image restoration method, we obtain a high spatial resolution X-ray map of the remnant which clearly shows an X-ray jet pointing to the northeast.
2 Observations and analysis method
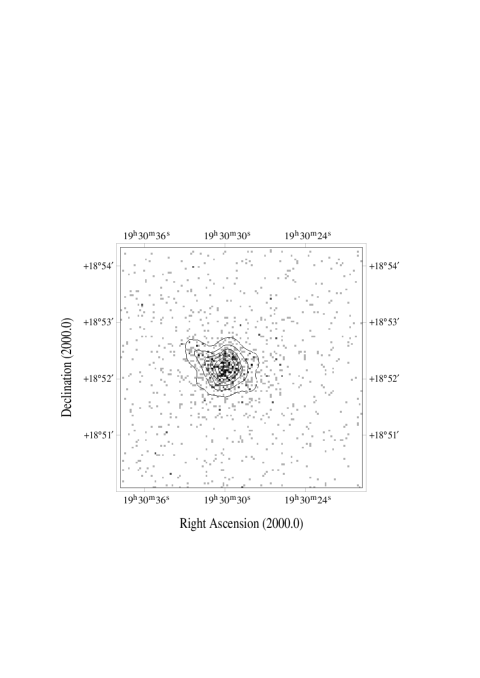
The PSPC pointing observation of SNR G54.1+0.3 was carried out from April 11th to 18th, 1991 with a total acceptable observational time of 20271 seconds. We use (Zimmermann et al. 1998) to analyze its spectrum and produce a 0.1-2.5 keV X-ray image (figure 1) whose spatial resolution is the intrinsic resolution of PSPC (40).
G54.1+0.3 was also observed with observatory (Tanaka et al. 1994) continuously from April 27th to 28th, 1997, using the two Gas Imaging Spectrometers (GIS-2 and GIS-3) and the two Solid State Imaging Spectrometers (SIS-0 and SIS-1). Data were collected by the two GIS detectors with a photon time-of-arrival resolution of 4.88 s in the high bit-rate modes. An effective exposure time 16.5 ks was achieved for each detector. The SIS detectors were operated in the 1-CCD faint mode in which read-out is every 4 s. All SIS data were filtered using the standard screening criteria, which resulted in effective exposures of 19 ks and 20.7 ks for SIS-0 and SIS-1 respectively. Since the two GIS detectors were operated in the high time-of-arrival resolution model, we used the GIS data for temporal analysis. The SIS detectors which are sensitive to photons in 0.5-10.0 keV have superior energy resolution compared to the GIS, and so the SIS data are used for spectral analysis.
Due to the small angular size (120) of G54.1+0.3 and the limited spatial resolution () of PSPC, the PSPC observation can not directly give even a coarsely resolved image of G54.1+0.3. In order to obtain an image with higher spatial resolution, we use the widely used Lucy-Richardson formula (Richardson 1972, Lucy 1974) to eliminate the point spread function effect in figure 1. In the iteration process we have used the mean background as the lower limit constraints, in order to improve the quality of the restorated image, as done by Li & Wu (1994), Lu et al. (1996) and Zhang et al. (1998).
3 Results
3.1 Spectrum from PSPC observation
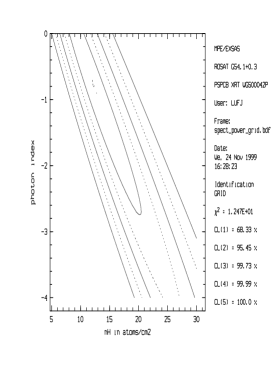
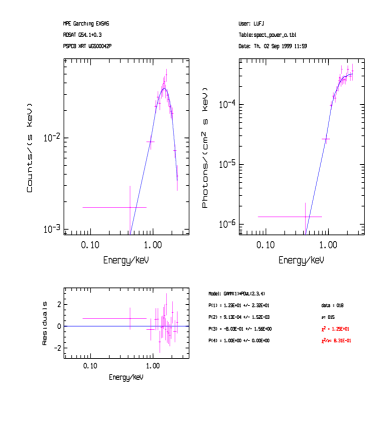
The PSPC spectrum of G54.1+0.3 shows a lack of low energy photons and peaks at energy channel 150 (about 1.5 keV). The spectrum can be fitted with power law model and Raymond-Smith (1977) thermal plasma model. The power law model yields a photon index of -0.8 with 1 error range of -2.8 to 0.0 and an absorption column density of 12.31021 cm-2 with 1 error range of 8 to 201021 cm-2 (see figure 2). The thermal plasma model derives a plasma temperature of 1.8 keV ( 1.2keV) and absorption column density of 21.11021 cm-2 with 1 error range of 15-261021 cm-2. The reduced values are almost the same, 0.831 for power law model and 0.834 for thermal plasma model. We adopt the power law model in this paper for it gives the best and the most reasonable fit to the SIS spectrum, as shown in the next section. It gives the absorbed and unabsorbed 0.1-2.4 keV X-ray energy fluxes of 1.0 and 3.4 erg cm-2 s-1, respectively. Figure 3 shows the power law model fitting results.
3.2 Spectrum from SIS observation
The SIS spectra of the source were extracted within a 4.5 arcminutes radius region. After subtracted the source region, another region of the CCD was used for background subtraction. The source and background spectra obtained from both SISs were added to obtain improved statistics. The spectral anlyses software is XSPEC. Energies above 8 keV were not used because of the poor signal to noise ratio. We have used power law, blackbody, single temperature bremsstrahlung and Raymond-Smith thermal plasma models to fit the spectrum, and found that only the power law model and the thermal bremsstrahlung model give acceptable and reasonable fits. The obtained parameters of the power law model are: photon index -1.9, column density 17.9 cm-2, 0.7-2.1 keV energy flux 6.510-13 erg cm-2 s-1, reduced 0.7. Parameters of a thermal bremstrahlung model are: temperature 7.9 keV, column density 15.4 cm-2, 0.7-2.1 keV energy flux 8.610-13 erg cm-2 s-1, reduced 0.8. We choose the power law model in this paper for that it has the smallest and a power law X-ray spectrum is the typical property of the X-ray emission of a Crab-like SNR. For illustration, we show in figure 4 the best fit power law model and its residuals.

3.3 Temporal analysis
We examined the GIS data for temporal variability by extracting photons from a 6 arcminutes radius circle centered on the source. A search for coherent pulsations from the source was made by combing the two GIS high-time-resolution data sets (time resolution 4.8810-4 s) and the arrival times of the used 1805 photons were barycentered. We performed a restricted search for periodic signals between 0.01 s and 2 s using a folding technique (20 phase bins per fold), and detected no pulsation with a significance of more than 3 in this period range.
3.4 Image restoration results
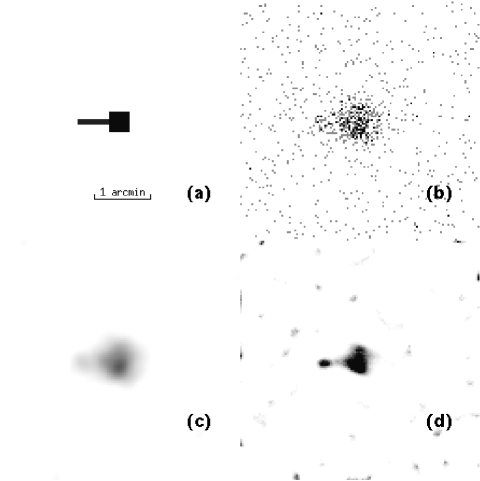
The distribution of photons detected by PSPC peak at 1.5 keV and is quite symmetric. We thus use the PSPC point spread function in 1.5 keV and the method described in section 2 to restore the original image (figure 1). The iteration stops after 50 iterations (indeed the restored image is insensitive to the iteration number after 20 iterations). The restored image is shown in figure 5, in which a jet-like feature (hereafter JLF) pointing to the northeast appears, in addition to the 30 diameter bright nebula coinciding with the brightest radio region. The angular distance from the head of the JLF to the center of the central bright nebula is about 40. The total photon flux of the bright nebula is 2.0710-2 counts s-1, that of the JLF is about 3.910-3 counts s-1, about 430 and 80 photons have been detected from the bright nebula and JLF respectively.
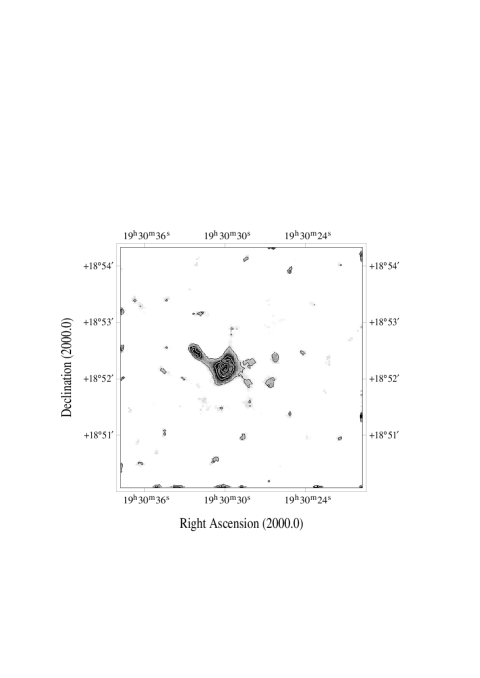
In order to exam the reliability of the restored image, we have performed a Monte-Carlo simulation. Figure 6(a) displays an object similar to G54.1+0.3 in figure 4 in shape and flux. Figure 6(b) is the simulated PSPC observational result with the same observing time and background level as the real observation to G54.1+0.3 , and figure 6(c) is the smoothed image from 6(b). Figure 6(d) is the restorated image of 6(b). The simulation shows that the high resolution X-ray image of G54.1+0.3 we obtained is reliable.
4 Discussions
4.1 Distance and X-ray luminosity of G54.1+0.3
Velusamy & Becker (1988) suggested that G54.1+0.3 may have a distance of about 3.2 kpc, if its progenitor is in the star-forming region G53.9+0.3. The galactic HI column density in this direction is about 14.51021 cm-2 (Dickey Lockman 1990). The best fit column density we get from PSPC observation is a little lower and the best fit column density of the SIS observation is a little higher than that value. These column densities imply a distance comparable with the radius of the galaxy, similar to the result of IPC (Seward 1989), 3.2 kpc might be then too close and 10 kpc should be a reasonable estimation. The X-ray luminosity in 0.1-2.4 keV is = 3.210 erg s-1, where is the distance to G54.1+0.3 in unit of 10 kpc. If the distance does not deviate from 10 kpc very much, its X-ray luminosity is three or four orders’ lower than Crab Nebula (Helfand & Becker 1987), lies in the lower end of Crab-like SNRs, similar to that of SNR 3C58 (Helfand & Becker 1987; Helfand et al. 1995).
The radio luminosity of G54.1+0.3 is about 51033 erg s-1, derived from the radio observations of Velusamy & Becker (1988). The ratio = 0.6, also similar to that of 3C58 (Helfand & Becker 1987).
Seward & Wang (1988) found that a relation between the X-ray luminosity () of a plerionic SNR and the spin-down luminosity () of the central pulsar. Using that relation we can derive 81035 erg s-1 for the central pulsar in G54.1+0.3.
4.2 Electron energy distribution
The PSPC observation of G54.1+0.3 shows that the X-ray flux at 1 keV is about 6.410-4 mJy. As the radio flux at 1.4 GHz is 478 mJy, the flux index between radio and X-ray is about -0.7, a little flatter than the SIS obtained X-ray energy index (-0.9) and much steeper than that of radio spectral index (-0.13) (Velusamy Becker 1998), indicating that the spectrum contains a break between radio and X-ray. Comparing the radio to X-ray flux index, radio flux index and the X-ray flux index, we find that the break is around 1011 Hz.
If the relativistic electrons have a power law energy distribution = , the spectral index is . The spectral break in the spectral means a similar break in the electron energy distribution. The critical radiation frequency of a relativestic electron with energy in a magnetic field with strength is MHz, where is in G, is in GeV and the incident angle of electron (Lang 1998). The electrons whose maximum radiations are at 1 GHz have typical energies of 9.4 GeV with the magnetic field strength in G, assuming that the incident angle is 45. Similarly the X-ray (around 1 keV) emitting relativestic electrons will have typical energies of 94 TeV. If the magnetic field is about 10G, the above estimations show that the electron energy distribution is around 30 GeV and around 300 TeV. An index break exists between 30 GeV and 300 TeV, probably around 300 GeV.
The life time of a relativestic electron can be represented by , the time of the electron loses half of its initial energy , years, where is in G, is in GeV and the incident angle of the electron (Lang 1998). The lifetimes for the 30 GeV, 300 GeV and 300 TeV photons in 10 G magnetic field are about 5.6106, 5.6105, 5.6102 years, respectively. These three typical lifetimes will be used in the discussions of the origin of the electron energy distribution index break in the next paragraph.
If the electrons from the center pulsar have a continuous power law energy distribution initially, the observed break should be due to the short lifetime of the high energy electrons. Because the low energy electrons which radiate radio emission have a long lifetime, their energy distribution represents the initial electron energy distribution well. The initial energy flux ratio is then 11.75. The currently observed energy flux ratio is 7.8, indicates that the age of G54.1+0.3 would be at least 5.6102=3.7107 years. This large age value shows that the observed electron energy distribution break is quite probably an intrinsic property of the electrons from the central pulsar.
4.3 X-ray jet
For the first time an well resolved X-ray image of G54.1+0.3 has been obtained. It shows a JLF pointing to the northeast. The simulation shows that such a structure can be clearly resolved by PSPC with the aid of an image restoration technique. The simulation also shows that this feature can not be attributed as the fluctuations of the bright source, it is an intrinsic structure of the object.
We have studied the possibility that the JLF is indeed a separate object lies in a similar direction with G54.1+0.3. We find that there is no identified object in the 30 vicinity of the JLF except G54.1+0.3. The optical plate obtained by Palomar Observatory Sky Survey and electronically reproduced by Skyview of NASA/GSFC shows no source in the JLF region too. The JLF shown in figure 5 shows some enhancements in the head. But it might be a false phenomenon caused by the low quality of the original data and the restoration process, as can be found in the simulation, although some similar structures exist in the 4.8 GHz radio map. More simulations show that the length of the JLF is quite reliable, the width of the JLF might have an uncertainty up to 50.
We have compared figure 4 with the 4.8 GHz VLA map obtained by Velusamy & Becker (1988) in details. The brightest point of the extended X-ray source locates at R.A.(2000)=19:30:30.0, DEC(2000)=18:52:07, which coincides with the brightest region of the radio source. The head of the JLF has a coordinate of R.A.(2000)=19:30:32.2, DEC(2000)=18:52:31, which also coincides with the northeastern enhancement in the radio map. The nice position coincidence of the X-ray and radio sources strongly favor their same origin. However, the X-ray source has a smaller extent than the radio source and no significant X-ray emission has been detected along the northward feature, which was suggested to be the most probable radio JLF by Velusamy & Becker (1988). It might be due to the intrinsic deficiency or the limited sensitivity of the present observation.
There are two possible ways to explain the origin of the X-ray JLF. One is that it is a fragment produced in the supernova explosion, like the fragments detected around the Vela SNR, especially its ‘bullet’-like fragment A. (Aschenbach et al. 1995; Strom et al. 1995). However, significant radio emission has only been detected around the head of the fragments, implies that most of the relativistic electrons are in the leading edge of the fragments, close to the shock front (Strom et al. 1995). But in the case of G54.1+0.3 the radio emission has a similar distribution with the X-ray JLF, indicating a similar distribution of relativistic electrons with the X-ray brightness. It makes the fragment origin of the X-ray JLF implausible. The second is that the X-ray JLF is due to the relativistic electrons produced by the central pulsar, like X-ray jets detected in PSR 1929+10 (Wang et al. 1993), Crab SNR (Hester et al. 1995), Vela pulsar (Markwardt & Ögelman 1995), SNR MSH 15-52 (Tamura et al. 1996), SNR CTB80 (Wang & Seward 1984; Safi-Harb et al. 1995) in the galaxy and SNR N157B in the Large Magellanic Cloud (Wang & Gotthelf 1998). The coincidence of radio and X-ray emission in the case of Vela pulsar jet (Frail et al. 1997) and that of SNR N157B (Wang & Gotthelf 1998) strongly support this scenario. We conclude that the JLF we discoveried is quite probably an X-ray jet connected with the pulsar in G54.1+0.3.
The X-ray emission of Vela pulsar jet can be fitted with both power law and thermal plasma model (Markwardt & Ögelman 1995), and the X-ray pulsar jet in MSH15-52 appears to be nonthermal. It is difficult to get the spectral properties of the X-ray jet in G54.1+0.3 with the present data. We assume that it share the same power law model with the whole remnant, and is due to the synchrotron radiation of relativistic electrons from the pulsar. The X-ray luminosity of the jet in 0.1-2.4 keV is then about 5.11032 erg s-1.
From the radio map of Velusamy Becker (1988) we estimate that the flux of the jet at 4.8 GHz is about 40 mJy. Its X-ray flux at 1 keV is about 9.4 mJy. The two fluxes give a spectral index from radio to X-ray of about -0.73, quite similar to that of the whole remnant. As no significant radio spectral variation across the source has been detected (Velusamy Becker 1988), the jet electrons have a break with the energy distribution too, similar to the whole remnant.
The distance of the jet head to the nebula center is about 40. It corresponds to 2 pc if the SNR is 10 kpc away. Reccent distance measurements to Vela SNR obtained a distance of 250 pc (Cha et al. 1999). If so the Vela pulsar jet is about 3 pc long (Cha et al. 1999, Markwardt & Ögelman 1995). The lengths of the two jets are quite similar.
5 Summary
PSPC and observations of G54.1+0.3 imply a large distance comparable with the galactic radius. Its X-ray spectrum is of nonthermal origin. The comparison of the radio and X-ray emissions shows that the energy distribution of the relativistic electrons has a break around 300 GeV. This break is quite probably an intrinsic property of the relativistic electrons from the central pulsar instead of due to the energy lose in the synchrotron radiation process, if G54.1+0.3 is not as old as 3.7107 years.
A high spatially resolved image shows an X-ray jet pointing to the northeast, similar to the radio structures. Its nonthermal spectrum and the existence of X-ray jet confirm the formal identification of G54.1+0.3 as a Crab-like SNR, though no pulsation has been found in the X-ray observation. Future deep X-ray observations with high spatial resolution and spectral resolution telescopes such as Chandra and XMM are invaluable to find out the spectral and spatial structure of the remnant as well as the X-ray jet.
Acknowledgements.
F.J. Lu is supported by the exchange program between Max-Planck Society and Chinese Academy of Sciences. He thanks Professor J. Trümper for hospitality. The authors thank Drs S.D. Mao and Q.D. Wang for helpful discussions. This research is partially supported by the National Natural Science Foundation of China and the Special Funds for Major State Basic Research Projects. It has made use of the SIMBAD database, operated at CDS, Strasbourg, France and the Digitized Sky Survey operated by Skyview of NASA/GSFC.References
- (1) Angerhofer P.E., Strom R.G., Velusamy T., Kundu M.R., 1981, A&A 94, 313
- (2) Aschenbach B., Egger R., Trümper J., 1995, Nat 373, 587
- (3) Cha A.N., Sembach K.R., Danks A.C., 1999, ApJ 515, L25
- (4) Dickey J.M., Lockmann F.J., 1990, ARA&A 28, 215
- (5) Frail D.A., Bietenholz M.F., Markwardt C.B., Ögelman H., 1997, ApJ 475, 224
- (6) Helfand D.J., Becker R.H., 1987, ApJ 314, 203
- (7) Helfand D.J., Becker R.H., White R.L., 1995, ApJ 453, 741
- (8) Hester J.J. et al., 1995, ApJ 448, 240
- (9) Lang K.R., 1998, Astrophysical Formulae (Springer)
- (10) Li T.P., Wu M., 1994, Ap&SS 215, 213
- (11) Lu F.J., Li T.P., Sun X.J., Wu M., Page C.G., 1996, A&AS 115, 395
- (12) Lucy L., 1974, AJ 79, 745
- (13) Markwardt C.B., Ögelman H., 1995, Nat 375, 40
- (14) Raymond J.C., Smith B.W., 1977, ApJS 35, 419
- (15) Reich W., Fürst E., Altenhoff W.J., Reich P., Junkes N., 1985, A&A 151, L10
- (16) Richardson B.M., 1972 J. Opt. SOc. Am. 62, 55
- (17) Roger R.S., Milne D.K., Kesteven M.J., Haynes R.F., Wellington,K.J., 1985, Nat 316, 44
- (18) Safi-Harb S., Ögelman H, Finley J.P., 1995, ApJ 439, 722
- (19) Seward F.D., 1989, AJ 97, 481
- (20) Seward F.D., Wang Z.R., 1988, ApJ 332, 199
- (21) Strom R., Johnston H.M., Verbunt F., Aschenbach B., 1995, Nat 373, 590
- (22) Tamura K., Kawai N., Yoshida A., Brinkmann W., 1996, PASJ 48, L33
- (23) Tanaka Y., Inoue H., Holt S.S., 1994, PASJ 46, L37
- (24) Velusamy T., 1984, Nat 308, 15
- (25) Velusamy T., Becker R.H., 1988, AJ 95, 1162
- (26) Wang Q.D., Gotthelf E.V., 1998, ApJ 494, 623
- (27) Wang Q.D., Li Z.Y., Begelman M.C., 1993, Nat 364, 127
- (28) Wang Z.R., Seward F.D., 1984, ApJ 285, 607
- (29) Zhang S., Li T.P., Wu M., 1998, A&A 340, 62
- (30) Zimmermann U., Boese G., Becker W., Belloni T., Döbereiner S., Izzo C., Kahabka P., Schwentker O. 1998, , MPE Report