Is the LCDM Model Consistent with Observations
of Large-Scale Structure?
11institutetext: Center for Astrophysics and Space Sciences, U. C. San Diego,
La Jolla, CA 92093
Is the LCDM Model Consistent with
Observations of Large-Scale Structure?
Abstract
The claim that large-scale structure data independently prefers the L Cold Dark Matter model is a myth. However, an updated compilation of large-scale structure observations cannot rule out LCDM at 95% confidence. We explore the possibility of improving the model by adding Hot Dark Matter but the fit becomes worse; this allows us to set limits on the neutrino mass.
1 The Recent Past
It has been known for several years that the Standard Cold Dark Matter model, (SCDM, W)111Wx refers to the fraction of critical energy density present in component ; represents all forms of matter, signifies massive neutrinos, and L stands for the cosmological constant. Hubble’s constant is given by km/s/Mpc. refers to the power-law index of the primordial power spectrum. could not simultaneously agree with COBE and large-scale structure observations. Viable alternatives included Tilted Cold Dark Matter (TCDM, W), Cold + Hot Dark Matter (CHDM, W, W), Open Cold Dark Matter (OCDM, W), and LCDM (W, W).
Gawiser & Silkgawisers98 performed a quantitative comparison of these models with a compilation of CMB anisotropy and large-scale structure data and found that CHDM was the most successful model. LCDM, OCDM, and TCDM were inconsistent with the data at 99% confidence. The discrimination between models came primarily from large-scale structure data, particularly the APM galaxy power spectrum, and different values of the shape parameter ( = W in CDM models) were preferred on large and small scales.
2 The Present
Despite the recent success of CHDM, W is not viable given current measurements of the cluster baryon fraction evrard97 and the abundance of baryons inferred from measurements of deuterium in Lyman limit systems burlest98 . Additionally, the high abundance of massive clusters at can only be reconciled with W in the case of non-gaussian primordial density fluctuations robinsongs00 .
The overwhelming current evidence for a low matter density leaves us with only two of the previous models, LCDM and OCDM. The redshift-luminosity distance relationship observed for Type Ia supernovae data prefers LCDM to OCDM at better than 99% confidence perlmutteretal98 ; garnavichetal98a , leaving us with a clear favorite of these “direct” cosmological tests and promoting LCDM to the status of the “standard model” of cosmology.
Should we be concerned that the same LCDM model was ruled out by gawisers98 at 99% confidence? Certainly. However, given the history of systematic errors in astronomy it may well turn out that one or more of the aforementioned observations is flawed. Given the confluence of evidence for a low value of Wm, the most likely culprit would be the observations of large-scale structure that drove the analysis of gawisers98 to favor CHDM. The strongest discriminator was the real-space galaxy power spectrum inferred from the APM galaxy angular correlation function, and this has recently been carefully re-analyzed by Eisenstein & Zaldarriaga eisensteinz99 . They find increased uncertainties on large spatial scales, and adopting their re-analysis leads to significant improvement in the agreement of LCDM and OCDM with large-scale structure observations. However, this agreement remains imperfect; CHDM is still preferred by large-scale structure data but less significantly.
This stands in marked contrast to a myth propagated by some cosmologists that large-scale structure provides independent evidence in favor of LCDM. This myth appears to be caused by remembering that LCDM was preferred to Standard CDM by large-scale structure observations, knowing that LCDM has now been promoted to “standard model,” and concluding that LCDM must be favored by large-scale structure data over all other models. This is not correct.
2.1 Available Large-Scale Structure Data
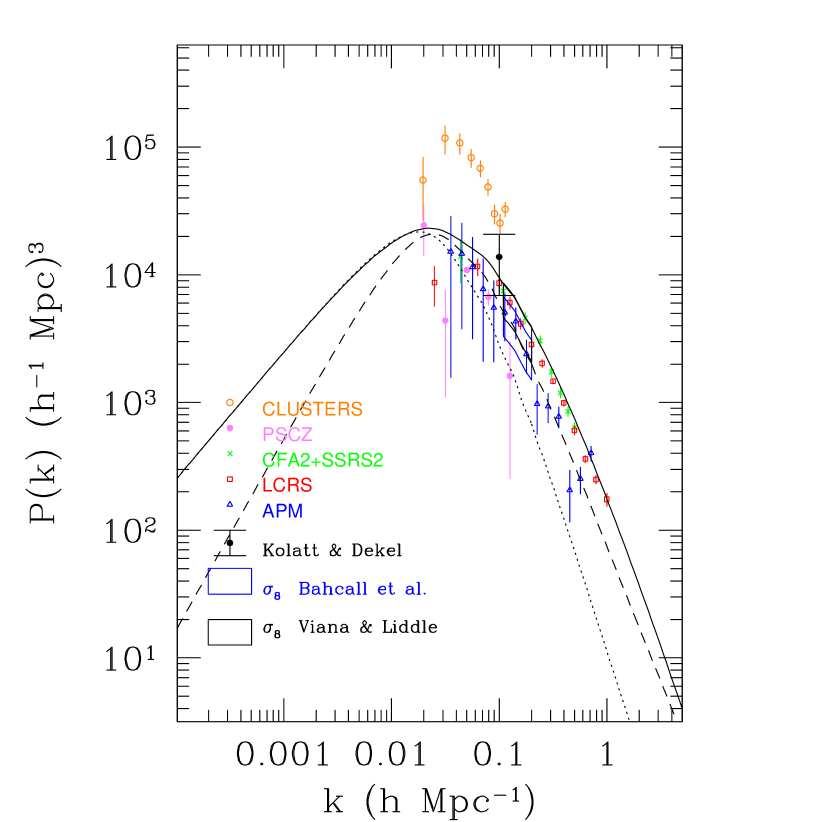
Our large-scale structure data compilation includes the real-space galaxy power spectrum derived from the APM angular correlation function by eisensteinz99 and redshift-space power spectra from SSRS2+CfA2 dacostaetal94 , LCRS linetal96 , PSCz sutherlandetal99 , and APM Clusters tadrosed98 . We also use measurements of the amplitude of the dark matter power spectrum at 8Mpc () from the abundance of rich galaxy clusters at vianal96 and bahcallfc97 and at larger scales from peculiar velocity fields kolattd97 .
Figure 1 shows our data compilation versus the predictions for the matter power spectrum from the LCDM model and two versions of LCHDM with massive neutrinos generating W, one of which has a tilted () primordial power spectrum. For quantitative results, we corrected for scale-independent galaxy bias, redshift distortions and non-linear evolution in the manner described by gawisers98 ; gawiser99 , but those corrections are not shown here. Uncertainty in those corrections on non-linear scales at leads us to restrict our analysis to larger scales.
2.2 Cosmological Limits on Neutrino Masses
Since the agreement between LCDM and the large-scale structure data is less than perfect, we investigate whether adding Hot Dark Matter will improve the fit (for a fuller discussion, see gawiser99 ; gawiser00 ). The opposite occurs; Fig. 1 shows that the LCHDM model with W is in serious disagreement with our large-scale structure data. The diffusion of relativistic neutrinos in the early universe predicts a level of small-scale perturbations significantly lower than that observed. However, tilting the primordial power spectrum to essentially resolves this problem. For large-scale structure data alone, this illustrates a degeneracy between the possibility of neutrino mass and the uncertain nature of the primordial power spectrum. Using all available CMB anisotropy data as well as our large-scale structure data compilation helps to differentiate between variations in the primordial power spectrum and the reduction in small-scale power caused by massive neutrinos.
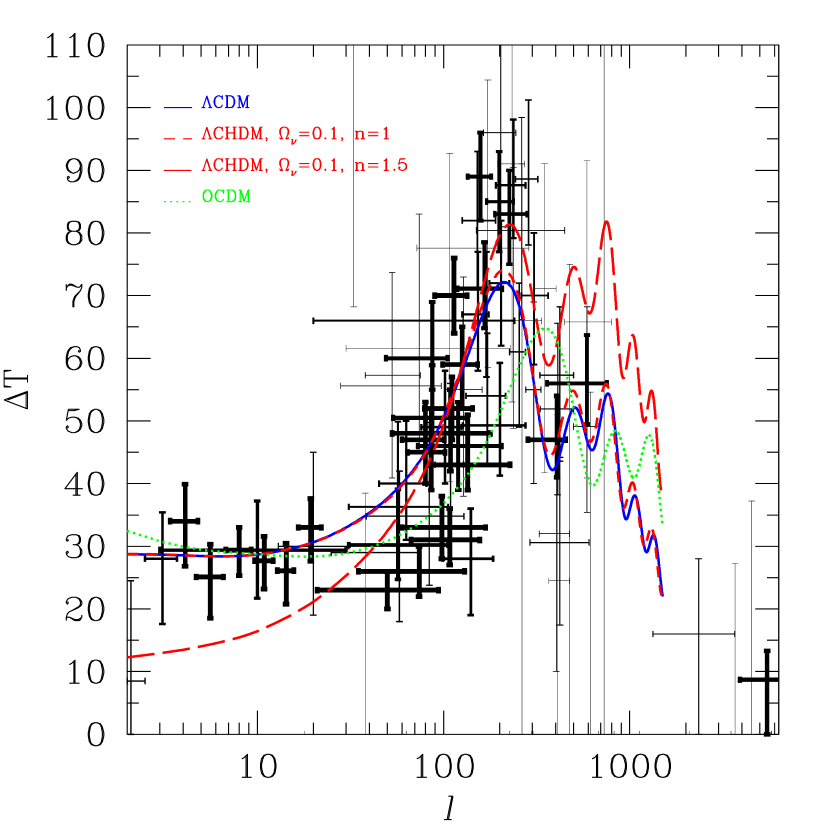
Figure 2 illustrates the complementary nature of CMB anisotropy data. The Open CDM model is ruled out by the location of the first peak caused by acoustic oscillations, which instead indicates a flat geometry for the universe. The LCHDM model with predicts too much anisotropy at high multipoles (small angles), whereas the presence of massive neutrinos is indistinguishable for . Thus the version of LCHDM that agreed well with large-scale structure data is ruled out by the CMB, and vice versa.
We have assumed either a Harrison-Zel’dovich (scale-invariant, ) or a scale-free () primordial power spectrum. If LCDM is right and , then W, and eV. If can vary, W, and eV (limits are at 95% confidence). More freedom in the primordial power spectrum makes it nearly impossible to limit the neutrino mass.
3 The Future
Interesting physics can be probed by large-scale structure with forthcoming data from the 2-Degree Field survey (2dF) and the Sloan Digital Sky Survey (SDSS). The location of the peak in the matter power spectrum identifies the horizon size at matter-radiation equality (), and for pure CDM models this provides an independent measurement of W. Large-scale structure data at 0.1–0.2 probe the primordial power spectrum on smaller scales than can be measured well with CMB anisotropy data before Planck; this provides a much-needed test of inflation. As discussed by Hu, Eisenstein, & Tegmark huet98 , the method utilized here can hope to measure (or constrain) neutrino masses down to 0.5 eV given data from the MAP satellite and SDSS.
4 Conclusions
LCDM is now the standard cosmological model but large-scale structure data does not prefer it over CHDM or OCDM. Current large-scale structure data cannot rule out any of those models at 95% confidence.
LCDM does not prefer the addition of a Hot Dark Matter component in the form of massive neutrinos. This leads to an upper limit on the mass of the most massive neutrino of 4 eV if a power-law primordial power spectrum is assumed.
Forthcoming observations of large-scale structure from 2dF and SDSS will probe the horizon size at matter-radiation equality, the primordial power spectrum on small scales, and neutrino masses.
References
- (1) N.A. Bahcall, X. Fan, R. Cen: Astrophys. J., Lett., 485, L53 (1997)
- (2) S. Burles, D. Tytler: Astrophys. J., 507, 732 (1998)
- (3) L.N. Da Costa, M.S. Vogeley, M.J. Geller, J.P. Huchra, C. Park: Astrophys. J., Lett., 437, L1 (1994)
- (4) D.J. Eisenstein, M. Zaldarriaga: preprint, astro-ph/9912149 (1999)
- (5) A.E. Evrard: Mon. Not. R. Astron. Soc., 292, 289 (1997)
- (6) P.M. Garnavich et al.: Astrophys. J., Lett., 493, L53 (1998)
- (7) E. Gawiser, J. Silk: Science, 280, 1405 (1998)
- (8) E. Gawiser: Ph.D. Thesis, U. C. Berkeley, astro-ph/0005365 (1999)
- (9) E. Gawiser: Proceedings of PASCOS Conference, astro-ph/0005475 (2000)
- (10) W. Hu, D.J. Eisenstein, M. Tegmark: Phys. Rev. Lett., 80, 5255 (1998)
- (11) T. Kolatt, A. Dekel: Astrophys. J., 479, 592 (1997)
- (12) H. Lin et al.: Astrophys. J., 471, 617 (1996)
- (13) S. Perlmutter et al.: Nature, 391, 51 (1998)
- (14) J. Robinson, E. Gawiser, J. Silk: Astrophys. J., 532, 1 (2000)
- (15) W. Sutherland et al.: preprint, astro-ph/9901189 (1999)
- (16) H. Tadros, G. Efstathiou, G. Dalton: Mon. Not. R. Astron. Soc., 296, 995 (1998)
- (17) P.T.P. Viana, A.R. Liddle: Mon. Not. R. Astron. Soc., 281, 323 (1996)