Near-infrared adaptive optics observations of galaxy clusters:
Abell~262 at z=0.0157,
J1836.3CR at z=0.414,
and
PKS~0743-006 at z=0.994
Abstract
We report on high angular resolution near-infrared (NIR) observations of three galaxy clusters at different redshifts using adaptive optics (AO). In the case of the barred spiral UGC~1347 in Abell 262 we presented the first AO results obtained using a laser guide star. The observations have been carried out with the MPE/MPIA adaptive optics laser guide star system ALFA and the ESO AO system ADONIS combined with the SHARP II+ camera built at MPE. The three clusters are well suited for high resolution investigations since bright field stars for tip-tilt or wavefront sensing are located close to the line of sight to cluster galaxies. In summary our high angular resolution NIR data combined with other information clearly indicates star formation activity or interaction between cluster members at all three redshifts. The results and implications for future high angular resolution adaptive optics observations are discussed in the framework of current galaxy and cluster evolution models.
For two barred galaxies in the Abell 262 cluster, UGC~1344 and UGC 1347, we interpret our NIR imaging results in combination with published radio, far-infrared, and H data in the framework of a star formation model. In addition to the star-forming resolved NIR nucleus in UGC 1347 we found a bright and compact region of recent and enhanced star formation at one tip of the bar. The ratio as well as the V K color of that region imply a starburst that happened about 107 years ago. For UGC 1344 we find that the overall star formation activity is low and that the system is deficient in fuel for star formation.
The importance of star formation in galaxy clusters is also supported by a comparison of seeing corrected nuclear bulge sizes of a sample of spiral galaxies within and outside the central HI deficient zone of the Abell 262 and Abell~1367 clusters. We find that the galaxies inside the Abell radii of both clusters show a tendency for more compact bulges than those outside. This phenomenon could be due to increased star formation activity triggered by interactions of cluster members inside the Abell radius.
The star formation activity in the two higher redshift clusters J1836.3CR and PKS 0743-006 is investigated via comparison to GISSEL stellar population models in JHK two-color-diagrams. While J1836.3CR is consistent with an evolved cluster, the objects in the field of PKS 0743-006 show indications of more recent star formation activity. The central object in J1836.3CR shows a radial intensity profile that is indicative for cD galaxies in a rich cluster environment. Extended wings in its light distribution may be consistent with recent or ongoing galaxy-galaxy interaction in this cluster.
Key Words.:
galaxies: ISM – galaxies: clusters – galaxies: stellar content – galaxies: star formation – clusters: individual (Abell 262)1 Introduction
Adaptive optics systems using natural and laser guide stars are an important observational tool that allow large ground based telescopes to operate at or close to the diffraction limit. Considerable improvements and successes have been obtained in installing such systems at several sites (Davies et al. Davies1999 (1999), Davies et al. Davies1998 (1998), Glindemann et al. Glindemann (1997), Quirrenbach et al. Quirrenbach (1997), Drummond et al. Drummond (1998), Hubin Hubin (1997), Max et al. Max (1997), Arsenault et al. Arsenault (1994)). However, it remains challenging to use them efficiently especially in the field of extragalactic observations. We have concentrated on three galaxy clusters at different redshifts for which adaptive optics observations were possible due to the presence of sufficiently bright reference stars in the corresponding fields.
The galaxy cluster Abell 262 (R.A.(2000) = 01h52.1m, DEC(2000) = 35∘40′) is one of the most conspicuous condensations in the Pisces-Perseus super cluster. It has a systemic velocity of 4704 km s-1 (, Giovanelli and Haynes Giovanelli1985 (1985)) and an Abell radius of = 1.75∘. It has been extensively studied in X-rays and in the radio. It is a spiral-rich cluster, characterized by the presence of a central X-ray source positioned on the D galaxy NGC 708 right at the center of the cluster. The distribution of galaxies in projection on the sky as well as in redshift space have been studied by Melnick and Sargent (Melnick (1977)), Moss and Dickens (Moss1977 (1977)), Gregory et al. (Gregory (1981)), and Fanti et al. (Fanti (1981)). The large number of spirals in this cluster as well as the presence of a central X-ray source and its low redshift make Abell 262 an ideal candidate to study the properties of member galaxies, such as HI content and star formation activity. As in many other rich galaxy clusters the member galaxies of Abell 262 show an HI deficiency towards the center of the cluster. For Abell 262 this phenomenon has been investigated by Giovanelli et al. (Giovanelli1982 (1982)), Giovanelli & Haynes (Giovanelli1985 (1985)) and others.
We used the new MPIA-MPE ALFA adaptive optics system at the Calar Alto 3.5 m telescope to observe two of the Abell 262 cluster members – UGC 1344 and UGC 1347 – at subarcsecond resolution. For UGC 1347 the observations were carried out using the ALFA laser guide star (LGS) and a nearby natural guide star (NGS) for tip-tilt correction. To our knowledge UGC 1347 is the first extragalactic source for which LGS assisted observations have been performed. For the UGC 1344 observations we used a nearby NGS as a wavefront reference.
As the two higher redshift clusters we selected J1836.3CR (R.A.(2000) = 13h45m, DEC(2000) = 00∘53′) at a redshift of (Couch et al. Couch (1998)) and an area around the quasar PKS 0743-006 at a redshift of (Hewitt & Burbidge Hewitt (1993)). Both fields contain bright guide stars with mag. that can be used as natural guide stars for adaptive optics observations.
Couch et al. (Couch (1998)) presented a catalogue of faint southern galaxy clusters identified on high-contrast film derivatives of a set of Anglo-Australian Telescope photographic plates. The cluster J1836.3CR is one of them. A bright star ( = 12 mag) is located about 60′′ north of 4 prominent cluster members for which redshifts have been determined. For three of four galaxies spectroscopy (Couch et al. Couch (1998)) indicates a redshift of and one galaxy has a redshift of . Couch et al. (Couch (1998)) use a cluster redshift of . At this redshift 1′′ corresponds to a linear distance of 6.8 kpc.
PKS 0743-006 is a quasar (R.A.(2000) = 07h45m53.37s, DEC(2000) = 00∘44′11.4′′) of visual magnitude = 17.1 mag at a redshift (Hewitt & Burbidge Hewitt (1993)). The radio spectrum has a convex shape with possible variability around the peak occurring between 5 and 10 GHz. Tornikoski et al. (Tornikoski (1993)) find this source strongly variable at 90 GHz. Variability by a few tenths of a magnitudes is also reported in the NIR (White et al. White (1988)). On the milliarcsecond angular resolution scale at cm wavelengths this object shows a classical core-jet structure (Stanghellini et al. Stanghellini (1997)). Within the errors, the whole radio flux density is accounted for by this structure. A natural guide star for adaptive optics observations is located at only about 12.2′′ northeast of the quasar.
In section 2 we describe the observations and data reduction as well as the adaptive optics systems we used. In section 3 we present the observational results and the data analysis for UGC 1347 (section 3.1) and for UGC 1344 (section 3.2) in conjunction with data available in the literature. In section 3.3 we outline the results we obtained for a sample of 11 spiral galaxies in the Abell 262 cluster and 15 spiral galaxies in the Abell 1367 cluster. In section 4 then we discuss the star formation activity in the observed cluster galaxies and give a summary and conclusions in section 5.
2 Observations and data reduction
Our new high spatial resolution observations in Abell 262 were carried out using the OMEGA-CASS camera mounted to the laser guide star adaptive optics system ALFA at the Calar Alto 3.5 m telescope. The observations for the two higher redshift clusters were obtained with the ESO AO system ADONIS. In the following we give a brief description of the two systems.
2.1 ALFA
The performance goal of ALFA is to achieve a 50% Strehl-ratio at 2.2 m under average seeing conditions (0.9′′), with good sky coverage. The adaptive optics (Glindemann et al. Glindemann (1997)) and the sodium laser guide star (Quirrenbach et al. Quirrenbach (1997), Davies et al. Davies1998 (1998)) have been designed and built as a joint project between MPIA in Heidelberg and MPE in Garching, both in Germany. The system is installed at the German/Spanish 3.5 m telescope on Calar Alto near Almeria, Spain.
The laser used for generating the artificial guide star is a high power continuous-wave dye laser. It is installed in the coudé lab of the telescope, and the laser beam is fed along the coudé train until it is picked off near the primary mirror and directed into a 50-cm launch telescope. The launched laser power is around 3 W, and produces a 9–10 mag sodium guide star. The tip-tilt correction is achieved using a natural guide star, currently with a limiting magnitude mag. The laser can be used for high order wavefront correction. In the wavefront sensor there are several lenslet arrays which can be interchanged, and the positions of the resulting laser beacon centroids in the Shack-Hartmann sensor are determined and used to derive coefficients of Zernike or Karhunen-Loeve modes which are then used to control a 97-actuator deformable mirror. The loop was closed on the laser guide star in September 1997, and it was first used to improve an image in December 1997 at a sampling rate of 60 Hz and correcting 7 modes plus tip and tilt.
OMEGA-CASS is a near-infrared camera for the Cassegrain focus of the 3.5 m telescope at Calar Alto, which is specialized for use at high spatial resolution and has been developed at the MPIA, Heidelberg. It is based around a Rockwell 10242 pixel HAWAII array, and has capabilities for broad and narrow band imaging, spectroscopy, and polarimetry over the 1.0–2.5m wavelength range. When used in conjunction with ALFA (/25), the pixel scales available are 0.04′′, 0.08′′, and 0.12′′ per pixel.
2.2 ADONIS
For the observations of the two higher redshift clusters we used the ESO adaptive optics system ADONIS (Beuzit et al. Beuzit (1994)). This system is operated at ESO’s 3.6 m telescope at La Silla, Chile, and includes the SHARP II+ camera built at MPE. The atmospheric wavefront distortions are measured with a Shack-Hartmann sensor at visible wavelengths and are corrected by a deformable mirror with 52 piezo actuators. This mirror is driven by a closed control loop with a correction bandwidth of up to 17 Hz. The natural guide star within the near-infrared isoplanatic patch must be brighter than about m mag. The SHARP II+ camera (Hofmann et al. Hofmann (1992), Eisenhauer et al. Eisenhauer (1998)) is based on a 2562 pixel NICMOS III detector. The wavelength range of our observations covers the atmospheric J, H and K bands. Compared with the Johnson K band, we used a somewhat narrower K′ filter (1.99 – 2.32 m) in order to reduce the thermal background.
2.3 The data
Goal of our investigation was to exploit structural information on galaxy cluster members from adaptive optics and seeing limited images and interpret the results making use of all available quantities and known correlations. The photometric quality of the data is of the order of 0.10m in the K- and H-band and 0.15m in the J-band. The sources were mainly selected on the basis of availability during the allocated observing time, the presence of bright AO reference stars, and the availability of additional literature data. The sample described at the end of section 2.3.1 was selected on the basis HI deficiency and beeing located within or outside the cluster‘s Abell radii.
2.3.1 Abell 262 and Abell 1367
The broad-band J, H, K images as well as first K-band adaptive optics data of the cluster member UGC 1347 were taken on November 10 and 12, 1997. K-band AO data of UGC 1344 and UGC 1347 as well as the direct imaging data of other cluster members were obtained on December 6 and 7, 1997. Many individual 5-second exposures were taken in all three bands and coadded after sky subtraction, flat-fielding and correcting for bad pixels. The integration times, pixel scales and angular resolutions of the final co-added images are listed in Tab. 1.
| date | source | band | scale | tint | resolution | mode | |||
|---|---|---|---|---|---|---|---|---|---|
| in 1997 | (′′/pixel) | (s) | (s) | FWHM (′′) | |||||
| Nov. 10-12 | UGC 1347 | J | 0.12 | 5 | 10 | 15 | 750 | 1.1 | direct |
| UGC 1347 | H | 0.12 | 5 | 8 | 15 | 600 | 1.0 | direct | |
| UGC 1347 | K | 0.12 | 5 | 8 | 15 | 600 | 0.9 | direct | |
| Dec. 6-7 | UGC 1347 | K | 0.12 | 5 | 2 | 15 | 150 | 1.2 | open loop |
| UGC 1347 | K | 0.12 | 5 | 5 | 15 | 375 | 0.4 | closed loop | |
| UGC 1344 | K | 0.08 | 5 | 2 | 15 | 150 | 0.9 | open loop | |
| UGC 1344 | K | 0.08 | 5 | 5 | 15 | 375 | 0.4 | closed loop | |
| all others | K | 0.12 | 4 - 5 | 2 | 15 | 150 | 1.2 - 1.4 | direct |
| date | band | scale | resolution | ||||
|---|---|---|---|---|---|---|---|
| in 1996 | (′′/Pixel) | (s) | (s) | FWHM (′′) | |||
| Apr. 26 | K′ | 0.10 | 60 | 5 | 2400 | 0.20 | |
| H | 0.10 | 60 | 5 | 4 | 1200 | 0.20 | |
| J | 0.10 | 60 | 5 | 4 | 1200 | 0.30 | |
| Apr. 27 | K′ | 0.05 | 60 | 5 | 1500 | 0.18 | |
| H | 0.05 | 60 | 5 | 1200 | 0.20 | ||
| Apr. 29 | K′ | 0.05 | 60 | 5 | 2 | 600 | 0.18 |
| J | 0.05 | 60 | 5 | 4 | 1200 | 0.25 | |
| May 5 | K′ | 0.05 | 60 | 5 | 3 | 900 | 0.18 |
| H | 0.05 | 60 | 5 | 3 | 900 | 0.20 | |
| J | 0.05 | 60 | 5 | 2 | 600 | 0.25 |
| date | band | scale | resolution | ||||
|---|---|---|---|---|---|---|---|
| in 1996 | (′′/Pixel) | (s) | (s) | FWHM (′′) | |||
| Apr. 26 | K′ | 0.10 | 30-60 | 5 | 3000 | 0.20 | |
| H | 0.10 | 20 | 10 | 4 | 800 | 0.20 | |
| J | 0.10 | 30 | 5 | 4 | 600 | 0.30 | |
| Apr. 27 | K′ | 0.10 | 60 | 3 | 3 | 540 | 0.20 |
| K′ | 0.05 | 60 | 5 | 2 | 600 | 0.20 | |
| Dec. 20 | K′ | 0.10 | 60 | 5 | 4 | 1200 | 0.20 |
| H | 0.10 | 60 | 5 | 2 | 600 | 0.25 | |
| J | 0.10 | 60 | 5 | 1 | 300 | 0.40 | |
| Dec. 21 | K′ | 0.05 | 60 | 5 | 8 | 2400 | 0.20 |
| H | 0.05 | 60 | 5 | 1 | 300 | 0.25 |
Calibration of the NIR data was accomplished by observation of the standard star 2Ceti. Sky data were taken separately 120′′ east of UGC 1344 and UGC 1347. For the other cluster members a median sky was obtained from the 4 to 5 settings taken with different offset positions from the target sources. The galaxies UGC 1344 and UGC 1347 had sufficiently bright reference stars nearby to observe them with the ALFA adaptive optics system. In order to estimate the image improvement we took data in open loop before and after the closed loop exposures. For UGC 1347 the wavefront data on the laser guide star were taken at a sampling rate of 60 Hz through a 33 lenslet array with field sizes of 3′′ diameter. Correcting for a total of 7 Zernike modes plus tip and tilt a disturbance rejection bandwidth of up to 5 Hz was achieved. The tip and tilt information was derived from a nearby natural reference star.
In Fig. 1 we show an image through the TV-guider shortly after the LGS-supported AO observations of UGC 1347 were made.
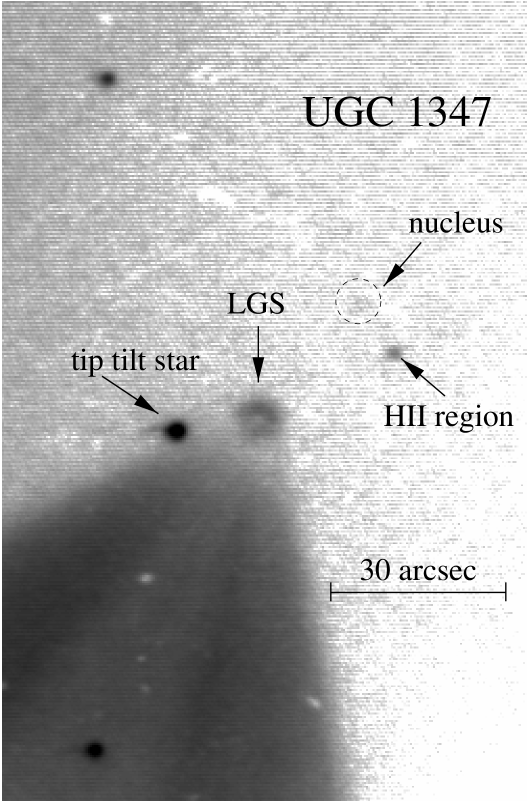
The image is focused on the stars – so the LGS appears as a defocused image at the tip of the Rayleigh cone. We had placed the LGS between the tip-tilt reference star and the nucleus of UGC 1347, such that the image of the star which is also in the field of view of the NIR camera could be used as the point spread function (PSF) with the same degree of correction as the nucleus and most of the galaxy. On the reference star for UGC 1344 the loop was closed using the same lenslet array and a camera frame rate of 100 to 200 Hz resulting in a slightly higher rejection bandwidth. Although we did not reach the diffraction limit due to the low sampling rate and the small number of subapertures, definite improvements in angular resolution were achieved. The corresponding full-width-half-maximum (FWHM) values are given in Tab. 1. In the case of UGC 1347 the image improvement could independently be monitored via a star in the same field at approximately the same separation from the reference star as the target object. The two stellar images agreed very well with each other indicating that all the sources were well within the isoplanatic patch and that the images of the reference stars can safely be taken as the PSF to clean the galaxy images.
In addition to the adaptive optics data we took seeing limited images with exposure times of 10 minutes each of 9 galaxies in Abell 262 and 15 spirals in Abell 1367 (see section 3.3 for further details).
2.3.2 J1836.3CR and PKS 0743-006
We observed these clusters using the SHARPII+ camera together with the ESO adaptive optics system ADONIS on the 3.6 m telescope on La Silla, Chile. The observations were conducted during the nights from April 26 till May 1, 1996. A bright star was used to lock the AO system. We took a series of 60 second exposures in a dither mode in the near-infrared J, H, and K′ bands, using pixel scales of 0.05 and 0.10 ”/pixel. The total integration times and the angular resolution measured on a PSF reference are listed in Tab. 2 and Tab. 3.
3 Results
In the following we will present the results obtained for the two galaxies UGC 1347 and UGC 1344 that were observed with the ALFA adaptive optics system as well as for a sample of galaxies located in the inner and outer part of the Abell 262 and Abell 1367 clusters. We also describe source properties at other wavelengths as well as quantities that we derived from them. The description of this derivation is given in detail for UGC 1347. For UGC 1344 we have used the same approach and only summarize the results. We regard the corresponding analysis as an important consistency check between our own data and the data and correlations available in the literature. Data on external galaxies even at lower or medium redshift will always be sparse and it is required to make use of all the knowledge available to allow for a full comparison to what is known in the local universe and at different redshifts.
Although our NIR data has a subarcsecond resolution we extracted K-band and H fluxes in larger apertures to conduct a starburst analysis in section 4. The reason for this is that the radio and bolometric luminosities for individual source components especially the nucleus, disk, and southern component in UGC 1347 can only be estimated indirectly and can probably only be attributed to larger regions. We have chosen a circular aperture of 7.2′′ diameter corresponding to a linear size of 2.2 kpc.
3.1 UGC 1347
UGC 1347 is an almost face-on SBc galaxy located at R.A.(2000) = 01h52m45.9s and DEC(2000) = 36∘37′09′′ approximately 57′ north of the center of Abell 262, well within the region in which the largest amount of HI deficiency is observed. There is a bright field star (PPM 1111, = 11.5 mag) located about 37′′ to the southeast of the galaxy. The HI content of UGC 1347 was first studied by Wilkerson (Wilkerson (1980)). Velocity fields and intensity maps were obtained in HI by Bravo-Alfaro (Bravo-Alfaro (1997)) and in H by Amram et al. (Amram (1994)). Amram et al. (Amram (1994)) quote an inclination of . Oly and Israel (Oly (1993)) measured the 327 MHz radio continuum flux density of UGC 1347, and the far-infrared flux densities as measured by IRAS can be found in the IRAS point source catalogue (Lonsdale et al. Lonsdale (1985)). The HI and H data indicate a systemic velocity of UGC 1347 of 5524 km s-1 (Wilkerson Wilkerson (1980)) and 5478 km s-1 (Amram et al. Amram (1994)), respectively. Here we assume that the difference of approximately 800 km s-1 between the cluster velocity of 4704 km s-1 and the systemic velocity is due to the motion of the galaxy within the cluster. We therefore adopt for UGC 1347 the cluster distance of 63 Mpc or a redshift of assuming = 75 km s-1 Mpc-1. At this distance 1′′ corresponds to about 310 pc.
3.1.1 Near-infrared emission from UGC 1347
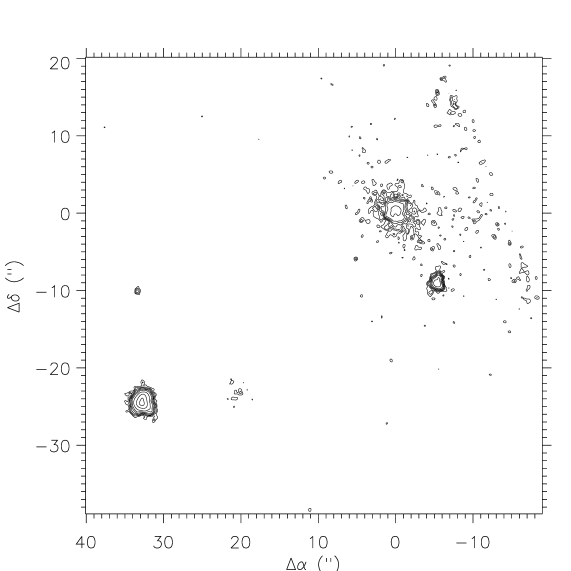
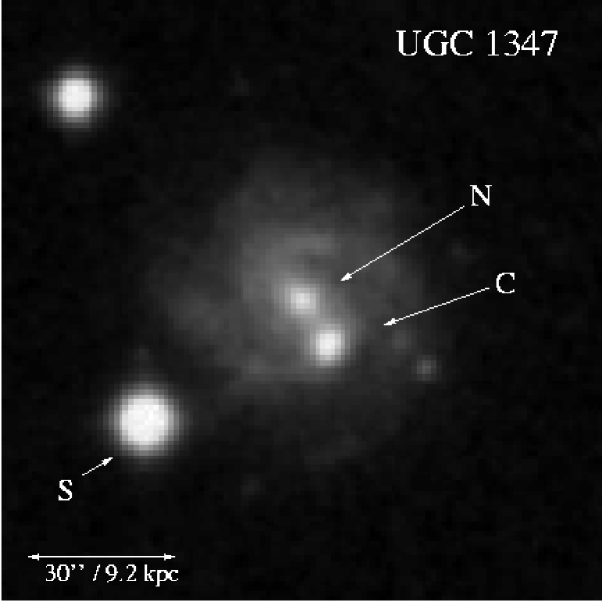
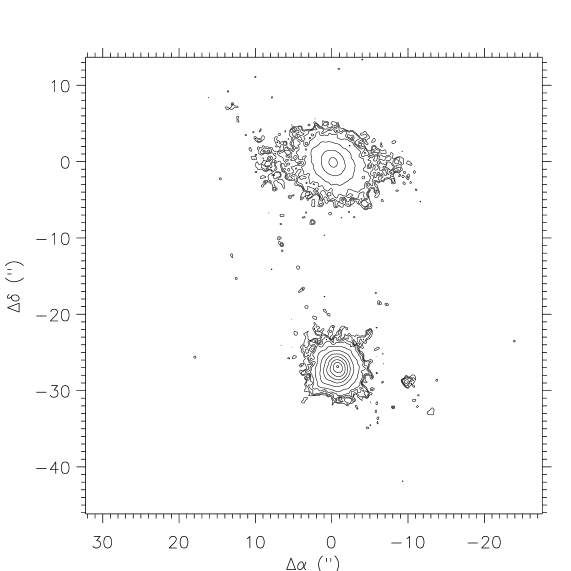
The NIR emission of UGC 1347 is dominated by two almost equally bright components at a separation of 8.85′′ (or 2.74 kpc) oriented approximately north-south. In Fig. 2 we show the NIR continuum emission from UGC 1347 together with the digitized sky survey V-band image in Fig. 3.
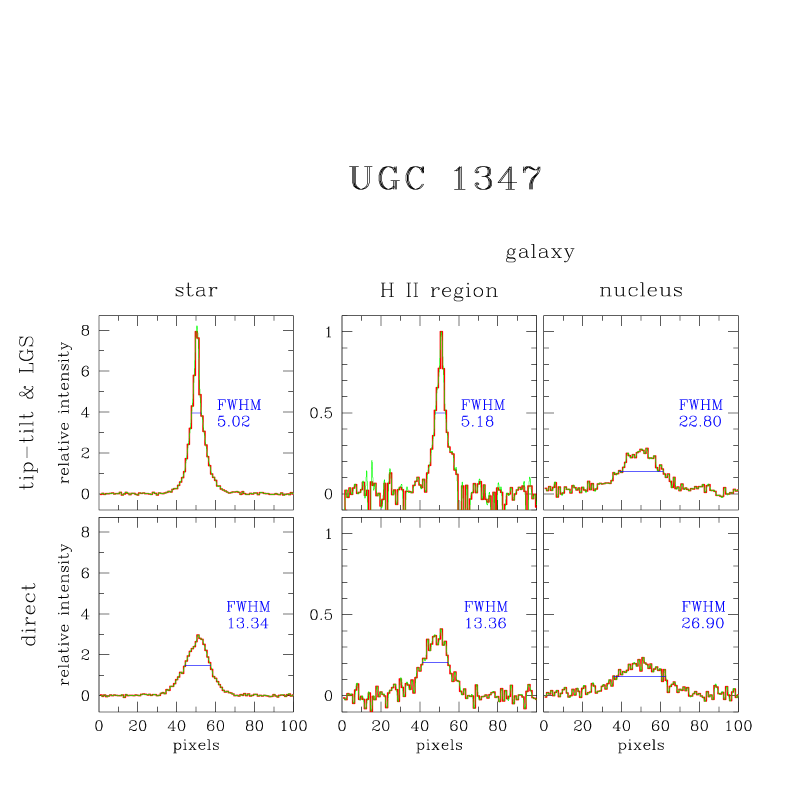
In Fig. 4 we show NIR intensity profile cuts of the nucleus, the bright off-nuclear source, and the star PM 1111 in both open loop and closed loop. We have used the image of PPM 1111 as the point spread function and deconvolved the NIR continuum image of UGC 1347 with a Lucy-Richardson algorithm (Lucy Lucy (1974)). From the comparison of the images in Figures 2 and 3 and the deconvolved image it is evident that the northern component coincides with the nucleus of UGC 1347 and has an extent of about 1′′ (corrected for the FWHM of the PSF; see Tab. 1) corresponding to a diameter of about 310 pc. The southern compact component is located at the southern tip of the galaxy bar and is unresolved compared to the 0.40′′ FWHM PSF. We estimate an upper limit to its angular extent of 0.15′′ corresponding to less than 45 pc.
The J, H, and K flux densities listed in Tab. 4 were measured in 4.8′′, 3.6′′, 2.4′′, 1.2′′ and 0.72′′ diameter circular apertures centered on each component.
In Fig. 5 we show the locations of the multi-aperture data in the J H, H K two color diagram. The graph indicates that the nuclear colors are in agreement with a stellar disk population reddened with an of about 4 mag corresponding to about 0.6 magnitudes of reddening in the K band. The value of = 4 mag is large with respect to color variations due to differences in stellar population, age, and metallicity from a “normal“ Sc disk population. Here we assumed a screen model for the extinction. In case of a mixed model the extinction may be even large. In addition to simple reddening there may also be some contribution from hot dust to the nuclear NIR emission. In the case of the southern component, however, the colors from a normal stellar disk population are apparently more influenced by additional emission from hot dust and an extinction of 2 mag (corresponding to the arrows in the figure ledgend). In both components the reddening and the influence from hot dust emission increase with decreasing aperture size. This indicates a decrease in dilution by a surrounding or underlying stellar population unaffected by reddening. The southern component is probably similar to the red knot found in the nearby spiral NGC 7552 (Schinnerer et al. Schinnerer (1997)) and is likely region of recent active star formation in the disk. However, its emission may very well be contaminated by red super-giants (see results of our starburst analysis in section 4.2). The contribution of hot dust in the nucleus may be indicative for star formation activity there as well.
In order to analyze the NIR data in conjunction with other data taken from the literature we used a starburst model as described in section 4.
| aperture diameter | 4.8′′ | 3.6′′ | 2.4′′ | 1.2′′ | 0.72′′ | |
|---|---|---|---|---|---|---|
| UGC 1347 | ||||||
| nucleus | J | |||||
| H | ||||||
| K | ||||||
| H K | ||||||
| J H | ||||||
| southern | J | |||||
| component | H | |||||
| K | ||||||
| H K | ||||||
| J H | ||||||
| UGC 1344 | ||||||
| nucleus | K | |||||

3.1.2 The K-band luminosity
Our K-band images allow us to calculate the nuclear K-band luminosity and compare it to an estimate of the K-band luminosity from the extended disk and southern component of UGC 1347. The results are listed in Tab. 5 and Tab. 6.
The K-band luminosity is calculated via
| (1) |
where is the distance in Mpc and is the 2.2 m flux density in mJy (Krabbe et al. Krabbe (1994)). We found K-band flux densities of 5.5 mJy for the extended nucleus and 3.7 mJy for the southern compact component measured in 7.2′′ diameter apertures. In the previous section we have shown that the K-band flux density of the southern component is clearly contaminated by emission of hot dust. The J H colors are less effected by hot dust emission and correspond to that of an un-reddened stellar population. We have therefore calculated the stellar K-band flux density from the H-band magnitude using the standard spiral disk colors with H K = 0.21 (e.g. Frogel et al. Frogel (1978)). The K-band flux density of the southern component corrected for the contribution of hot dust is then reduced to about 3 mJy ( = 13.3 mag) resulting in a K-band luminosity of 1.5108 .
In order to estimate the K-band luminosity of the disk we used the total H-band magnitude of 10.48 mag measured by Gavazzi et al. (Gavazzi1996b (1996)) For a mean H K color of 0.21 (Frogel et al. Frogel (1978)) this results in a total K-band flux of the order of 49 mJy corresponding to a total K-band luminosity of = 2.1109 . Correcting for the contribution of the nucleus and the southern component we obtain a K-band flux and luminosity for the disk of UGC 1347 of about 40 mJy and = 1.6109 .
| UGC 1347 | UGC 1344 | |
| [ ] | 3.2109 | 109 |
| [ ] | 3.2109 | 3.3108 |
| [ ] | (0.5-1)1011 | (0.8-1.2)1010 |
| [ ] | 2.1109 | 3.7109 |
| [ ] | 5.5108 | 108 |
| [ ] | 1.181010 | 4109 |
| [yr-1] | 0.044 | 0.012 |
| 24 – 48 | 2.2 – 3.3 | |
| 21 | – | |
| 5.6 | 1.1 | |
| 3.8 | 37 | |
| 10 | 0.08 | 0.12 |
| 10 | 3.7 | 3 |
| Nucleus | Disk | Southern | |
| Component | |||
| [ ] | 3.7108 | 1.6109 | 1.5108 |
| [ ] | 9107 | 4.2108 | 4.2107 |
| [ ] | 8.6109 | 3.2109 | – |
| [yr-1] | 0.044 | 0.002 | – |
| 23 | 2.0 | – | |
| 95 | 7.6 | – | |
| 4.1 | 3.8 | 4 | |
| 10 | 0.49 | 0.005 | – |
| 10 | 5.1 | 0.6 | – |
3.1.3 The Lyman continuum luminosity
For the overall galaxy as well as for individual components an estimate of the H luminosities have been obtained using the continuum and H line images kindly provided by Amram et al. (Amram (1994); P. Amram and M. Marcelin 1998, private communication). Both the continuum and H line images were taken simultaneously with the same spectral resolution. They have a field of view of and include all of UGC 1347. Main purpose of these observations was to derive the H velocity field. In order to determine flux densities we used an estimate of the total H continuum flux density of UGC 1347 to calibrate the data. The H continuum flux density was obtained via a linear interpolation between the flux densities derived from the total H-band and V-band magnitudes as given in Gavazzi & Boselli (Gavazzi1996a (1996)). Although uncertain by probably 30% this estimate allows us to further probe the consistency of the available data with our own measurements and starburst analysis. The corresponding calibration factor between the measured and calculated H continuum was applied to the H line data. Finally the Lyman continuum luminosity then was derived from the H flux density and the source distance via:
| (2) |
(following Osterbrock Osterbrock (1989)). Without extinction correction we obtain about 2.3108 for the overall Lyman continuum luminosity of UGC 1347. In 7.2′′ diameter apertures centered on the nucleus and on the southern component we obtain approximately 107 and 2107 , respectively. In the following we assume the following values for the extinction, which are based on the JHK measurements and (for the disk) on comparisons to other galaxies: nucleus = 3 mag, southern component = 1 mag, and disk 1 mag. Furthermore we use (Draine Draine (1989)). The corresponding extinction-corrected Lyman continuum luminosities are given in Tab. 5 and Tab. 6.
3.1.4 The gas content and total mass
The HI content of UGC 1347 was measured by Wilkerson (Wilkerson (1980)) using the
Arecibo telescope with a 3.2′ beam. The distribution of atomic hydrogen in UGC 1347
was studied by Bravo-Alfaro (Bravo-Alfaro (1997)) using the Westerbork
Synthesis Radio Telescope. The interferometric measurements
show that the HI gas extends well beyond the optical disk although the FWHM
of the distribution is in approximate agreement with the optical extent.
The HI (Bravo-Alfaro Bravo-Alfaro (1997)) and H (Amram et al. Amram (1994)) rotation curves
are in good agreement.
The image suggests a slight HI line flux enhancement to the south-east
and extensions to the west and north.
Assuming a distance of 67 Mpc Wilkerson (Wilkerson (1980)) obtained
3.5109 of atomic hydrogen gas containing most
of the overall HI content of the galaxy.
Scaled to our adopted distance of 63 Mpc this results in
MHI = 3.2109 .
No direct measurement of the
molecular gas mass in UGC 1347 is available. As an estimate we use the
IRAS far-infrared (FIR) flux densities and a dust temperature of 22 K
(see the following section) and
the molecular hydrogen mass to LFIR correlation by Young &
Scoville (Young (1991)). We estimate a molecular hydrogen mass of approximately
= 3.2109 . The resulting
ratio of 1 is then consistent with the value expected for late type spirals
(Young & Scoville Young (1991)).
Although the determination of the molecular gas mass is uncertain, it is very unlikely that it is wrong by a large factor, say 10, since the age derived from
is fully consistent
with the and ratios (see section 4.2)
for tis age.
We note that we implicitly assume a standard
conversion factor. We also note, that is of
the order of 0.1 for optical selected galaxies, while
is found for infrared selected samples. This is consistent with
UGC 1347 being listed in the IRAS point source catalogue (see below).
The measured HI line width of 144 km s-1 (Wilkerson Wilkerson (1980))
and the H velocity field corrected for
the inclination of (Amram et al. Amram (1994)) indicates a full
velocity width covered by the rotation curve of km s-1.
Following Shostak (Shostak (1978)) and Heckman et al. (Heckman (1978))
this allows to estimate the total dynamical mass of UGC 1347
as = (0.5–1.0)1011 . The resulting total gas to
dynamical mass ratio ( of about 5% to 10%
is in agreement with typical values found for spiral galaxies
(Shostak Shostak (1978)).
3.1.5 The FIR luminosity
The FIR luminosity can be derived using the 60 m and 100 m IRAS flux densities of = 1.40 Jy of = 3.84 Jy as listed in the IRAS point source catalogue. At both wavelengths UGC 1347 is fully contained in the large IRAS beams. Following the formalism given by Lonsdale et al. (Lonsdale (1985)) and Fairclough (Fairclough (1985)) we find a total . From the 60 m and 100 m data we calculate a dust color temperature of 22 K assuming an emissivity proportional to (Hildebrand Hildebrand (1983)) and a silicate to graphite ratio of 7:3 (Whittet Whittet (1981)).
We can also estimate how large the disk and nuclear contributions to the FIR luminosity are. Here we assume that a dominant fraction of the disk FIR emission originates in diffuse interstellar dust and gas clouds which are heated by the interstellar UV radiation field of the stellar disk population. These clouds have correspondingly large volume and disk area filling factors. To obtain a first order estimate of the disk and nuclear contributions we assume that for this population of clouds the FIR flux densities can be estimated by adopting the relation found for “cirrus” emission in our Galaxy (De Vries et al. De Vries (1987), Helou Helou (1986)). These relations have already successfully been applied to extragalactic objects by Eckart et al. (Eckart1990 (1990)) for Centaurus A and by Jackson et al. (Jackson (1991)) for NGC 2903. Following De Vries et al. (De Vries (1987)) the far-IR flux density of the “cirrus” emission in Ursa Major can be obtained via
| (3) |
where is the flux density of the background emission, the HI column density, and the integrated 12CO(10) line flux. The authors determine the constants and as MJy sr-1 cm2 and MJy sr-1 K-1 km-1 s. Here we assume that IRAS point source data do not have to be corrected for significant contributions of any background emission. In order to obtain a lower limit to the FIR contribution of the disk to the overall FIR luminosity we just calculate the contribution expected from the atomic HI gas which is mostly distributed throughout the disk. The disk diameter of about 24.5 kpc and the adopted HI mass of = 3.2109 result in a 100 m flux density contribution of about 8.6 MJy sr-1. Integrated over the disk this gives a flux density of = 1.26 Jy. For a total molecular gas mass of 3.2109 we find a 100 m flux density contribution of the order of 0.3 mJy. The total disk flux density at 100 m thus amounts to 1.56 Jy. With a mean ratio between the 60 and 100 m flux density contribution for cirrus clouds of log( (Helou Helou (1986)) the expected 60 m flux density from the disk is = 0.35 Jy. These disk values can now be used to derive the nuclear FIR flux densities and luminosity (Tab. 5 and Tab. 6). Here we assume that the contribution of the southern compact component to the FIR luminosity is negligible because of the small filling factor of the source in the IRAS beam.
Although the presented decomposition of the FIR flux densities is very indirect, the FIR luminosities of the nucleus and disk are consistent with what one expects from the relation between the radio continuum and the FIR luminosity (Wunderlich & Klein, Wunderlich (1988)).
3.1.6 The supernova rate
Oly and Israel (Oly (1993)) measured a 327 MHz flux density of UGC 1347 of = 23.6 mJy in a 55′′ beam. The difference between peak and integrated flux density is only 0.5 mJy. The disk size of UGC 1347 is of the order of 90′′ diameter. If the radio flux density were be dominated by the central 10% (30%) of the disk this would result in an approximately 3% (30%) deviation between the two quantities. In addition the source shows no clear indications for extended emission in the NRAO VLA Sky survey at 1.4 GHz (Condon et al. Condon1996 (1996)) with a beam size of 45′′. Therefore we assume that almost all of the flux density can be attributed to the nuclear region and that less than 1/20 of the radio emission originates in the disk of UGC 1347. Using a mean spectral index () between 327 MHz and 1420/5000 MHz of , which the authors obtained for a sample of 35 UGC galaxies, we estimate a 5 GHz flux density of = 3.41 mJy. This value can be used to calculate the supernova rate via
| (4) |
(Condon Condon1992 (1992)). For UGC 1347 we find a supernova rate of = 0.044 yr-1. This value for the nuclear region of UGC 1347 is of the same order as the estimated overall supernova rate in the Milky Way of (0.025 0.006) yr-1 (Tammann et al. Tammann (1994)). For the disk of UGC 1347 we adopt an upper limit of = 0.002 yr-1. This determination of the SNR assumes that there is no major contribution to the radio flux density by an active nucleus. In all star burst analyzes were such a contribution could be excluded or was unlikely the derived SNR have shown to be consistent with other measurements of the star formation activity in the framework of the star burst model calculations.
3.2 UGC 1344
UGC 1344 is a SBc galaxy with an inclination of about (data in UGC catalogue and visual inspection) located at R.A.(2000) = 01h52m34.8s and DEC(2000) = 36∘30′02′′ approximately 21′ north of the center of Abell 262. Like UGC 1347, it is well within the inner region in which the largest amount of HI deficiency is observed. A bright field star (GSC 2319-0343, = 11.0 mag) is located about 23′′ to the south. In Tab. 5 we list all parameters and estimates for UGC 1344 that were derived in a similar way as described above for UGC 1347.
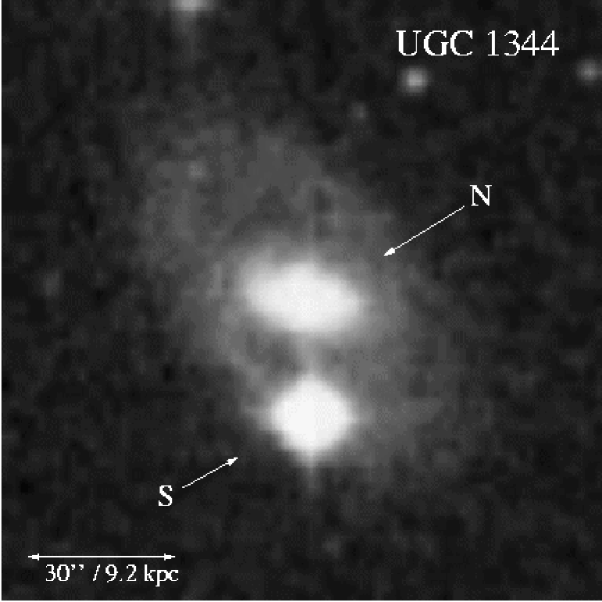
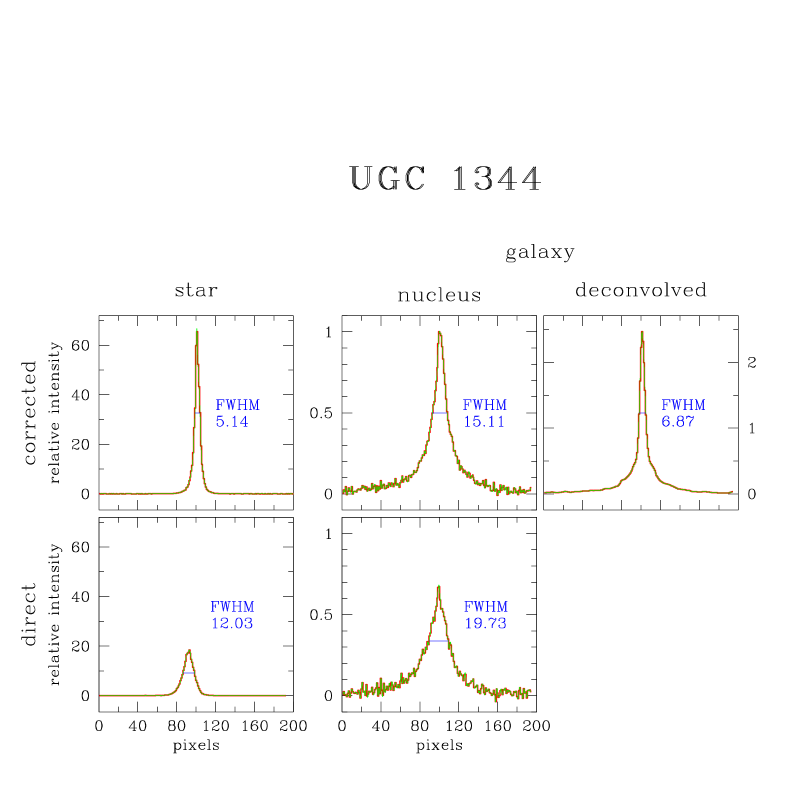
Fig. 6 shows the NIR continuum emission from UGC 1344 together with the digitized sky survey V-band image in Fig. 7. We have used the image of the nearby reference star as the PSF and deconvolved the NIR continuum image of UGC 1344 with a Lucy-Richardson algorithm. In Fig. 8 we show intensity profile cuts through the nuclear component of UGC 1344 and the reference star, for both open and closed loop as well as deconvolved.
The K-band flux density distribution of UGC 1344 is very centrally peaked but smoothly connects to the extended disk. The central 3′′ of the bulge contain about half of the K-band flux density in a 10′′ aperture. For the nuclear component we measured a K-band flux density of 12 mJy in a 7.2′′ aperture. This is about a factor of 1.7 more than for UGC 1347. As for UGC 1347 the K-band disk luminosity can be estimated from the deep H-band image presented by Gavazzi et al. (Gavazzi1996b (1996)) as = 9.81 mag. For a mean H K color of 0.21 (Frogel et al. Frogel (1978)) this results in a total K-band flux of the order of 91 mJy. Correcting for the contribution of the nucleus we obtain a K-band flux and luminosity for the disk of UGC 1344 of about 81 mJy and = 3.7109 .
Amram et al. (Amram (1994)) did not detect UGC 1344 in H using a similar integration time as for UGC 1347 (P. Amram and M. Marcelin 1998, private communication). Based on the data obtained for UGC 1347 we adopt here an upper limit for the Lyman continuum luminosity of 108 for the entire galaxy.
The HI content of UGC 1344 has been studied by Wilkerson (Wilkerson (1980)). A weak line has been detected at a systemic velocity of 4155 km s-1 and a width of 103 km s-1 (Wilkerson Wilkerson (1980)). Again we assume that the difference of approximately 550 km s-1 between the cluster velocity of 4704 km s-1 and the systemic velocity are due to the motion of the galaxy within the cluster and adopt the same distance of 63 Mpc as for UGC 1347. From the HI detection Wilkerson (Wilkerson (1980)) derived an upper limit of the HI mass of 3.3108 (scaled to the adopted distance of 63 Mpc).
Oly and Israel (Oly (1993)) measured the 327 MHz radio continuum flux density of UGC 1347. The difference between the integrated 327 MHz flux density of 6.2 mJy and the peak flux density of 4.99 mJy in a beam indicates that not all of the radio emission can be associated with the nuclear component but that at least 1 mJy is due to extended emission. If the radio emission had a Gaussian distribution the angular size would be of the order of about 30′′ to 40′′ suggesting that this possible extended emission is distributed over the entire disk of UGC 1344.
From an inspection of the IRAS all sky survey we estimate an upper limit of the flux density at a wavelength of 100 m of 0.5 Jy. Assuming a FIR spectrum similar to that of UGC 1347 this results in an upper limit of the far-infrared luminosity of 4109 .
3.3 Near-infrared imaging of the sample
In addition to the adaptive optics observations of UGC 1344 and UGC 1347 we took seeing-limited images of additional 9 spiral galaxies (a total of 11) in the Abell 262 cluster and 15 spiral galaxies in the Abell 1367 cluster. They were selected according to their HI deficiency and separation from the cluster center as given by Giovanelli et al. (Giovanelli1982 (1982)) and listed in Tab. 7 and Tab. 8.
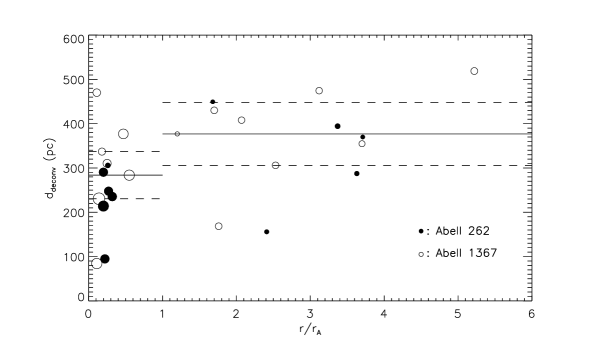
A sample of 6 galaxies in Abell 262 and 7 galaxies in Abell 1367 was selected from the central parts of the clusters. In both cases they have separations from the cluster center less than 0.55 Abell radii ( = 1.75∘ for Abell 262 and = 1.40∘ for Abell 1367) and HI deficiencies (as defined in Giovanelli et al. Giovanelli1982 (1982)) ranging between 0.06 and 1.18. The only exception is UGC 1347 with a deficiency of which is HI rich for a galaxy within the Abell radius. A second sample of 5 galaxies in Abell 262 and 8 galaxies in Abell 1367 was selected from the outer cluster regions. Here the separations from the cluster center range from 1.2 to 5.2 Abell radii and the HI deficiencies range from 0.03 to 0.6. Our K-band images of these sources contain in almost all cases reference stars that allowed us to accurately estimate the seeing. If no star was contained in the image we used the stars in adjacent exposures as a reference. From radial averages centered on the galaxy nuclei and on the stars we extracted the sizes as FHWM values (as listed in Tab. 7 and Tab. 8) and deconvolved the measurements on the galaxies with the stellar data via quadratic subtraction assuming Gaussian flux distributions of the sources. A comparison to our AO results on UGC 1347 and UGC 1344 shows that this procedure gives reliable estimates of the bulge sizes. In Fig. 9 we plot the deconvolved nuclear source sizes against the distance from the cluster center. To combine the data sets we scaled the results according to the mean radial velocities of the two galaxy clusters and corrected the Abell 1367 data to the distance of the Abell 262 cluster. For the galaxies close to the cluster center we find a median nuclear FWHM and median deviation from that value of 0.77′′ 0.07′′. For the outer sources the result is 1.10′′ 0.18′′. The difference between the two median values is 2.6 times the mean of the two median deviations. A Kolmogorov-Smirnov test shows that the two distributions are different at the 85% level. This result provides evidence that the K-band flux density distribution of the galaxy bulges in the inner part of the cluster are systematically smaller than those in the outer part. This result is discussed in section 4.3.
4 Discussion
The data on UGC 1344 and UGC 1347 indicate ongoing or recent nuclear star formation. The implications from that provide a framework in which the properties of our Abell 262 and Abell 1367 sample can be explained as well.
4.1 The starburst model
To derive the properties of a starburst from the observed continuum and line intensities we have used the starburst code STARS. This model has been successfully applied to NGC 1808 (Krabbe et al. Krabbe (1994), Tacconi-Garman et al. Tacconi-Garman (1996)), NGC 7469 (Genzel et al. Genzel (1995)), NGC 6764 (Eckart et al. Eckart1996 (1996)) and NGC 7552 (Schinnerer et al. Schinnerer (1997)). A description of the model can be found in the appendices of Krabbe et al. (Krabbe (1994)) and Schinnerer et al. (Schinnerer (1997)). The model is similar to other stellar population synthesis models (Larson & Tinsley Larson (1978), Rieke et al. Rieke1980 (1980), Gehrz et al. Gehrz (1983), Mas-Hesse & Kunth Mas-Hesse (1991), Rieke et al. Rieke1993 (1993), Doyon et al. Doyon (1994)) and includes the most recent stellar evolution tracks (Schaerer et al. Schaerer (1993), Meynet et al. Meynet (1994)).
We assume power-law initial mass functions (IMFs) which vary as between a lower and upper mass cut-off, = 1 and = 100 , with an index = 2.35 (Leitherer Leitherer (1996), Salpeter et al. Salpeter (1955)). STARS has as output observable parameters such as the bolometric luminosity , the K band luminosity , the Lyman continuum luminosity and the supernova rate , as well as the diagnostic ratios between these quantities. The adopted values for , , , and have been derived from observed properties in the previous sections. All relevant quantities as well as the diagnostic ratios that can be calculated from them for the present analysis are listed in Tab. 5 and Tab. 6. All the ratios are measures of the time evolution and the shape of the IMF, with slightly different dependencies on and .
| Galaxy | / | HI- | (′′) | (′′) | ddeconv(′′) | Comment |
|---|---|---|---|---|---|---|
| Deficiency | ||||||
| UGC~1045 | 3.71 | -0.26 | 1.36 | 0.63 | 1.21 | |
| UGC~~909 | 3.63 | -0.13 | 1.13 | 0.63 | 0.94 | |
| UGC~1125 | 2.41 | -0.20 | 0.80 | 0.62 | 0.51 | |
| UGC~1069 | 3.37 | -0.03 | 1.42 | 0.59 | 1.29 | |
| UGC~1178 | 1.68 | -0.27 | 1.58 | 0.59 | 1.47 | tip-tilt |
| UGC~1366 | 0.32 | 0.81 | 0.95 | 0.55 | 0.77 | |
| UGC~1307 | 0.27 | 0.77 | 0.99 | 0.57 | 0.81 | |
| UGC 1347 | 0.26 | -0.07 | 1.24 | 0.73 | 1.00 | AO |
| UGC~1338 | 0.22 | 0.79 | 0.81 | 0.59 | 0.31 | tip-tilt |
| UGC 1344 | 0.20 | 0.78 | 1.08 | 0.51 | 0.95 | AO |
| UGC~1350 | 0.20 | 1.18 | 0.91 | 0.58 | 0.70 |
| Galaxy | / | HI- | (′′) | (′′) | (′′) |
|---|---|---|---|---|---|
| Deficiency | |||||
| UGC~7040 | 5.22 | -0.01 | 1.26 | 0.47 | 1.17 |
| UGC~7087 | 3.70 | -0.20 | 0.94 | 0.48 | 0.80 |
| UGC~6483 | 3.12 | -0.08 | 1.26 | 0.66 | 1.07 |
| UGC~6891 | 2.53 | -0.06 | 0.84 | 0.48 | 0.69 |
| UGC~6693 | 2.07 | -0.09 | 1.02 | 0.44 | 0.92 |
| UGC~6876 | 1.76 | -0.04 | 0.90 | 0.82 | 0.38 |
| UGC~6863 | 1.70 | -0.04 | 1.14 | 0.60 | 0.97 |
| UGC~6583 | 1.20 | -0.60 | 1.12 | 0.72 | 0.85 |
| UGC~6746 | 0.55 | 0.79 | 0.88 | 0.60 | 0.64 |
| UGC~6663 | 0.47 | 0.65 | 1.01 | 0.54 | 0.85 |
| UGC~6719 | 0.25 | 0.28 | 0.95 | 0.64 | 0.70 |
| UGC~6702 | 0.18 | 0.06 | 1.01 | 0.66 | 0.76 |
| UGC~6718 | 0.14 | 1.09 | 1.02 | 0.88 | 0.52 |
| UGC~6688 | 0.11 | 0.80 | 0.53 | 0.49 | 0.19 |
| UGC~6697 | 0.11 | 0.16 | 1.25 | 0.66 | 1.06 |
4.2 Nuclear star formation in UGC 1347 and UGC 1344
UGC 1347: The diagnostic ratios (Tab. 5 and 6) and the framework of the starburst model now allow us to discuss the star formation for the whole of UGC 1347 as well as for the nucleus, the southern component and the disk. In summary the overall disk data of UGC 1347 are consistent with a high age and constant star formation, whereas the data for the nucleus and the southern compact component indicate more recent or ongoing star formation activity.
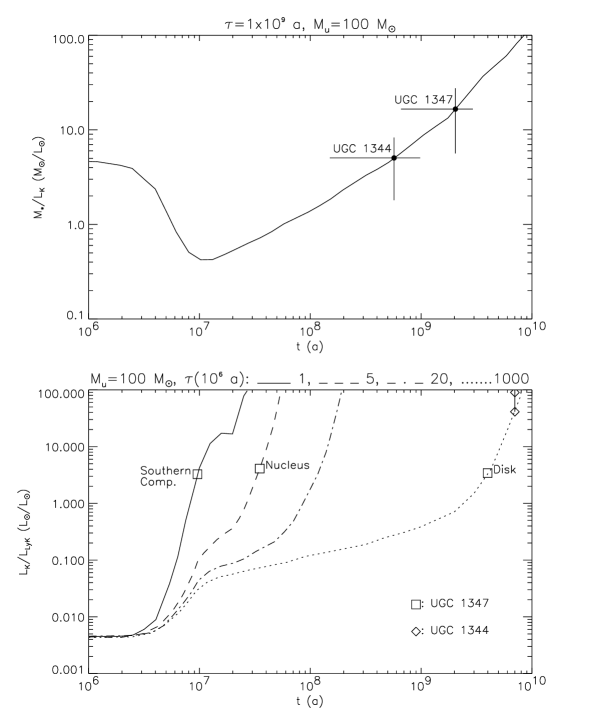
Disk: The / ratio of 22 to 43 that we obtained for the overall galaxy indicates an age of the stellar population in the disk of the order of several 109 to 1010 years (see Fig. 10).
This is also supported by the ratios
= 6.4
and
= 3.2
combined with
10
that results from the upper limit on the extended radio flux.
Nucleus:
The diagnostic ratios
= 53,
= 2.3
combined with
10 = 0.27
indicate that the nuclear light is currently
dominated by a decaying star formation event
that happened a few times 107 years ago. This assumes that the
upper mass cutoff is 100 and that the star burst itself
did not last longer than a few times 106 years (see Fig. 10).
The initial star formation rate was 18 yr-1 and the
current star formation rate would then be of the order of 0.04 yr-1.
The southern component: The southern component and the nucleus belong to the brightest regions in H line emission. The only diagnostic ratio that we can calculate is that between the K-band luminosity corrected for the contribution of hot dust and the Lyman continuum luminosity. We obtain a value of = 4. In addition the compact source of hot dust revealed by our AO measurements and its location at the tip of the bar suggest that the star formation activity in that region may be as high and recent as we find it for the nucleus (see Fig. 10).
UGC 1344: A ratio of = 2.2 to 3.3 indicates an age of 109 years (see Fig. 10). This is supported by the lower limit . The fact that the far-infrared luminosity is lower than that of UGC 1347 may imply that the molecular gas mass is below 108 . In addition the the system is deficient in neutral hydrogen as well. This indicates that UGC 1344 is deficient overall in fuel for star formation. The fact that UGC 1344 shows only a weak and narrow HI line may indicate that the HI has largely been stripped and the HI line width cannot necessarily be taken as a measure for the total dynamical mass. If the dynamical mass has been underestimated by a factor of 10 the log() ratio will be similar to the one obtained for UGC 1347 and the age of the dominant stellar population in the disk is then most likely also of the order of several 109 to 1010 years.
4.3 Nuclear star formation and bulge sizes in the sample
The detailed discussion of the data available for UGC 1344 and UGC 1347 has shown that there is strong evidence for nuclear star formation activity and that not all of the K-band nuclear flux density can be explained by the presence of an old stellar population alone. Additional K-band flux density may originate from hot dust (see Fig. 5) or a population of supergiants or AGB stars, both of which are indicative for recent or ongoing star formation activity. The spatial distribution of the sources responsible for additional K-band flux density may be looked upon as independent of the distribution of the old stellar population forming the bulge of the galaxies. The relative flux density contribution of the additional sources will then have an influence on the measured size of the bulge.
That star formation activity is an important quantity for the appearance and classification of a galaxy has also been pointed out by Kennicutt et al. (Kennicutt (1994)). They have combined H and UBV measurements of 210 nearby Sa-Irr galaxies with new photometric synthesis models to reanalyze past and future star formation timescales in the disks. The authors find that the pronounced change in the photometric properties of spiral galaxies along the Hubble sequence is predominantly due to changes in the star formation histories of disks, and only secondarily to changes in the bulge/disk ratio.
It is well known that there is a strong morphological segregation in clusters of galaxies, with most of the ellipticals in the center of the cluster while the spirals are more dispersed. Also early-type spirals seem more concentrated than late-types. Although Abell 262 is an extremly spiral rich cluster this segregation will most likely also effect the bulge to disk ratio as a function of location in the cluster. It is, however, not self-evident that this effect has any influence on the measured bulge sizes. In the following we will address this problem.
Our finding can be discussed in the framework of recent investigations of the bulge-to-disk luminosity ratio. In a sample of 3114 galaxies Solanes et al. (Solanes (1989)) analyzed the luminosity of bulge and disk components of disk galaxies and their possible correlations with morphological type and local density. Independently of the local environment no evidence is found for any bulge segregation among disk galaxies. Instead they find that disks appear to be less luminous with increasing local density. They find that the absolute brightness difference (bulge)(total) corresponds to about 3 for Sc galaxies, 2 for Sb and 1 for Sa and S0 galaxies. A similar trend is also observed in the dependency of the near-infrared concentration index (defined in Gavazzi et al. Gavazzi1990 (1990)) on the absolute H-band magnitude in a sample of 297 galaxies investigated by Gavazzi et al. (Gavazzi1996b (1996)). In this sample the bulge-to-disk ratio systematically increases with decreasing H-band luminosity. The morphological segregation reported by Solanes et al. (Solanes (1989)) is (if at all) only weakly indicated.
Both quantities, (bulge)(total) and , are concentration parameters that simply describe the bulge versus disk brightness. In a scenario in which bulge components of identical brightness are located in the centers of disks of varying brightness the FWHM of the NIR light, measured with respect to the combined peak of the disk and bulge component will result in smaller values for lower disk luminosities. Therefore the observed disk luminosity antisegregation could in principle be responsible for our observed tendency that the FWHM of galaxies within the Abell radii of the Abell 262 and Abell 1367 clusters are smaller than those outside the Abell radii.
However, it is also possible that a luminosity antisegregation as observed for the disks is also present for the bulges, but is just compensated for by the additional contribution to the bulge luminosity due to enhanced star formation triggered by the effects of a higher cluster density environment.
Theoretical studies (Moore et al. Moore (1996), Fujita Fujita (1998)) show that the velocity perturbation induced by a single high-speed encounter is in most cases too small to affect the star formation rate of a disk galaxy. However, several successive high-speed encounters between galaxies (galaxy harassment) may lead to gas inflow and strong star formation activity (Fujita Fujita (1998)). This picture is consistent with the cluster crossing and star formation time scales. From the sample of 84 Abell 262 cluster members listed in Giovanelli & Haynes (Giovanelli1985 (1985)) we derive a velocity dispersion of 750 km s-1. The Abell radius of 1.75∘ then indicates that several 109 years are required to cross a significant fraction of the central part of the cluster. However, the time scale for formation of supergiants plus their life time amounts to only several 107 years. This indicates that in gas rich spiral galaxies star formation can easily be triggered via galaxy-galaxy interactions while passing through the central part of the cluster.
4.4 Star formation in the high redshift clusters
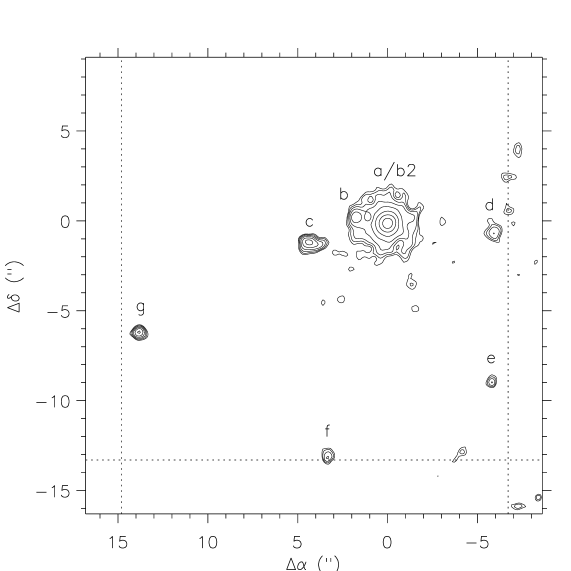
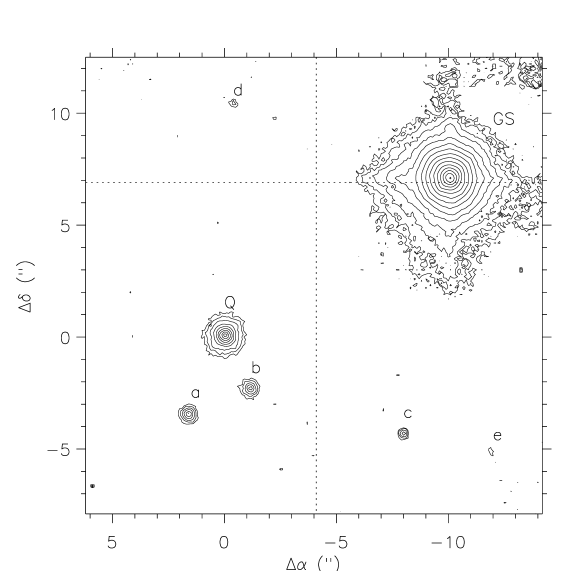
In Fig. 11 we show a K′-band image of the J1836.3CR field and in Fig. 12 a K′-band image of the PKS 0743-006 field.
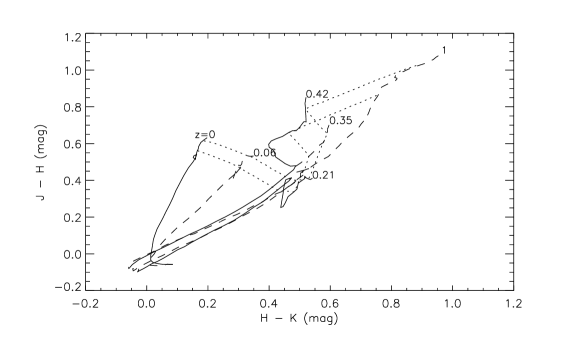
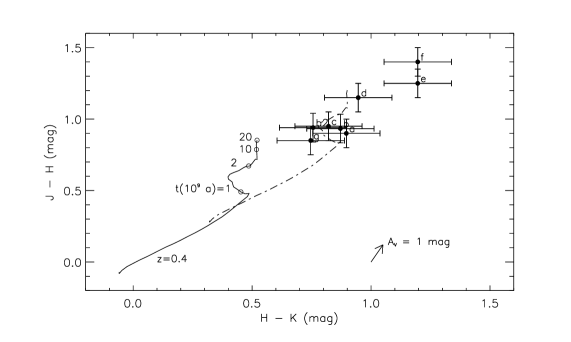
Model values for the JHK flux densities were calculated using the GISSEL stellar population models (Bruzual & Charlot Bruzual (1993)), and compared with the measurements for each field and appropriate redshift. For better comparison we only show the tracks in Fig. 13, and then superimpose the observed data in Fig. 14 and Fig. 15.
All the models have been calculated for a passively evolving population after a 1 Gyr starburst. The Padova initial spectral energy distribution is used with a Salpeter IMF. Continued star formation, renewed star formation or initial mass functions truncated at their high mass end all tend to move galaxies towards the starts of the tracks. Since the SHARP II+ data were taken in the K′ filter we transformed the K′ magnitudes to K band values using the following relation: (Wainscoat and Cowie Wainscoat (1992)). For the color correction we used the mean observed H K colors of those objects which we could identify as being extragalactic and close to the redshift of the corresponding cluster. For the PKS 0743-006 cluster these mean colors are H K and for the J1836.3CR cluster we find H K . In Tab. 9 and Tab. 10 we give the magnitudes and flux densities and JHK colors for the objects in our field of view towards both clusters.
In all cases the flux densities were derived from sky-subtracted images, taking into account possible contaminations by neighboring sources. The mean apertures for J1836.3CR and PKS 0743 were 3.95′′(K′), 3.80′′(H), 3.62′′(J), and 4.13′′(K′), 3.60′′(H), 3.33′′(J), respectively.
J1836.3CR: In Fig. 14 we show the colors of all sources in our field of view towards the J1836.3CR cluster at . All galaxies are located at the tip of the evolutionary track for a passively evolving galaxy at that redshift. This is consistent with an age of 10 Gyrs (or more) and some intrinsic reddening with a mean value of the order of = 2–3 mag.
| source | ident. | |||||
|---|---|---|---|---|---|---|
| a | G | 17.10 | 16.20 | 15.30 | 0.90 | 0.90 |
| b | G | 20.23 | 19.30 | 18.43 | 0.93 | 0.87 |
| b2 | G | 19.59 | 18.64 | 17.89 | 0.94 | 0.77 |
| c | G | 19.02 | 18.08 | 17.25 | 0.95 | 0.82 |
| d | G | 20.85 | 19.70 | 18.75 | 1.15 | 0.95 |
| e | G | 20.35 | 19.10 | 17.90 | 1.25 | 1.20 |
| f | G | 20.20 | 18.80 | 17.60 | 1.40 | 1.20 |
| g | G | 19.10 | 18.25 | 17.50 | 0.85 | 0.75 |
| source | ident. | J | H | K | J H | H K |
|---|---|---|---|---|---|---|
| GS | guide star | 11.05 | 10.95 | 10.90 | 0.05 | 0.05 |
| Q | quasar | 15.80 | 15.50 | 14.90 | 0.30 | 0.60 |
| a | G | 17.60 | 17.10 | 16.60 | 0.50 | 0.50 |
| b | G | 17.70 | 17.40 | 16.80 | 0.40 | 0.50 |
| c | star | 18.00 | 17.80 | 16.60 | 0.70 | 0.10 |
| d | G | 20.50 | 20.30 | 19.80 | 0.20 | 0.50 |
| e | star | 20.30 | 20.10 | 19.40 | 0.70 | 0.30 |
Source is the brightest galaxy in our field of view of the J1836.3CR cluster. For this source our data allow us for the first time to obtain reliable color information close to the diffraction limit of the 3.6 m telescope. For this purpose the three 0.10′′ pixel scale maps were first deconvolved with the PSF and then reconvolved with a Gaussian clean beam to be at the same resolution. The final resolution of the H and K maps is 0.2′′ and that of the J map is 0.3′′. From the flux density calibrated maps we therefore calculated a J H color map at a resolution of 0.3′′ and a HK color map at a resolution of 0.2′′. As a result over a 1.9′′ diameter aperture centered on source the colors turned out to be fairly uniform with mean colors corresponding to the values given in Tab. 9 and color variations of 0.15. The nucleus of source which can be clearly distinguished in the individual images at the three wavelengths does not appear particularly red or blue. This indicates that there are little variations in extinction or in spectral type across the source.
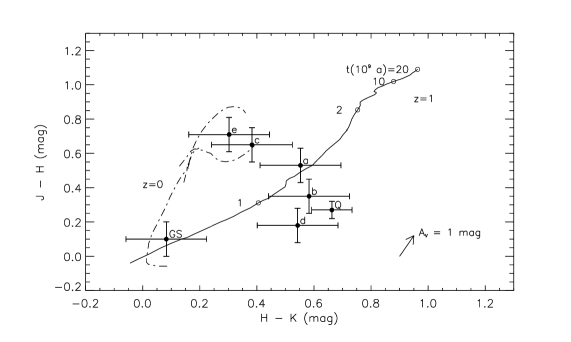
PKS 0743-006: In Fig. 15 we show the colors of all sources in our field of view towards the quasar PKS 0743-006 at . Compared to the cluster J1836.3CR this field is more sparsely populated. Clearly not all of the objects have colors corresponding to high-redshift galaxies. Two of the objects () are at a location in the JHK color-color diagram that is populated by local giant or dwarf stars. For comparison – and as a convenient check of our calibration – we have also added the position of the bright reference star on which the adaptive optics loop was locked. This star is of type A0, in agreement with the measured colors. All other objects are located close to the middle of the evolutionary track for a passively evolving galaxy at a redshift of . This is consistent with an age closer to 2 Gyrs than 10 Gyrs. The age may even be lower under the assumption of intrinsic reddening. This would indicate that the light of these objects is dominated by a reasonably young, blue stellar population.
Although the identification of these objects as galaxies has to be confirmed spectroscopically, an alternative explanation for the nature of these object is difficult to find. Even taking the uncertainties of the measured colors into account these sources are positioned well to the lower right of the mean colors of spiral galaxies or those of local dwarfs and giant stars. The only other objects that are located in this area of the JHK-color diagram are local HII regions, if their near-infrared emission is un-reddened and dominated by free-free radiation. Having 3 of these objects in the same field as the quasar (with similar colors) is very unlikely.
The best information on the sizes of the sources in this field is from the data taken with a 0.05′′/pixel sampling. While the quasar itself is unresolved as compared to radial and tangential cuts with respect to the direction of the AO reference, we find one of the brighter sources () that is close to the quasar as clearly extended in all directions. This source has an angular separation to the quasar of only 3.8′′. Deconvolving its measured size with the size of the unresolved quasar by subtracting the values in quadrature its deconvolved source size is at a position angle of about 45∘. At a redshift of this corresponds to a linear size of 1.9 kpc 1.4 kpc. The extent of the source, its small angular separation from the quasar, and its colors make this object the best candidate for a cluster galaxy which is associated with the quasar PKS 0743-006. The previously described blue colors with respect to the values expected for a passively evolving galaxy at a redshift of then imply that we look at a galaxy with a region of enhanced star formation that extends over an area of 2.7 kpc2.
4.5 Bulge sizes and structures in J1836.3CR
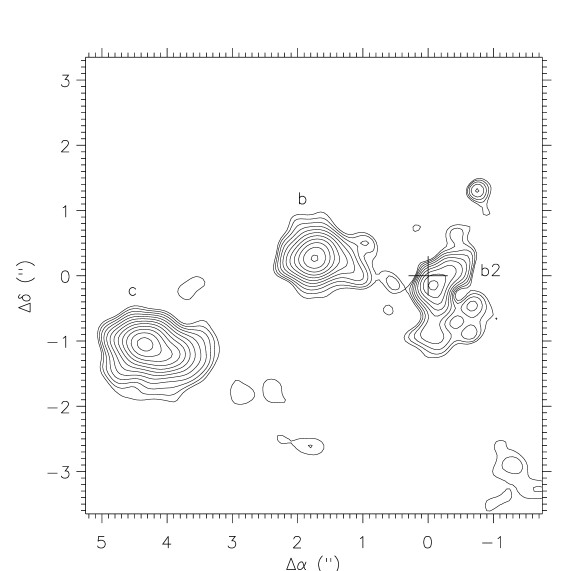
Our best K-band AO images of J1836.3CR can be used to derive structural information on individual cluster members. We determined radial profiles in the direct and deconvolved images. The radial profiles of the deconvolved images have the advantage that they have been corrected for the non-diffraction limited part of the PSF and allow a much clearer view on the detailed distribution of light in each object. In Fig. 16 we show the profiles of 8 sources in the field including a profile of the guide star after the same number of Lucy deconvolution iterations ().

To determine the profile of source we first subtracted a radially averaged image of source as determined from its non-contaminated section to the north. This process revealed a further, even weaker source (see Fig. 17). Both sources and were subtracted from the image before calculating the average radial profile of .
Following Kormendy (Kormendy (1977)) the radial profiles were fitted via a reduced test as a combination of a spheroid (De Vaucouleurs De Vaucouleurs (1959)) with a surface brightness
| (5) |
and an exponential intensity fall-off with a sharp inner cutoff radius (Kormendy Kormendy (1977)). with a surface brightness
| (6) |
Here and are the corresponding cutoff radii, is the exponential scale length and and are the central surface brightnesses for the spheroid and the exponential disk (if it had not been cut-off) in units of magnitudes per square arcseconds. The surface brightness and intensity distribution are linked via . None of the sources, with the exception of , can be fit via an law alone. The distributions at small radii are too flat with respect to their decrease at larger radii; they can only at larger radii be approximated with a De Vaucouleurs law. This indicates that these objects are not typical elliptical galaxies which are usually found amongst the brightest cluster members (Thuan and Romanishin Thuan (1981)). All sources – except object – are best fit with exponential profiles suggesting that they are more similar to spiral disks. However, no central bulge could be detected with an upper size limit of 0.6–0.9 kpc. This could be due to the fact that the angular resolution of 0.15′′ is still not sufficient to clearly discriminate between the bulge and disk components. Alternatively it could imply that the bulges are intrinsically weak with respect to the disks. The statistical investigation of bulge to disk intensity ratios by Solanes et al. (Solanes (1989)) would then suggest that the galaxies in the center of J1836.3CR are of type Sa and S0 and that the center of this cluster represents a dense environment.
Source shows a radial profile of a typical cD galaxy that is expected to be present in the centers of rich galaxy clusters. The cD galaxies in centers of clusters with low richness can usually be described as giant ellipticals (Morgan et al. Morgan (1975), Albert et al. Albert (1977)). However, cD galaxies in rich clusters show excess flux density in their profiles at large radii with respect to an law (Oemler Oemler (1997), Dressler Dressler (1979)). This is also the case for source . The profile can only be fit by a De Vaucouleurs law for radii . The resulting scale length (see Tab. 11) is in agreement with the lower limit of the range of scale lengths of laws found for the central regions of bright cD galaxies in rich Abell clusters (Oemler Oemler (1997)). The extended flux at larger radii of the central cD galaxy in J1836.3CR may be indicative of either tidal disturbances due to galaxy-galaxy interactions of cluster members in which the debris is sinking onto the central massive galaxy (Gallagher & Ostriker Gallagher (1972)) or even the result of recent merger processes (Ostriker & Tremaine Ostriker (1975)). These activities are not likely to be important in clusters of low richness (Thuan and Romanishin Thuan (1981)) but can very well be responsible for the structures of objects in rich clusters.
| source | |||
|---|---|---|---|
| (kpc) | (kpc) | (mag/arcsec2) | |
| a | 3.22 | 0.19 | 15.77 |
| b2 | 2.15 | 0.19 | 17.02 |
| b | 2.31 | 0.19 | 16.94 |
| c | 2.49 | 0.19 | 16.49 |
| d | 1.37 | 0.12 | 17.89 |
| e | 2.12 | – | 17.35 |
| f | 2.30 | – | 17.47 |
| g | 2.08 | 0.20 | 16.43 |
4.6 Luminosity of the cluster members
In order to check how representative the individual galaxies that we studied are we compared their luminosities to those of galaxies at the corresponding redshifts of the three clusters at , , and . From a subsample of the optically selected Anglo-Australian Redshift-Survey, Mobasher et al. (Mobasher (1993)) find the best infrared Schechter luminosity function parameters as with for km s-1 Mpc-1 and . From their sample they also find that E/S0 and spirals have identical infrared luminosity functions within the errors. Their parameters are very much in agreement with recent determinations of by De Propris et al. (De Propris (1998)) and Gardner et al. (Gardner (1997)). For and = 0.5 they find with bright galaxy slopes of and 0.1 with 0.1, respectively. For the purpose of comparison we use the same values for and and obtain the following results for our targets:
Abell 262: For our low redshift cluster both objects we study here – UGC 1344 and UGC 1347 – are galaxies to within less than 0.5 magnitudes.
J1836.3CR: For this cluster we find that the bright source is just 0.6 magnitude brighter and that the other sources are about 1 to 2 magnitudes fainter than a typical galaxy at that redshift of .
PKS 0743-006: For the 3 presumed galaxies close to the quasar PKS 0743-006 at we find that two are about 0.7 magnitudes brighter than an galaxy and the weakest one is 2 magnitudes fainter than . This is consistent with the statement that the brighter members of the observed clusters are on the K- relation which, as emphasized by Lilly (Lilly (1988)), shows only a small scatter of mag at redshifts below . In addition it should be mentioned that the quasar PKS 0743-006 itself shows very similar colors compared to the galaxy candidates in the observed field. However, due to the nuclear contribution it is – as expected (see data in Dunlop et al. Dunlop (1993) and Lehnert et al. Lehnert (1992)) – between 1.5 and 2 mag brighter than what is predicted by the galaxy K- relation. We also find that the measured JHK fluxes of this variable quasar were at the time we took the data about 0.7 to 1.0 magnitudes below what is given in the literature (White et al. White (1988), Lépine et al. Lepine (1985)). Since quasar host galaxies have been found to be often as bright as (McLeod & Rieke McLeod1995 (1995), Sánchez et al. Sanchez (1997)) the underlying host galaxy may contribute substantially to the overall flux density of the quasar in this low state.
This indicates that the source properties that we determined in the previous sections are representative for typical cluster members at the corresponding redshifts.
5 Summary and Conclusions
We have presented high angular resolution NIR observations of three galaxy clusters at different redshifts using adaptive optics. In the case of the barred spiral UGC 1347 in Abell 262 we presented the first adaptive optics data using the laser guide star provided by the ALFA system.
The diagnostic ratios for the nucleus of UCG 1347 indicate recent and ongoing star formation activity. In addition to the resolved NIR nucleus in UGC 1347 we found a bright and compact region of recent and enhanced star formation at one tip of the bar. The ratio as well as the V K color of that region imply that a starburst happened about 107 years ago. For UGC 1344 we found that the overall star formation activity is low and that the system is deficient in the fuel for star formation.
The comparison of seeing-corrected nuclear bulge sizes of a sample of 26 cluster galaxies within and outside of the Abell radius of Abell 262 and Abell 1367 indicates that the galaxies in the inner part of the cluster show a tendency for more compact bulges than those outside. This phenomenon can tentatively be ascribed to an increased star formation activity due to interactions of cluster members inside the Abell radius. Such an increase of central activity is also indicated at other wavelengths. Scodeggio and Gavazzi (Scodeggio (1993)) find in a 21 cm survey of spiral galaxies in clusters that about 30% of them show extended radio continuum emission and that a substantial fraction of those (but not all) show indications of interaction. Moss and Whittle (Moss1993 (1993)) find from an H survey of cluster spirals that interacting spirals show a strong tendency to have compact nuclear H emission which the authors conclude to be most likely due to tidally induced star formation from galaxy-galaxy interactions, since interactions are more likely to happen close to the cluster center. Several successive high-speed encounters between galaxies may lead to gas inflow and strong star formation activity (Fujita Fujita (1998)). This would imply that dynamically induced star formation is more important in the center than the outer parts of a cluster, although current investigations have not yet convincingly shown the obvious presence of such an correlation. Future observations of larger samples of cluster members are clearly needed to substantiate these correlations.
Since the spiral content of galaxy clusters at higher redshifts is about as large as the spiral content in the field at (Oemler et al. Oemler (1997)), detailed observations of galaxies in low-redshift spiral-rich clusters may provide essential information of the cluster evolution at higher redshifts in general. In particular it would allow us to study in detail the influence of galaxy harassment. Abell 262 and Abell 1367 are spiral-rich clusters. With a ratio of spirals to S0 and E0 galaxies of 47%/53% and 43%/57%, respectively, their spiral content is similar to that in the field at of 55%/45% and to that in clusters at a redshift of of 40%/60% (Oemler Oemler (1997)).
UGC 1347 and UGC 1344 could very well be taken as examples of the blue and red fraction of clusters at higher redshift. Couch et al. (Couch (1998)) reports on 3 galaxy clusters at measured with the HST. In these clusters he finds the fraction of spirals at least 3 times higher than at which would approximately correspond to the spiral fraction of Abell 262 and Abell 1367. About 20% of all galaxies show signs of interaction. The blue fraction of the cluster population shows morphologies similar to Sb-Sdm/Irr galaxies with compact knotty regions of star formation. These knots may be very similar to the bright star formation region we found for UGC 1347. The red fraction of the cluster population they find is 1-2 Gyr past the last major star formation event and has morphological similarities to S0-Sb disks. This may be very similar to UGC 1344 and source in J1836.3CR.
However, the radial profile of source in J1836.3CR shows indications for recent or ongoing interactions between cluster members. Here the enhanced flux above the De Vaucouleurs fit to the data at larger radii identifies source as the central cD galaxy in a rich cluster environment in which interactions between cluster members are probably still of importance for their further evolution.
From an investigation of NIR colors Hutchings & Neff (Hutchings (1997)) find for 5 quasars at redshifts ranging from to 0.3 that they are located in mostly evolved groups of galaxies with an indication for average extinction values of = 2–3 mag quite similar to J1836.3CR at discussed in this paper. However, on the basis of large-scale investigations (Butcher & Oemler, Butcher (1984), Ellis Ellis (1997)) as well as studies of individual galaxy clusters (e.g. Morris et al. Morris (1998)) one finds that both in clusters and in the field the blue fraction of galaxies generally increases towards higher redshifts (the Butcher Oemler effect, BOE). This is consistent with our finding of relatively blue NIR colors in the galaxy candidates associated with PKS 0743-006 at .
Based on an investigation of Abell 2390 at and a comparison to the cluster MS 1621.5+2640 at Abraham et al. (Abraham (1996)) and Morris et al. (Morris (1998)) suggest that the star formation process is shut down by a combination of gas stripping followed by gas exhaustion via star formation. This truncation of star formation activity may explain both the BOE and the large fraction of S0 galaxies in clusters. This also suggests that truncated star formation induced by infall does not play a major role in driving cluster galaxy evolution at lower redshifts although this mechanism may have played a role in earlier history. The barred structure of UGC 1347 as well as the strong recent star formation event at one tip of the bar may indicate that this object is well suited to study the corresponding physical processes of cluster galaxy evolution in great detail.
Acknowledgements.
We are grateful to the Calar Alto and La Silla staff for their excellent support and hospitality. We thank M. Lehnert, H.W. Rix, R. Genzel, L. Tacconi and T. Boller for helpful discussions. We are particularly grateful to P. Amram and M. Marcelin who kindly provided the H continuum and line images to us. We furthermore thank the referee for very helpful and constructive suggestions.References
- (1) Abraham, R. G., Smecker-Hane, T.A., Hutchings, J.B., et al., 1996, ApJ 471, 694
- (2) Albert, C., White, R., Morgan, W.W., 1977, ApJ 211, 309
- (3) Amram, P., Marcelin, M., Balkowski, C., Cayatte, V., et al., 1994, A&AS 103, 5
- (4) Arsenault, R., Salmon, D.A., Kerr, J. M., et al., 1994. In: Adaptive Optics in Astronomy, Ealey, M.A., Merkle, F. (eds.), Proc. SPIE 2201, 833
- (5) Beuzit, J.-L., Hubin, N., Gendron, E., et al., 1994. In: Adaptive Optics in Astronomy, Ealey, M.A., Merkle, F. (eds.), Proc. SPIE 2201, 955
- (6) Bravo-Alfaro, H., Szomoru, A., Cayatte, V., et al., 1997, A&AS 126, 537
- (7) Bruzual, A.G., Charlot, S., 1993, ApJ 405, 538
- (8) Butcher, H., Oemler, A., 1984, ApJ 285, 426
- (9) Condon, J.J., Cotton, W.D., Greisen, E.W., et al., 1996, NCSA Astronomy Digital Image Library
- (10) Condon, J.J., 1992, ARA&A 30, 575
- (11) Couch, W.J., Berger, A.J., Smail, I., et al., 1998, ApJ 497, 188
- (12) Davies, R.I., Hackenberg, W., Ott, T., et al., 1999, A&AS 138, 345
- (13) Davies, R.I., Hackenberg, W., Ott, T., et al., 1998. In: Adaptive Optics System Technologies, Bonaccini, D., Tyson, R.K. (eds.), Proc. SPIE 3353, 116
- (14) Doyon, R., Joseph, R.D., Wright, G.S., 1994, ApJ 421, 101
- (15) Dressler, A., 1979, ApJ 231, 659
- (16) Dunlop, J.S., Taylor, G.L., Hughes, D.H., Robson, E.I., 1993 MNRAS 264, 455
- (17) Eckart , A., Cameron, M., Boller, Th., Krabbe, et al., 1996, ApJ 472, 588-599
- (18) Eckart, A., Cameron, M., Rothermel, et al., 1990, ApJ 363, 451
- (19) Eisenhauer F., Quirrenbach A., Zinnecker, H., Genzel, R., 1998, ApJ 498, 278
- (20) Ellis, R., 1997, ARA&A 35, 389
- (21) De Propris, R., Eisenhardt, P.R., Stanford, S.A., Dickinson, M., 1998, ApJ 503, L48
- (22) de Vaucouleurs, G., 1959, Handbuch der Physik 53, 311
- (23) De Vries, H.W., Heithausen, A., Thaddeus, P., 1987, ApJ 319, 723
- (24) Draine, B.T., 1989. In: Infrared Spectroscopy in Astronomy, Kaldeich, B.H. (ed.), Proc. of ESA, ESA-SP 290
- (25) Drummond, J.D., Fugate, R.Q., Christou, J.C., Hege, K., 1998, Icarus 132, 80
- (26) Fairclough, J.H., 1985. In: Extragalactic Infrared Astronomy, Gondhalekhar, P.M. (ed.), Rutherford Appelton Laboratory Workshop, RAL-85-086
- (27) Fanti, C., Mantovani, F., Tomasi, P., 1981, A&AS 43, 1
- (28) Frogel, J.A., Persson, S.E., Aaronson, M., Matthews, K., 1978,ApJ 220, 75
- (29) Fujita, Y., 1998, ApJ 509, 587
- (30) Gardner, J.P., Sharples, R.M., Frenk, C.S., Carrasco, B.E., 1997, ApJ 480, L99
- (31) Gallagher, J.S., Ostriker, J.P., 1972, AJ 77, 288
- (32) Gavazzi, G., Boselli, A., 1996, Astrophys. Letters & Communcations 35, 1
- (33) Gavazzi, G., Piierini, D., Baffa, et al., 1996, A&AS 120, 521
- (34) Gavazzi, G., Trinchieri, G., Boselli, A., 1990, A&AS 86, 109
- (35) Gehrz, R.D., Sramek, R.A., Weedman, D.W., 1983, ApJ 267, 551
- (36) Genzel, R., Weitzel, L., Tacconi-Garman, et al., 1995, ApJ 444, 129
- (37) Giovanelli, R., Haynes, M.P., 1985, AJ 90, 2445
- (38) Giovanelli, R., Haynes, M.P., Chincarini, G.L., 1982, ApJ 262, 442
- (39) Glindemann A., Hamilton, D., Hippler, S., et al., 1997. In: Proc. of the ESO Workshop on Laser Technology for Laser Guide Star Adaptive Optics Astronomy, N. Hubin (ed.), 120
- (40) Gregory, P.C., Thompson, L.A., Tifft, W.G., 1981, ApJ 243, 411
- (41) Heckman, T.M., Balick, B. Sullivan III, W.T. 1978, ApJ 224, 745
- (42) Helou, G., 1986, ApJ 311, L33
- (43) Hewitt, A., Burbidge, G., 1993, ApJS87451
- (44) Hildebrand, R.H., 1983, Roy. Astron. Soc. Quart. J. 24, 267
- (45) Hippler, S., Glindemann, A., Kasper, M., Kalas, P., et al., 1998. In: Adaptive Optical System Technologies, Bonaccini, D., Tyson, R.D. (eds.), Proc. SPIE 3353, 44
- (46) Hofmann, R., Blietz, M., Duhoux, P., et al., 1992. In: Progress in Telescope and Instrumentation Technologies, Ulrich, M.H. (ed.), ESO Conference and Workshop Proceedings No.42, 617
- (47) Hubin, N., 1997. In: Optical Telescopes of Today and Tomorrow, Ardeberg, A.L. (ed.), Proc. SPIE 2871, 827
- (48) Hutchings, J.B., Neff, S.G. , 1997, ApJ 113, 550
- (49) Jackson, J.M., Eckart, A., Cameron, M., et al., 1991, ApJ 375, 105
- (50) Kennicutt, R.C., Tamblyn, P., Congdon, C.E., 1994, ApJ 435, 22
- (51) Kormendy, J., 1977, ApJ 217, 406
- (52) Krabbe, A., Sternberg, A., Genzel, R., 1994, ApJ 425, 72
- (53) Larson, R. B., Tinsley, B. M., 1978, ApJ 219, 46
- (54) Leitherer, C., 1996. In: ASP conf. series vol. 98, 373
- (55) Lehnert, M.D., Heckmann, T.M., Chambers, K.C., Miley, G.K., 1992, ApJ 393, 68
- (56) Lépine, J.R.D., Braz, M.A., Epchtein, N., 1985, A&A 149, 351
- (57) Lilly, S.J., 1988, ApJ 340, 77
- (58) Lonsdale, C.H., Helou, G., Good, J.C., Rice, W., 1985, Cataloged Galaxies and Quasars Observed in the IRAS Survey, NASA-JPL, Pasadena
- (59) Lucy, L.B., 1974, AJ 79, 745
- (60) Mas-Hesse, J.M., Kunth, D., 1991, A&AS 88, 399
- (61) Max, C.E., Olivier, S.S., Friedman, et al., 1997, Sci 277, 1649
- (62) McLeod, K.K., Rieke, G.H., 1995, ApJ 454, L77
- (63) Melnick, J., Sargent, W.L.W., 1977, ApJ 215, 401
- (64) Meynet, G., Maeder, A., Schaller, et al., 1994, A&AS 103, 97
- (65) Mobasher, B., Sharples, R.M., Ellis, R.S., 1993, MNRAS 263, 560
- (66) Moore, B., Katz, N., Lake, G., et al., 1996, Nat 379, 613
- (67) Morgan, W.W., Kayser, S., White, R., 1975, ApJ 199, 545
- (68) Morris, S.L., Hutchings, J.B., Carlberg, R.G., et al., 1998, ApJ 507, 84
- (69) Moss, C., Whittle, M., 1993, ApJ 407, L17
- (70) Moss, C., Dickens, R.J., 1977, MNRAS 178,701
- (71) Oemler, Dressler, Butcher, 1997, ApJ 474, 561
- (72) Oly, C., Israel, F.P., 1993, A&AS 100, 263
- (73) Osterbrock, D.E., 1989, Astrophysics of Gaseous Nebulae and Active Nuclei, University Science Books, Mill Valley
- (74) Ostriker, J.P., Tremaine, S.D., 1975, ApJ 202, L113
- (75) Quirrenbach, A., Hackenberg, W., Holstenberg, H.C., Wilnhammer, N., 1997. In: Adaptive Optics and Applications, Tyson, R.K., Fugate, R. (eds.), Proc. SPIE 3126, 35
- (76) Rieke, G. H., Loken, K., Rieke, M. J., Tamblyn, P., 1993, ApJ 412, 99
- (77) Rieke, G. H., Lebofsky, M. J., Thompson, R. I., et al., 1980, ApJ 238, 24
- (78) Salpeter, E. E., 1955, ApJ 121, 161
- (79) Sánchez, S.F., Conzález-Serrano, J.I., Carballo, et al., 1997. In: Proceedings of the ESO/IAC Workshop on Quasar Hosts, Clements, D.L., Pérez-Fournon, I. (eds.), 21
- (80) Schaerer, D., Maynet, G., Maeder, A., Schaller, G., 1993, A&A 274, 1012
- (81) Schinnerer, E., Eckart, A., Quirrenbach, et al., 1997, ApJ 488, 174
- (82) Scodeggio, M., Gavazzi, G., 1993, ApJ 409, 110
- (83) Shostak, G.S. 1978, A&A 68, 321
- (84) Solanes J.M., Salvador-Sole, E., Sanroma, M., 1989, AJ 98, 798
- (85) Stanghellini, C., O’Dea, C.P., Baum, et al., 1997, ApJ 325, 943
- (86) Tacconi-Garman, L.E., Sternberg, A., Eckart, A., 1996, AJ 112, 918
- (87) Tammann, G.A., Loeffler, W., Schroeder, A., 1994, ApJS92487
- (88) Thuan, T.X., Romanishin, W., 1981, ApJ 248, 439
- (89) Tornikoski, M., Valtaoja, E., Terasranta, H., et al., 1993, AJ 105, 1680
- (90) Wainscoat, R.J., Cowie, L.L., 1992, AJ 103, 332
- (91) Wilkerson, M.S., 1980, ApJ 240, 115
- (92) White, G.L., Jauncey, D.L., Savage, A., et al., 1988, ApJ 327, 561
- (93) Whittet, D.C., 1981, Quarterly J. Roy. Astron. Soc. 22, 3
- (94) Wunderlich, E., Klein, U., 1988, A&A 206, 47
- (95) Young, J.S., Scoville, N., 1991, ARA&A 29, 581