The likely detection of pulsed high-energy -ray emission from millisecond pulsar PSR J02184232
Abstract
We report circumstantial evidence for the first detection of pulsed high-energy -ray emission from a millisecond pulsar, PSR J02184232, using data collected with the Energetic Gamma Ray Experiment (EGRET) on board the Compton Gamma Ray Observatory (CGRO). The EGRET source 3EG J0222+4253 is shown to be spatially consistent with PSR J02184232 for the energy range 100 - 300 MeV. Above 1 GeV the nearby BL Lac 3C 66A is the evident counterpart, and between 300 MeV and 1 GeV both sources contribute to the -ray excess. Folding the 100-1000 MeV photons with an accurate radio ephemeris of PSR J02184232 yields a double peaked pulse profile with a modulation significance and with a peak separation of similar to the 0.1-10 keV pulse profile. A comparison in absolute phase with the 610 MHz radio profile shows alignment of the -ray pulses with two of three radio pulses. The luminosity of the pulsed emission (0.1-1 GeV) amounts which is % of the pulsar’s total spin-down luminosity. The similarity of the X-ray and -ray pulse profile shapes of PSR J02184232 , and the apparent alignment of the -ray pulses with two radio pulses at 610 MHz, bears resemblance to the well-known picture for the Crab pulsar. This similarity, and the fact that PSR J02184232 is one of three millisecond pulsars (the others are PSR B1821-24 and PSR B1937+21) which exhibit very hard, highly non-thermal, high-luminosity X-ray emission in narrow pulses led us to discuss these millisecond pulsars as a class, noting that each of these has a magnetic field strength near the light cylinder comparable to that for the Crab. None of the current models for -ray emission from radio pulsars can explain the -ray spectrum and luminosity of PSR J02184232 .
Key Words.:
pulsars: individual: PSR J0218+4232 – Stars: neutron – BL Lacertae objects: individual: 3C 66A – Gamma rays: observations – X-rays: stars1 Introduction
Pulsed high-energy emission from millisecond (ms) pulsars has so far been detected at X-ray energies below 10 keV for only five pulsars: PSR J0437-4715 (Becker & Trümper (1993)), PSR J2124-3358 (Becker & Trümper (1999)), PSR B1821-24 (Saito et al. (1997)), PSR J0218+4232 (Kuiper et al. (1998)) and PSR B1937+21 (Takahashi et al. (1999)). The first two exhibit broad X-ray pulses, have soft spectra and relatively low luminosities in the X-ray window, about 3 orders of magnitude lower than derived for the latter three ( assuming emission in a 1 sr beam). In addition to the higher luminosity, these have very narrow X-ray pulses (intrinsically or narrower) and hard power-law shape spectra measured up to 10 keV (Saito et al. (1997), Mineo et al. (2000), Takahashi et al. (1999), respectively), the two hardest spectra having indices as hard as -0.65. This short observational summary suggests that this small sample can de devided in two distinct classes of ms pulsars: Class I, ms pulsars with soft, low-luminosity X-ray emission in broad pulses; Class II, with highly non-thermal, high-luminosity X-ray emission in narrow pulses.
Millisecond pulsars not only differ from normal radio pulsars in that their spin periods are 1 to 2 orders of magnitude shorter, reducing correspondingly their light cylinder radii, but particularly their surface magnetic field strengths are 3 to 4 orders of magnitude weaker. Nevertheless, Bhattacharya & Srinivasan (1991) and Sturner & Dermer (1994) showed that both of the competing classes of models for the production of -rays (polar cap and outer gap models) predict the production of detectable non-thermal emission up to the high-energy -rays for a sizable number of ms pulsars. An early systematic search for pulsed high-energy -ray emission from ms pulsars rendered, however, only upper limits (Fierro (1995)). In this paper we will present circumstantial evidence for the first detection of pulsed high-energy gamma-ray emission from a Class II ms pulsar: PSR J0218+4232.
PSR J02184232 is a 2.3 ms pulsar in a two day orbit around a low mass ( 0.2 M⊙) white dwarf companion (Navarro et al. (1995); van Kerkwijk (1997)). The dipolar perpendicular magnetic field strength () at the surface of the neutron star is estimated to be G and the spin-down age is years. The spin-down energy loss of the pulsar amounts erg s-1. The pulsar distance inferred from its dispersion measure and from the electron density model of Taylor & Cordes (1993) is kpc.
Soft X-ray emission from the pulsar was first detected by Verbunt et al. (1996) in a 20 ks ROSAT HRI observation. In a 100 ks follow-up observation X-ray pulsations were discovered at a significance of about 5 (Kuiper et al. (1998)). The X-ray pulse profile is characterized by a sharp main pulse with an indication for a second peak at a phase separation of . The pulsed fraction inferred from the ROSAT HRI (0.1-2.4 keV) data is %. It is interesting to note that also in the radio domain the source exhibits an unusually high unpulsed component of 50 % (Navarro et al. (1995)).
The ROSAT HRI provides no spectral information and the number of counts recorded in a far off–axis PSPC observation does not allow spectral modeling in the soft X-ray regime (0.1-2.4 keV). Also ASCA detected this source, however, the observation was too short: no pulsation could be detected, and a spectral fit to the weak total excess resulted in a power–law photon index of (Kawai & Saito 1999).
The spectral information for PSR J02184232 improved enormously analyzing the data from a 83 ks BeppoSAX MECS (1.6-10 keV) observation performed early 1999 (Mineo et al. (2000)). Pulsed emission was detected up to 10 keV, the pulse profile clearly showing two peaks at the same phase separation of 0.47 which we reported earlier combining ROSAT HRI and PSPC observations (Kuiper et al. (1998)). The BeppoSAX MECS observation reveals that PSR J02184232 exhibits the hardest pulsar X-ray spectra measured so far: Between 1.6 and 10 keV one peak has a spectrum consistent with a power-law photon index of and the other with an index of . The total pulsed spectrum can be described with an index (Mineo et al. (2000)).
At high-energy -rays, Verbunt et al. (1996) noticed the positional coincidence of PSR J02184232 with the second EGRET catalog source 2EG J02204228 (Thompson et al. (1995)), which was identified in the catalog and other publications with the BL Lac 3C 66A (Dingus et al. (1996); Mukherjee et al. (1997); Lamb & Macomb (1997)). Using some additional EGRET observations, and applying a combination of spatial and timing analyses, Kuiper et al. (1999a) conclude that 2EG J02204228 is probably multiple: between 100 and 1000 MeV PSR J02184232 is the most likely counterpart, and above 1000 MeV 3C 66A is the best candidate counterpart. The third EGRET catalog (Hartman et al. (1999)), which is based on more viewing periods than the 2EG catalog, also identifies 3EG J02224253 (2EG J02204228) with 3C 66A, rather than with the ms-pulsar. However, in a note on this source, they indicate that the identification with 3C 66A stems from the catalog position based on the 1 GeV map. Furthermore, they confirm that for lower energies (100-300 MeV) the EGRET map is consistent with all the source flux coming from the pulsar, 3C 66A being statistically excluded.
In this paper we present the results of spatial, timing and pulse-phase resolved spatial analyses using all available EGRET (30 MeV - 30 GeV) data collected between November 1991 and November 1998 in 5 observations with PSR J02184232 within 25 of the pointing axis. Analysis of radio monitoring data of this pulsar provided us with an ephemeris valid over the total period of 7 years covering the EGRET observations, allowing phase folding of all selected EGRET events in a single trial. The resulting high-energy -ray pulse profile is compared with pulse profiles detected at X-ray energies up to 10 keV, and in absolute phase with the radio profile at 610 MHz. The results are finaly discussed in relation to the Class II ms pulsars and the Crab, as well as with recent theoretical predictions for the production of X-ray and -ray emission in the magnetospheres of ms pulsars.
| VP # | Start Date | End Date | Pointing direction | Off-axis angle | Eff.Exposure | Sparkchamber efficiency | |
| TJD† | TJD | l () | b () | () | (100-300 MeV; ) | (100-150 MeV) / (1-2 GeV) | |
| 15.0 | 8588.535 | 8602.696 | 152.75 | -13.40 | 13.4 | 0.962 / 0.981 | |
| 211.0 | 9043.646 | 9055.631 | 125.86 | -4.70 | 18.5 | 0.870 / 0.935 | |
| 325.0 | 9468.592 | 9482.625 | 147.08 | -9.06 | 11.2 | 0.820 / 0.909 | |
| 427.0 | 9951.603 | 9967.581 | 153.71 | -9.95 | 15.7 | 0.269 / 0.632 | |
| ♠728.7/9 | 11078.646 | 11120.603 | 139.36 | -18.70 | 1.2 | 0.180 / 0.250 | |
| † TJD = JD - 2440000.5 = MJD - 40000 | |||||||
| ♠ EGRET in narrow field mode; opening angle FoV is | |||||||
2 Instrument description and observations
EGRET (the Energetic Gamma Ray Experiment Telescope) aboard the Compton Gamma Ray Observatory (CGRO) has a (gas-filled) sparkchamber and is sensitive to gamma-rays with energies in the range 30 MeV to 30 GeV. In the mode used for most of the observations the field of view is approximately in diameter, although the instrument point-spread function (PSF) and the effective area degrade considerably beyond off-axis. Its effective area is approximately between 200 and 1000 MeV, falling off at lower and higher energies. The angular resolution is strongly energy dependent: the confinement angle at 35 MeV, 500 MeV and 3 GeV are , and respectively. The energy resolution is (FWHM) over the central part of the energy range. Each registered event is time tagged by the on-board clock, serving also the other 3 CGRO instruments BATSE, OSSE and COMPTEL. The on-board time is converted to Coordinated Universal Time (UTC) with an absolute accuracy better than , and a relative accuracy of . For a continued proper sparkchamber performance regular gas replenishments of the sparkchamber are required in order to restore the efficiency after the gas has aged. The sparkchamber efficiency is therefore a function of time and energy. For a detailed overview of the EGRET detection principle and instrument characteristics, see Thompson et al. (1993). The inflight calibration and performance are presented in detail by Esposito et al. (1999). In this work we selected those CGRO Cycle I-VII Viewing Periods (VP) in which PSR J02184232 , located at (l,b) = (139.508,17.527), was less than off-axis. In Table 1 the details of each selected VP are given.
COMPTEL, the imaging Compton Telescope aboard CGRO, is co-aligned with EGRET and had PSR J02184232 in its field of view during the same VP’s as EGRET. COMPTEL operates in the 0.75-30 MeV energy window and has an energy resolution of about 5-10 % FWHM, a large field of view ( steradian) and a location accuracy of (see Schönfelder et al. (1993)). Events are time-tagged with a ms resolution. A timing analysis of PSR J0218+4232 in the COMPTEL energy window did not yield a significant timing signal and subsequent imaging studies of the sky region containing PSR J02184232 did not show a source detection at the pulsar position. Therefore, only the flux upper limits are presented in this paper (see Sect. 8).
OSSE, the Oriented Scintillation Spectrometer Experiment aboard CGRO, is a non-imaging detector system consisting of 4 independent actively shielded NaI(Tl)-Cs(Na) phoswich detectors operating in the 0.05 to 10 MeV energy range, each having a (FWHM) field of view (see Johnson et al. (1993)). PSR J0218+4232 was the primary target of OSSE during VP 728.7 and VP 728.9 and was observed in event-by-event mode in the 50-150 keV energy band with a timing accuracy of 0.125 ms. Like in the case for COMPTEL, also OSSE did not detect a timing signature. Flux upper limits are given in Sect. 8.
3 Spatial analysis
Events arriving from within off axis when EGRET is in full FoV mode and in narrow field mode, are sorted in a 3 dimensional data cube with galactic longitude, latitude and energy as axes. The longitude and latitude bin widths are , and 10 narrow “standard” energy ranges are selected: 30-50, 50-70, 70-100, 100-150, 150-300, 300-500, 500-1000 MeV, 1-2, 2-4 and 4-10 GeV.
Because the Earth atmosphere is the largest source of non-celestial -rays the events are subjected to an energy dependent zenith angle cut. We used the “standard” values for the 10 selected energy windows. The corresponding energy dependent exposure maps are calculated using the “exposure history” files taking into account the instrument calibration characteristics, the instantaneous timeline, the operation mode of the instrument and the time dependent spark chamber sensitivity factors (see Esposito et al. (1999) and Table 1).
To be consistent with the selection criteria used in the generation of the exposure matrices we demand that the energy deposit in the TASC (Total Absorption Shower Counter) measured by at least one of its PHA’s is above a threshold of MeV.
The imaging method employed here is based on our Maximum Likelihood Ratio (MLR) program, part of the COMPTEL analysis software package COMPASS (de Vries (1994)). In this program point sources are searched for on top of a diffuse background model which describes the galactic and extra-galactic -ray emission separately. The galactic component originating in cosmic-ray interactions with the protons of the atomic and molecular Hydrogen gas, as well as inverse Compton interactions of cosmic-ray electrons with the ambient photon field, is described by a combination of 2 different models: one results from the convolution of the EGRET PSF with the spatial distribution of the atomic Hydrogen column density and the second from the convolution with the spatial distribution of CO used as tracer for the molecular Hydrogen gas in the galaxy. The extra-galactic component is assumed to be isotropic.
The image resulting from the Maximum Likelihood Ratio program is based on likelihood ratio tests at user defined grid points in a skyfield containing the object of interest. At each grid point () we determine the Maximum Likelihood under two hypotheses: 1) a description of the data in terms of the diffuse background models only () and 2) a description in terms of the diffuse background models and a point source at the () position (). Under the hypothesis the number of counts () expected in a measured sky pixel is given by :
| (1) |
where and represent the convolved diffuse galactic and extra- galactic models.
Because our mosaic of observations is composed of viewing periods with pointing directions concentrated in a narrow band at low galactic latitudes (see Table 1) the scale factors are poorly constrained in the optimization process due to the dominating galactic components. So, we keep them fixed at values derived from a study of the extra-galactic -ray emission using a much larger database containing all EGRET Cycle I,II and III observations (Sreekumar et al. (1998)).
By optimizing the Likelihood under with respect to its free scale parameters, we can derived the flux and flux uncertainty from and its error for a putative source at position (). From optimizations under and we can determine the Likelihood ratio defined as . This quantity is distributed as a for 1 degree of freedom for a known source position and yields the source detection significance.

The MLR map for energies MeV (Fig. 1) confirms the detection of the EGRET source 2EG J0220+4228 / 3EG J0222+4253 (Thompson et al. 1995; Hartman et al. 1999) at a significance level for 1 degree of freedom, i.e. the source position is known. The and hypotheses include also the contributions from well-established -ray sources (Hartman et al. (1999)) within a radius around our target in order to describe the -ray sky near our target optimally. The binned event matrix for this integral energy window is a combination of the matrices for the differential energy windows above 100 MeV, each with a different Earth zenith cut angle. The MeV exposure matrix is in this case a power-law weighted composition (index 2.1) of the differential exposure matrices. This forms a consistent event/exposure set with respect to the applied selection criteria.
We compared the derived optimum scale factors for the Galactic diffuse emission components with the findings from more detailed studies on this diffuse emission (Strong & Mattox (1996), Hunter et al. (1997)) and found that our values are in all cases consistent with the published results.
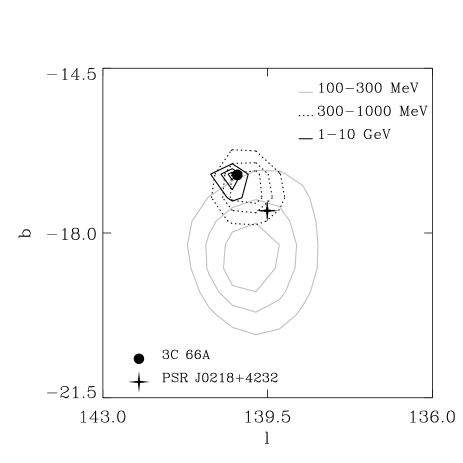
It is evident from Fig. 1 that the high-energy -ray source is positionally consistent with both PSR J0218+4232 and 3C 66A (located at (l,b) = (140.143,16.767)). The total excess contains counts. We analyzed this excess also in the differential energy windows: 100-300 MeV, 300-1000 MeV and 1-10 GeV. In each window the source was seen: 100-300 MeV detection significance and counts, 300-1000 MeV and counts and finally 1-10 GeV and counts. The location confidence contours for the excesses in the 3 broad energy windows are shown in Fig. 2. This figure shows that 3C 66A is the evident counterpart for the 1-10 GeV window (consistent with the third EGRET catalogue results (Hartman et al. (1999)), whereas PSR J0218+4232 is the most likely counterpart for the 100-300 MeV window. Between 300 and 1000 MeV both sources contribute to the excess.
For energies below 100 MeV we see indications for an excess, but the EGRET sensitivity is becoming too low and the spatial response too wide to draw firm conclusions. We estimated a flux upper limit for the spectrum of PSR J02184232 (see Sect. 8).

4 Long-term time variability
Earlier studies of -ray emission from spin-down powered pulsars showed that they are steady -ray emitters (see e.g. the review by Thompson et al. (1997)). On the contrary, most Active Galactic Nuclei appeared to be highly variable at -ray energies (see e.g. Mukherjee et al. (1997)). Therefore, we investigated whether there is (absence of) evidence for time varability of 2EG J0220+4228 / 3EG J0222+4253, particularly for the 100-300 MeV and 1-10 GeV bands, in which PSR J0218+4232 and 3C 66A appear to be the most likely counterparts, respectively.
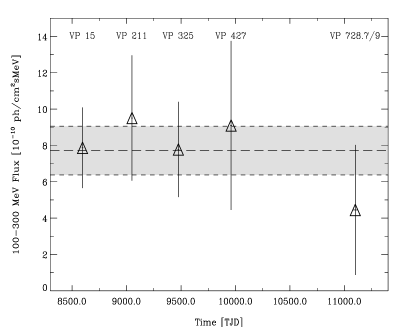
Using integration intervals of typically 2 or 3 weeks, the results are shown in Fig. 3. The 100-300 MeV flux measurements are fully consistent with being constant, as expected for -ray emission from spin-down powered pulsars. The 1-10 GeV flux points show indications for variability and deviate at a level (93%) from being constant. According to the variability criteria defined by McLaughlin et al. (1996) the 1-10 GeV variability index of 1.33 points to a variable nature of the 1-10 GeV emission. This type of variability is indeed reminiscent of the behaviour observed frequently for the -ray emission from AGN. The above supports the conclusion from the spatial analysis, namely, that 2EG J0220+4228 / 3EG J0222+4253 is multiple: above 1 GeV the BL Lac 3C 66A is the obvious counterpart, whereas below 300 MeV PSR J0218+4232 is the most likely counterpart.
5 Timing analysis
In the timing analysis similar event selections have been applied as in the spatial analysis, except we ignored the specific TASC (Thompson et al. (1993)) flags of the event triggers in the event selection process. Especially the selection on the TASC zero cross overflow bit (set to 1 if less than 6.5 MeV is deposited in the TASC), which is only effective for the lower energy -ray photons ( MeV), is not taken into account. We verified this selection by a timing analysis of the Crab pulsar (combining many Cycle 0 VI VP’s) which showed that ignoring the TASC flags gives a significant improvement of the timing signal, particularly for energies below 100 MeV, with respect to the case in which we demand a TASC energy deposit of at least 6.5 MeV measured by one of its 2 PHA’s.
An additional difference in the selection procedure with the spatial analysis, where the spatial information of all events is used, is that we now have to specify an event extraction radius around the pulsar position. Contrary to what is commonly used in the timing analysis of EGRET data, namely, selecting events within an energy dependent extraction radius of containing approximately of the counts from a point-source, with the measured -ray energy, we optimized in each narrow energy window (e.g. 100-150 MeV) the signal-to-noise ratio as a function of extraction radius taking into account the modelled (2d) spatial distribution of the optimized diffuse models and neighbouring sources as obtained in the spatial analysis (see e.g. the thesis of Fierro (1995) p.49-50). This method provides the optimal extraction radius for a given energy window and a given sky-background structure. The values obtained from this study for the narrow energy windows between 100 and 1000 MeV are listed in Table 2.
| Energy | Extraction | Enclosed |
|---|---|---|
| window (MeV) | radius () | source fraction |
| 100- 150 | 3.5 | 0.53 |
| 150- 300 | 2.6 | 0.56 |
| 300- 500 | 1.8 | 0.56 |
| 500-1000 | 1.2 | 0.56 |
| Parameter | Value† |
|---|---|
| Right Ascension (J2000) | 02h 18m 6350 |
| Declination (J2000) | 42∘ 1744 |
| Epoch validity start/end (MJD) | 49092 – 50900 |
| Frequency | 430.4610674213 Hz |
| Frequency derivative | Hz s-1 |
| Epoch of the period (MJD) | 49996.000000023 |
| Orbital period | 175292.3020 s |
| a sin i | 1.98444 (lt-s) |
| Eccentricity | 0 |
| Longitude of periastron | 0 |
| Time of ascending node (MJD) | 49996.637640 |
| † The last significant digit is given | |

From our timing observations of PSR J0218+4232 at radio wavelengths we obtained one single accurate ephemeris (rms error ), which is listed in Table 3. The validity interval of this ephemeris covers almost 5 years and in view of the stable rotation behaviour observed for millisecond pulsars its validity should extend far beyond the indicated range.
Phase folding the barycentered arrival times, taking into account the binary nature of the system, of the selected events with measured energies between 100-1000 MeV from all observations listed in Table 1 yields a modulation significance applying a test (Buccheri et al. (1983)) on the unbinned sample of pulse phases. An H-test (de Jager et al. (1989)) in which the internal optimization of the number of harmonics is taken into account in the significance estimate yields a modulation significance at an optimum number of harmonics of 4. The 100-1000 MeV pulse profile is shown with 10 bins in Fig. 4 with superposed its Kernel Density Estimator (KDE; de Jager et al. (1986)) with the uncertainty interval. This KDE approaches the genuine underlying pulse profile (convolved with the instrumental time resolution) for an infinite number of events. The pulse profile shows one prominent narrow emission feature between phases and following a broad less prominent pulse with maximum at phase . The phase separation of is remarkably similar to the value of observed at soft/medium energy X-rays by the ROSAT HRI (Kuiper et al. (1998)) and BeppoSAX MECS (Mineo et al. (2000); detailed comparisons will be presented below).
We also produced phase distributions in broader differential energy intervals. The pulse profiles for 100-300 MeV and 300-1000 MeV both showed consistently the same narrow and broad pulses ( probabilities and , respectively). For 30-100 MeV and 1-10 GeV no hints for pulsation were found.
6 Pulse phase resolved spatial analysis
The pulse profile shown in Fig. 4 reaches a significance of , indicating that the probability is low, only , that this deviation from a flat distribution is caused by a random fluctuation. Given the importance of the discovery of high-energy -ray emission from a millisecond pulsar, we investigated further whether there is additional support in our data to claim this detection. As explained above, for the timing analysis the events were selected within an extraction radius around the position of PSR J0218+4232 using only of the events of a point source. In order to verify whether the source events outside the extraction radius () exhibit the same timing signature, we produced a pulse profile using all source events by performing a pulse phase resolved spatial analysis for energies between 100 and 1000 MeV.
The procedure is the following: Construct a pulse profile by repeating the spatial analysis for events selected in different pulse phase intervals. Contrary to the phase folding we need to select the events in relatively broad phase intervals to have sufficient statistics to do the spatial analysis: We selected 10 phase bins of width 0.1.
In order to estimate first the contribution of 3C 66A, which is obviously independent of the pulsar phase, to the total high-energy -ray excess in the 100-1000 MeV energy band we have fitted this excess for the full [0,1] phase range in terms of point-sources at the positions of PSR J0218+4232 and 3C 66A. This yielded the following decomposition: the number of counts assigned to PSR J0218+4232 and 3C 66A are and , respectively. The insignificant 3C 66A contribution, coming from events with energies MeV, is nevertheless taken into account as a small correction in the pulse phase resolved spatial analysis (4.2 counts are assigned to 3C 66A for each 0.1 wide phase bin). Fitting then the measured 100-1000 MeV spatial event matrices for each pulse phase slice in terms of a PSR J0218+4232 model with a free scale factor atop the galactic diffuse models (both with free scale factors), the (fixed) isotropic extragalactic component and all (fixed) nearby-source models including 3C 66A, we obtain the total number of counts correlating with a point-source at the PSR J0218+4232 position for each phase slice.

The resulting 10 bin pulse profile is shown in Fig. 5. The total number of source counts in this light curve is 153 (the background level 0). Comparing Fig. 5 with the profile obtained from the timing analysis (Fig. 4), it is evident that the shape is statistically identical. For the phase folding we had selected only of the events for a real source (cf Table 2). Scaling from the number of 153 source counts measured in Fig. 5, to be consistent, the number of pulsar excess counts in Fig. 4 should be , i.e. the backgound level should be at . It is evident from this comparison that the two profiles are fully consistent in shape as well as in number of counts in the timing signature. Thus, the pulsed signal is also present outside the dataspace confined by the used extraction radius, as expected for a real signal, i.e. the timing and spatial signatures are consistent with the detection of PSR J0218+4232.

A more well-known display of the same conclusion are “ON”-“OFF” maps, or “pulsed”-“unpulsed” maps. Guided by the shape of the 100-1000 MeV pulse profile in a 20 bin representation (see Fig. 7e) we tentatively defined a “pulsed” phase interval as the combination of the phase ranges 0.05-0.40 and 0.55-0.70 and an “unpulsed” interval as its complement. We then produced MLR maps selecting the events now also on their phase location in either of the 2 pulse phase windows for the 100-300, 300-1000 and 100-1000 MeV energy ranges. The results are shown in Fig. 6. It is evident that the 100-300 MeV signal is confined within the “pulsed” interval, strengthening the conclusion that PSR J0218+4232 is the counterpart of 2EG J02204228 for energies between 100 and 300 MeV. In the 300-1000 MeV “unpulsed” MLR map residual emission is visible which can be explained by emission from 3C 66A and pulsed emission from PSR J0218+4232 emitted outside the defined “pulsed” interval (e.g. possible contribution from a weak pulse near phase 0.9 in Figs. 4 or 5). The overall picture for energies below 1000 MeV points to a very dominant PSR J0218+4232 and a minor 3C 66A contribution.
7 Multi-wavelengths profile comparisons
7.1 Comparison with radio profiles
The ephemeris of PSR J0218+4232 given in Table 3, and used for our -ray analysis, has been determined using Jodrell Bank observations at 610 MHz. The corresponding radio profile is shown in Fig. 7a (see also Stairs et al. 1999). It is remarkable that the pulsar is practically never “off”; three pulses seem to cover the entire phase range from 0 to 1.

Because the fiducial point in the 610 MHz radio profile defining the anchor point in the template used in the fitting process of the time of arrival of the radio pulses is known, its geocentric arrival time specified by the “Epoch of the period” in Table 3 can be translated to solar system barycentric arrival time. This timestamp is subsequently converted to a phase zero taking into account the binary nature of the system. This phase zero value, corresponding to the fiducial point, is finally subtracted from the -event phases, obtained by the same folding procedure, to align these with the radio profile. Thus, we can compare the 100-1000 MeV pulse profile in absolute phase with the 610 MHz radio profile. The aligned -ray pulse profile is shown in Fig. 7e, now in 20 bins to allow a more detailed comparison. The bin width of is comparable to the CGRO absolute timing accuracy of better than . Also shown is the same KDE profile as shown in the 10 bin pulse profile in Fig. 4, to aid the comparison of the two -ray histograms, given the low counting statistics. In order to guide the eye, the pulsar phases of the three maxima in the 610 MHz radio profile are indicated by vertical lines.
In Fig. 7b is also indicated the 1410 MHz radio profile (Kramer et al. (2000)) which has been aligned by cross-correlation with the 610 MHz profile (phase uncertainty in alignment). It is clear from this figure that the 2 emission features in the -ray pulse profile coincide within the absolute timing uncertainties with 2 of the 3 pulses in the 610 MHz radio profile. Comparing the 610 and 1410 MHz radio profiles it is notable that one of these “radio/-ray” pulses (at phase 0.62) coincides with a dip in the 1410 MHz profile, followed and preceded by smaller pulses. Also between the two main emission features a shoulder is visible in the 1410 MHz profile which is absent in the 610 MHz one.
7.2 Comparison with X-ray profiles
We reported earlier significant detections of pulsed X-ray emission from PSR J0218+4232 analysing ROSAT HRI data ( modulation significance in the 0.1-2.4 keV energy range; Kuiper et al. (1998)) and BeppoSAX MECS data (, 1.6-10 keV energies; Mineo et al. (2000)). In the BeppoSAX MECS analysis we used the same ephemeris of Table 3 as in the present work. In the ROSAT HRI analysis, however, we used for the phase folding the extrapolated timing parameters from Navarro (1995). Given the availability of the new ephemeris which is valid over a nearly 5 year period and covers the ROSAT HRI observation, we decided for consistency reasons to reanalyze the 100 ks ROSAT HRI data. In addition, application of improved maximum likelihood algorithms in the spatial analysis to determine the centroid of emission in the X-ray map allowed for a better determination of the optimal extraction radius (). The result is shown in Fig. 7c. The modulation significance has increased to ( test), particularly the prominence of the second weaker pulse near phase 0.6 has improved in comparison with the result shown in Kuiper et al. (1998).
The new ROSAT HRI profile can be compared with the BeppoSAX MECS profile (Fig. 7d; Mineo et al. (2000)), which just overlaps in energy window. The alignment of the profiles was done by cross correlation, like in Mineo et al. (2000), since the uncertainties in the ROSAT and BeppoSAX absolute timing are too large to allow an absolute comparison. The identical peak separations of and the consistent difference in the spectra of the two peaks (Mineo et al. (2000)), make us confident that the alignment is accurate.
The next step is the alignment of the X-ray profiles with the absolute timing of the -ray and radio profiles. We cross correlated the most significant X-ray profile (from BeppoSAX MECS) with the EGRET profile, and applied the phase shift which corresponds to the highest probability in the correlation analysis to the aligned ROSAT HRI and BeppoSAX MECS profiles. These aligned profiles are shown in Fig. 7. in which the BeppoSAX MECS and EGRET profiles are both displayed in 20 bins. It is obvious that all three high-energy profiles exhibit two pulses with the same phase separation of about . Fine structure in the gamma-ray profile, like the local maximum at phase , is not significant, even though the strong radio pulse at phase makes that phase “special”.

8 Multi-wavelength spectrum
The X-ray spectrum of the pulsed emission from PSR J0218+4232 between 1.6 and 10 keV is the hardest measured so far for any (millisecond) radio pulsar. The best power-law fit to the BeppoSAX MECS pulsed spectrum has an index . The spectrum becomes somewhat softer (index ) when a 27% DC component is included (Mineo et al. (2000)). This DC component is visible in the ROSAT data (Kuiper et al. (1998)) and in the BeppoSAX data up to 4 keV. Above 4 keV there is no sign of a DC component.
In the EGRET -ray data above 100 MeV, the signal seen from PSR J0218+4232 is also consistent with being 100% pulsed. However, the detailed structure of the pulse profile is not clear, i.e., is there a phase interval in which the -ray signal is clearly off, or how wide are the wings of the pulses? Possibly, the pulsed -ray signal extends over the total phase range with only one or two very narrow dips, just like in the radio profile. Therefore, it is difficult to determine a background region in the -ray pulse profile for the construction of a pulsed spectrum. We decided to determine the -ray spectrum using again the spatial maximum likelihood analysis, estimating the number of source counts (and then flux) on top of the diffuse background models and all relevant nearby sources, for the following energy intervals: 30-100 MeV, 100-300 MeV, 300-1000 MeV, 1-10 GeV. The resulting flux values and upper limits are given in Table 4 for PSR J02184232 and the simultaneously derived values for 3C 66A in Table 5 (power-law photon index ). Table 4 also lists the upper limits derived for the simultaneous COMPTEL observations and the OSSE observation during VP 728.7/9 (see Table 1). The COMPTEL -upper limits are derived in a spatial analysis analoguous to the EGRET approach. The OSSE - upper limits are estimated from the statistically flat phase histograms according to the description presented in Ulmer et al. (1991) assuming a duty cycle of 0.5.
| Energy Range | Instrument | Flux / upper limit | |
|---|---|---|---|
| [MeV] | [ph / cm2 s MeV] | ||
| 0.050 | 0.073 | OSSE | |
| 0.073 | 0.103 | OSSE | |
| 0.103 | 0.151 | OSSE | |
| 0.050 | 0.151 | OSSE | |
| 0.75 | 3 | COMPTEL | |
| 3 | 10 | COMPTEL | |
| 10 | 30 | COMPTEL | |
| 30 | 100 | EGRET | |
| 100 | 300 | EGRET | |
| 300 | 1000 | EGRET | |
| 1000 | 10000 | EGRET | |
| Energy Range | Flux / upper limit | |
|---|---|---|
| [MeV] | [ph / cm2 s MeV] | |
| 300 | 1000 | |
| 1000 | 10000 | |
In Fig. 8 we have collected all available data for a total spectrum from radio up to high-energy -rays in the format , showing the observed power per logarithmic energy interval. The very high luminosity at -ray energies between 100 MeV and 1 GeV is striking and a large fraction of the total spin-down luminosity will be emitted in high-energy -rays. This fraction can be estimated as follows:
with the -ray beam size, the distance to the pulsar and the moment of inertia of the neutron star. Assuming , and we obtain an efficiency of for PSR J0218+4232. Over the 100-1000 MeV range the -ray spectrum is soft and consistent with a photon power-law index of . The extrapolation of the very hard spectrum between 0.1 and 10 keV is just in agreement with the OSSE upper limit(s). Fig. 8 suggests that the maximum luminosity is reached in the COMPTEL MeV range just below the COMPTEL upper limits.
9 Summary and discussion
In this study we performed detailed spatial and timing analyses on PSR J02184232 using the high-energy -ray data from CGRO EGRET and found that we have good circumstantial evidence for the first detection of pulsed high-energy -rays from a Class II ms-pulsar, PSR J02184232 , namely:
-
-1-
The spatial distribution is consistent with the pulsar being detected: Between 100 and 300 MeV the EGRET source position is consistent with that of PSR J02184232 with the total signal concentrated in 2 pulses. The 100-300 MeV flux does not show time variability at a 2/3 weeks time scale, indicative for a steady -ray emitter like spin-down powered pulsars. Above 1 GeV the nearby (angular separation ) BL Lac, 3C 66A, is the evident counterpart for the -ray excess. For energies between 300 MeV and 1 GeV the pulsar and the BL Lac contribute to the excess.
-
-2-
Timing analysis (phase folding, using the timing parameters measured at radio wavelengths) in the 100-1000 MeV energy interval, selecting roughly of the source photons, yields a double-peaked pulse profile with a modulation significance. The same pulsed signature is also present in the data outside the extraction radius used in the timing analysis, containing the remaining of the source photons.
-
-3-
The phase separation of of the two -ray pulses is similar to that measured between the two pulses at X-rays; a comparison in absolute time with the 610 MHz radio-profile shows alignment of the -ray pulses with two of the three radio pulses.
EGRET detected six pulsars with overwhelming statistical significance (Crab, Vela, Geminga, PSR B1706-44, PSR B1951+32 and PSR B1055-52; see e.g. the review by Thompson et al. 1997). Compared to these six, the modulation significance of PSR J02184232 falls only in the 3–4 range, similar to the significance of the weak timing signals found with EGRET from PSR B0656+14 (Ramanamurthy et al. (1996)) and PSR B1046-58 (Kaspi et al. (2000)). The additional circumstantial evidence for the detection of PSR J02184232 , particularly the similarity of the double-peaked X-ray and -ray pulse profile shapes, and the fact that the X-ray spectrum measured for PSR J02184232 below 10 keV is the hardest measured for any pulsar (Mineo et al. 2000) increases the likelihood of the detection. Nevertheless, confirmation of the detections of PSR B0656+14, PSR B1046-58 and PSR J02184232 by future high-energy -ray missions like the Italian AGILE and NASA’s GLAST is important.
The nearby 3C 66A obviously complicated the analyses, but its contribution to the -ray excess in the skymaps has consistently been taken into account. The events detected from this BL Lac have no systematic effect on the double-peaked timing signature assigned to PSR J02184232 in the timing analysis. However, our results show that earlier publications on the spectrum of 3C 66A (e.g. Dingus et al. (1996); Mukherjee et al. (1997); Lin et al. (1999)) should be revised, the time averaged spectrum is significantly harder than published earlier.
In Kuiper et al. (1998) and Mineo et al. (2000) the similarity of the double-peaked X-ray pulse profile of PSR J02184232 with that of the Crab pulsar was noted and discussed. It is now striking that the observed 100-1000 MeV pulse profile of PSR J02184232 shows one narrow () pulse preceded in phase by a broader pulse, again a morphology very similar to that of the Crab pulsar -ray profile. The latter exhibits two distinct pulses at phase separation at X-ray and -ray energies, with the X-ray and -ray pulses being aligned in absolute phase. Unfortunately, we cannot align the X-ray and -ray profiles of PSR J02184232 in absolute phase, but the similar phase separation suggests that the pulses are also aligned (see Fig. 7).
We noted in the Introduction that the surface magnetic field strengths of ms pulsars are 3 to 4 orders of magnitude weaker than that of normal radio pulsars. This makes the boundary condition for the production of -rays near the neutron star surface for ms pulsars much less favourable than for normal radio pulsars. It is, however, remarkable that the Crab pulsar and the members of the Class II ms pulsars have in common that the magnetic field strengths near the light cylinders are comparable (in the range Gauß). In fact, ranking all known radio pulsars by , the three Class II ms pulsars rank number 1, 3 and 6, and Crab ranks number 2 (see also the discussion in Saito et al. (1997); Kuiper et al. (1998) and Takahashi et al. (1999)).
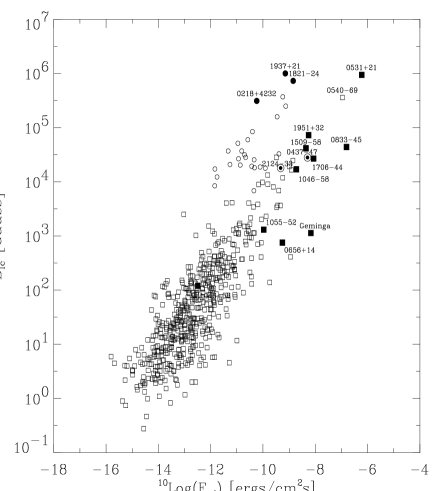
This is illustrated in Fig. 9, showing a scatter plot for all radio pulsars of versus the spin-down flux, , with the total rotational energy loss rate and the distance. The three Class II ms pulsars are clearly located at the extreme of the distribution. The two Class I ms pulsars possess significantly lower, more average values for ms pulsars. Also indicated are the 8 normal pulsars detected by EGRET in high-energy gamma-rays, as well as PSR B1509-58, detected by COMPTEL up to about 30 MeV (Kuiper et al. 1999b ). As has been noted in earlier papers, is a good indicator for the probability to detect hard X-ray and high-energy gamma-ray emission from normal radio pulsars. The only normal pulsar near the top of the distribution, not seen by EGRET is PSR B0540-69. This LMC pulsar is detected, however, at X-rays up to keV (Ulmer et al. (1999)). In order for ms pulsars to be seen with a hard X-ray spectrum (Class II), or even at high-energy gamma-rays (PSR J0218+4232) a high value for seems to be required, in addition to a high . This suggests that is a key parameter for models explaining the production of high-energy emission in the magnetospheres of ms pulsars.
Given in addition the similarities with the Crab of the high-energy pulse profiles (X-rays and also -rays for PSR J02184232 ) this suggests that the pulsed high-energy non-thermal emission from the Class II ms pulsars and the Crab pulsar have a similar origin in the pulsar magnetosphere, quite likely in a vacuum gap near the light cylinder. We know from radio observations, however, that the Crab has an orthogonal alignment, while PSR J02184232 is a nearly aligned rotator (Navarro et al. 1995, Stairs et al. 1999). Unfortunately, a parameter which is also important in this discussion on the geometry, the impact angle, has only been determined with large uncertainties, and therefore the line-of-sight information for PSR J02184232 is unconstrained (Stairs et al. 1999).
If indeed, X-ray emission and -ray emission from Class II ms pulsars has to be produced in a vacuum gap near the light cylinder, the vacuum gap has to be very short in order to have narrow and aligned pulses at X-rays and -rays, given the very strong curvature of the magnetic field lines in ms-pulsar magnetospheres. In addition, the potential drop has to be very high over this short length to accelerate the particles to the energies required for high-energy gamma-ray production. It is obvious that continuous acceleration of particles and production of X-rays and -rays from the surface of the neutron star along the curved magnetic field lines till the light cylinder radius (for PSR J02184232 only 111 km) will not render the narrow and aligned pulses at X-rays and -rays.
The Crab pulsar has also its two X-ray and -ray pulses aligned in absolute phase with two of the three radio pulses, leading to a consistent picture in which the high-energy pulses and the aligned radio pulses are produced in the same zones in the magnetosphere (see e.g. Romani & Yadigaroglu (1995)). The apparent alignment of the -ray pulses of PSR J02184232 with two of three pulses measured at 610 MHz suggests also that some of the radio pulses are produced in the same zones in the magnetosphere as the -ray pulses. However, we would first like to see a better radio estimate of the viewing angle for the PSR J02184232 system, and a confirmation of the absolute alignment using new and better observations at X-ray energies, before making further speculations on the geometry.
Theoretical models attempting to explain the high-energy electro-magnetic radiation from spin-down powered pulsars are divided in two main catagories distinguished by the production sites of the radiation in the pulsar magnetospheres. The first class of models, polar cap (PC) models, rely on the acceleration of charged particles along the open field lines near the magnetic pole(s) followed by cascade processes given rise to high-energy electro-magnetic radiation (see e.g Daugherty & Harding (1994), 1996). In the second class of models, outergap models (OG), the acceleration of charged particles and subsequent generation of high-energy radiation takes place in vacuum gaps near the pulsar light cylinder (see e.g. Cheng et al. 1986a,b and Ho (1989)). Unfortunately, for the case of ms pulsars no detailed self-consistent model calculations exist for either class of models, allowing predictions for different observational aspects, e.g. pulse phase resolved spectra, pulse shapes, efficiencies. In most cases only one aspect of the emergent high-energy radiation is addressed.
The PC model elaborated by a Polish group (Bulik, Dyks & Rudak), for example, only focusses on the emergent high-energy electro-magnetic spectrum from ms pulsars from X-rays up to high-energy -rays, while the pulse shape is ignored. This group predicts a dominating Synchrotron component over the entire X-ray/soft -ray band (0.1 keV - 1 MeV) with a spectral photon index of (Dyks & Rudak (1999)). This does not agree with the much harder photon indices of observed for PSR J0218+4232, PSR B1937+21 and PSR B1821-24. The predicted -ray spectrum, dominated by curvature radiation, peaks between 10 GeV and 100 GeV and even an inverse Compton scattering component is predicted at TeV energies (Bulik & Rudak (1999); Bulik et al. (2000)). The maximum in the observed spectrum of PSR J02184232 ( or representation) is located in the 1–100 MeV range, also in contradiction with their model prediction (see Fig. 8). Their -ray flux prediction for PSR J02184232 is even more than a factor of 10 below the expected GLAST sensitivity level, thus not at all detectable by the less sensitive EGRET telescope for which we present the results.
The polar cap cascade model of Zhang & Harding (2000) including now also, compared to earlier versions, inverse Compton scattering of higher generation cascade pairs provides predictions for both the X-ray and -ray luminosities of spin-down powered pulsars, including ms pulsars. In the soft/medium energy X-ray band the model predicts a thermal origin of the spectral features of the pulsed emission from ms pulsars. This is inconsistent with the observed non-thermal (very) hard pulsed spectra of the 3 Class II ms pulsars. However, for the Class I ms pulsars this could be in agreement with the observed spectral properties.
Zhang and Harding also predict that ms pulsars usually have a considerable high-energy -ray luminosity, but due to their weak magnetic field strengths, resulting in quite high photon escape energies, the emergent -spectrum is very hard. The latter is not in agreement with the observed soft high-energy (photon Power-law index of for energies between 100 MeV and 1 GeV) -ray spectrum of PSR J02184232 .
Thus, so far the PC scenario based models appear to be unsuccessful in explaining the observed X-ray and -ray properties of the Class II ms pulsars.
An outergap model aiming at predicting pulsed and unpulsed -ray emission from ms pulsars was presented by Wei et al. (1996). This model predicts a spectral photon index of for the pulsed emission from a ms pulsar for the energy range of keV to MeV, in contradiction with the spectrum we show in Fig. 8 for PSR J02184232 . The model predicts also a harder unpulsed component with a spectral photon index of , dominating the pulsed component above MeV. We have not detected this component for PSR J02184232 at energies above 100 MeV.
Concerning the energetics of the -ray emission of PSR J02184232 it is interesting to compare the observed -ray efficiency (fraction of the total spin-down luminosity) of with theoretically derived efficiencies. For the PC model of Zhang & Harding (2000) the efficiency scales as with the pulse period and the characteristic age of the pulsar. Expressed in the Crab pulsar efficiency we find for PSR J02184232 that , which translates to an efficiency of substituting the measured Crab -ray efficiency of about . The thick OG model of Zhang & Cheng (1998) yields the following expression for the -ray efficiency: . This translates to , which means that . Thus, within the framework of both PC and OG models the expected -ray conversion efficiency is very high, approximately in accordance with the measured efficiency of about . However, it should be noted that both models predict an even higher efficiency for e.g. PSR J0437-4715, a Class I ms pulsar. This pulsar is very nearby but has not been detected as a -ray source/pulsar (Fierro et al. (1995)).
The circumstantial evidence presented in this paper for the detection of pulsed high-energy -rays from ms pulsar PSR J02184232 opens a new window in the study of the magnetospheric properties of spin-down powered pulsars. It is unfortunate that we cannot repeat this observation with EGRET anymore. Therefore, deep searches for high-energy -ray emission from the Class II ms pulsars with future more sensitive gamma-ray missions like GLAST and AGILE are very important. But also earlier sensitive observations at the harder X-rays above 10 keV are very important to bridge the observational gap. Particularly the ESA mission INTEGRAL might be able to extend the hard spectra measured below 10 keV to as high as a few MeV.
Acknowledgements.
This work is supported by the Netherlands Organisation for Scientific Research (NWO). We thank Michael Kramer for providing the 1400 MHz radio profile of PSR J02184232 obtained with the Effelsberg radio telescope.References
- Becker & Trümper (1993) Becker W., Trümper J., 1993, Nat 365, 528
- Becker & Trümper (1999) Becker W., Trümper J., 1999, A&A 341, 803
- Bhattacharya & Srinivasan (1991) Bhattacharya D., Srinivasan G., 1991, JA&A 12, 17
- Buccheri et al. (1983) Buccheri R., Bennett K., Bignami G., et al., 1983, A&A 128, 245
- Bulik & Rudak (1999) Bulik T., Rudak B., 1999, Astrophysical Letters and communications 38, 37
- Bulik et al. (2000) Bulik T., Rudak B., Dyks J., 2000, MNRAS, submitted
- (7) Cheng K.S., Ho C., Ruderman M., 1986a, ApJ 300, 500
- (8) Cheng K.S., Ho C., Ruderman M., 1986b, ApJ 300, 522
- Daugherty & Harding (1994) Daugherty J.K., Harding A.K, 1994, ApJ 429, 325
- Daugherty & Harding (1996) Daugherty J.K., Harding A.K, 1996, ApJ 458, 278
- de Jager et al. (1986) de Jager O.C., Swanepoel J.W.H., Raubenheimer B.C., 1986, A&A 170, 187
- de Jager et al. (1989) de Jager O.C., Swanepoel J.W.H., Raubenheimer B.C., 1989, A&A 221, 180
- de Vries (1994) de Vries C.P., 1994, In: Crabtree D.R., Hanisch R.J., Barnes J. (eds.) ASP Conf. Series 61, 399
- Dingus et al. (1996) Dingus B.L., Bertsch D.L., Digel S.W., et al., 1996, ApJ 467, 589
- Dyks & Rudak (1999) Dyks J., Rudak B., 1999, Astrophysical Letters and communications 38, 41
- Esposito et al. (1999) Esposito J.A., Bertsch D.L., Chen A.W., et al., 1999 , ApJS 123, 203
- Fierro (1995) Fierro J.M., 1995, PhD. Thesis, Stanford University
- Fierro et al. (1995) Fierro J.M., Arzoumanian Z., Bailes M., et al., 1995, ApJ 447, 807
- Hartman et al. (1999) Hartman R.C., Bertsch D.L., Bloom S.D., et al., 1999, ApJS 123, 79
- Ho (1989) Ho C., 1989, ApJ 342, 396
- Hunter et al. (1997) Hunter S.D., Bertsch D.L., Catelli J.R., et al., 1997, ApJ 481, 205
- Johnson et al. (1993) Johnson W.N., Kinzer R.L., Kurfess J.D., et al., 1993, ApJS 86, 693
- Kaspi et al. (2000) Kaspi V., Lackey J.R., Mattox J., et al., 2000, ApJ 528, 445
- Kawai & Saito (1999) Kawai N., Saito Y., 1999, Astrophysical Letters and communications 38, 1
- van Kerkwijk (1997) van Kerkwijk M.H., 1997, Proc. IAU Coll. 160, 489
- Kramer et al. (2000) Kramer M., Lange C., Lorimer D.R., et al., ApJ accepted, 2000
- Kuiper et al. (1998) Kuiper L., Hermsen W., Verbunt F., et al., 1998, A&A 336, 545
- Kuiper et al. (1999a) Kuiper L., Hermsen W., Verbunt F., et al., 1999a, Astrophysical Letters and communications 38, 13
- (29) Kuiper L., Hermsen W., Krijger J.M., et al., 1999b, A&A 351, 119
- Lin et al. (1999) Lin Y.C., Bertsch D.L., Bloom S.D., et al., 1999, ApJ 525, 191
- Lamb & Macomb (1997) Lamb R.C., Macomb D.J., 1997, ApJ 488, 872
- McLaughlin et al. (1996) McLaughlin M.A., Mattox J.R., Cordes J.M., et al., 1996, ApJ 473, 763
- Mineo et al. (2000) Mineo T., Cusumano G., Kuiper L., et al., 2000, A&A 355, 1053
- Mukherjee et al. (1997) Mukherjee R., Bertsch D.L., Bloom S.D., et al., 1997, ApJ 490, 116
- Navarro et al. (1995) Navarro J., de Bruyn A.G., Frail D.A., Kulkarni S.R., Lyne A.G., 1995, ApJ 455, L55
- Ramanamurthy et al. (1996) Ramanamurthy P.V., Fichtel C.E., Kniffen D.A., et al., 1996, ApJ 458, 755
- Romani & Yadigaroglu (1995) Romani R., Yadigaroglu I.A, 1995, ApJ 438, 314
- Saito et al. (1997) Saito Y., Kawai N., Kamae T., et al., 1997, ApJ 477, L37
- Schönfelder et al. (1993) Schönfelder V., Aarts H., Bennett K., et al., 1993, ApJS 86, 657
- Sreekumar et al. (1998) Sreekumar P., Bertsch D.L., Dingus B.L., et al., 1998 , ApJ 494, 523
- Stairs et al. (1999) Stairs I.H., Thorsett S.E., Camilo F., 1999 , ApJS 123, 627
- Strong & Mattox (1996) Strong A.W., Mattox J.R., 1996, A&A 308, L21
- Sturner & Dermer (1994) Sturner S.J., Dermer C.D.,1994, A&A 281, L101
- Takahashi et al. (1999) Takahashi M., Shibata S., Gunji S., et al., 1999, Astron. Nachr. 320, 340
- Taylor & Cordes (1993) Taylor J.H., Cordes J.M., 1993, ApJ 411, 674
- Thompson et al. (1993) Thompson D.J., Bertsch D.L., Fichtel C.E., et al., 1993 , ApJS 86, 629
- Thompson et al. (1995) Thompson D.J., Bertsch D.L., Dingus B.L., et al., 1995 , ApJS 101, 259
- Thompson et al. (1997) Thompson D.J., Harding, A.K., Hermsen, W., et al., 1997, Proc. 4th Compton Symp., eds. C.D. Dermer, M.S. Strickman, J.D. Kurfess, AIP Conf. Proc. 410, 39
- Ulmer et al. (1991) Ulmer M.P., Purcell W.R., Wheaton W.A., et al., 1991, ApJ 369, 485
- Ulmer et al. (1999) Ulmer M.P., Park S., Finley J.P., et al., 1999, Astrophysical Letters and communications 38, 29
- Verbunt et al. (1996) Verbunt F., Kuiper L., Belloni T., et al., 1996, A&A 311, L9
- Wei et al. (1996) Wei D.M., Cheng K.S., Lu T., 1996, ApJ 468, 207
- Zhang & Cheng (1998) Zhang L., Cheng K.S., 1998, MNRAS 294, 177
- Zhang & Harding (2000) Zhang B., Harding A., 2000, ApJ submitted