X-ray and optical follow-up observations of the August 1998 X-ray transient in NGC 6440
Abstract
The BeppoSAX Wide Field Cameras detected a transient in NGC 6440 on 1998 Aug 22. ROSAT did not detect this source on 1998 Sep 8, indicating that the X-ray flux had decreased by a factor 400 at least, and/or that the X-ray spectrum had become appreciably softer. Analysis of archival ROSAT HRI data reveals two sources associated with NGC 6440; one of these may be the transient in quiescence. We have also obtained B and R images of NGC 6440 on 1998 Aug 26 and again on 1999 July 15, when the transient had returned to quiescence. Subtraction of these images reveals one object in the core which was brighter in B, but not in R, during the X-ray outburst. We estimate and on 1998 Aug 26, which makes it a viable candidate counterpart.
Key Words.:
Stars: individual: SAX J1748.9-2021, MX 1746-20 - stars: neutron - globular clusters: individual: NGC6440 - X-rays: stars1 Introduction
NGC 6440 is a globular cluster near the center of the Galaxy, at a distance of 8.5 kpc and reddened by (Ortolani et al. 1994). A bright X-ray source was detected near this cluster with OSO-7 and with UHURU from 1971 December 17 to 1972 January 21 (Markert et al. 1975, Forman et al. 1976). UHURU observations obtained before 1971 Oct 23 and after 1972 Mar 1 did not detect the source (Forman et al. 1976). During the outburst the transient X-ray source had a virtually constant luminosity of about , in the 2-11 keV band. Before and after the outburst the flux was less than 5% of this. (We use the conversion of UHURU to flux given by Bradt & McClintock 1983; and the absorption column determined by in ’t Zand et al. 1999.)
A dim source was detected in the core of NGC 6440 with the Einstein satellite, and again with ROSAT, at a luminosity of , in the 0.5-2.5 keV band (Hertz & Grindlay 1983; Johnston et al. 1995); after conversion to the 2-11 keV band, this corresponds to of the outburst flux.
On 1998 August 22 a bright transient source appeared again in NGC 6440, observed with BeppoSAX. The position coincides with the globular cluster within the accuracy of 1′. This time the outburst lasted rather shorter: the source had a luminosity of on Aug 22, on Aug 26, and on Sep 1, in the 2-10 keV band (in ’t Zand et al. 1999, also see Fig. 3).
Like persistent bright X-ray sources, transients occur more often in globular clusters per unit of stellar mass than in the galactic disk. To understand this overabundance one would like to study these sources at optical and ultraviolet wavelengths. So far, no transient X-ray source in a globular cluster has been optically identified. Such identification is difficult because the relatively large error circle of the X-ray position contains a large number of stars. We therefore obtained a ROSAT HRI observation as soon as possible after the detection of the transient with BeppoSAX, in the hope of improving the X-ray position. The optical brightness of soft X-ray transients is known to vary in tandem with the X-ray luminosity (for a review, see e.g. Chen et al. 1997). We therefore obtained optical images of NGC 6440 to look for objects that vary in tandem with the X-ray flux, in the hope of identifying the optical counterpart of the transient.
In Sect. 2 we describe the results of the new ROSAT HRI observation, and also analyse archival ROSAT data of NGC 6440. In Sect. 3 we describe the optical observations and the search for an optical counterpart to the X-ray source. Our results and their implications are discussed in Sect. 4.
2 X-ray observations
| date | exposure | counts | countrate | |
|---|---|---|---|---|
| start & end | (s) | (cts/ksec) | ||
| 1991 Mar | 2448335.100-36.796 | 5779 | 103 | 1.70.6 |
| 1992 Sep | 2448882.685-82.705 | 1522 | 8 | 5.3 |
| 1993 Mar | 2449066.507-68.662 | 27056 | 7910 | 2.90.4 |
| 1994 Mar | 2449425.378-34.410 | 2769 | 8 | 2.9 |
| 1994 Sep | 2449611.228-13.774 | 15172 | 387 | 2.50.5 |
| 1998 Sep | 2451064.743-64.766 | 1940 | 10 | 5.2 |
The X-ray observations were obtained with the ROSAT X-Ray Telescope (Trümper et al. 1991) in combination with the High-Resolution Imager (HRI, David et al. 1995). The log of the observations is given in Table 1; the last entry in that table is the one obtained near the BeppoSAX observations, the other entries refer to earlier observations in the ROSAT data archive. The standard data reduction was done with the Extended Scientific Analysis System (Zimmermann et al. 1996). To take into account the re-calibration of the pixel size (Hasinger et al. 1998), we multiply the pixel coordinates of each photon with respect to the HRI center with 0.9972. Then a search for sources is made by comparing counts in a box with the counts in a ring surrounding it, and by moving this detection box across the image. The sources thus detected are excised from the image and a background map is made for the remaining photons. A search for sources is made by comparing the number of photons in a moving box with respect to the number expected on the basis of the background map. Finally, at each position in which a source was found, a maximum-likelihood technique is used to compare the observed photon distribution with the point spread function of the HRI (Cruddace et al. 1988). The resulting countrates for significant detections near the centre of each image are given in Table 1.
2.1 The 1998 observation
No source is detected in the 1998 Sep 8 observation. For a point source at the center of the image, 90% of the photons arrive within a circle with a 5′′ radius, in stable HRI pointings (David et al. 1995). At the time of observation the ROSAT satellite pointing was experiencing difficulties, effectively extending the radius of the point spread function by a few arcseconds. We therefore search a circle with a 10′′ radius around the center of NGC 6440 (according to Picard & Johnston 1995; see Table 3), only five photons are detected. The maximum of five photons detected remains if we move the center of the circle to any location within 30′′ of the nominal cluster centre, thus allowing for possible inaccurate reconstruction of the satellite pointing.
For an expected number of 10 photons, the Poisson probability of detecting 5 or fewer photons is 7%. We thus take 10 photons as the 2- upper limit, which for the exposure of 1940 s gives an upper limit for the count rate of 0.005 . To convert this countrate into a luminosity we use one of the fits made to the BeppoSAX data by in ’t Zand et al. (1999), viz. a sum of a black body with temperature keV and a bremsstrahlung spectrum with temperature keV, absorbed by a column . In the ROSAT bandpass of 0.5-2.5 keV the bremsstrahlung and blackbody components contribute 83 and 17 %, respectively, to the total flux. For this spectrum, the upper limit of 0.005 in the HRI corresponds to an X-ray luminosity of between 0.5 and 2.5 keV, or between 2 and 10 keV. Note that the ROSAT range from 0.1-2.5 keV is effectively limited to above 0.5 keV because of the high reddening. Since SAX measures the flux down to 2 keV, the estimates of the ROSAT flux are quite accurate.
This implies that the flux of the transient in NGC 6440 dropped by a factor 250 or more between the BeppoSAX observation on Aug 26 and the ROSAT HRI observation on Sep 8.


2.2 Earlier ROSAT observations: standard analysis
The ROSAT data archive contains several hitherto unpublished observations of NGC 6440 made with the ROSAT HRI after the 1991 observation reported by Johnston et al. (1995). A list of all ROSAT observations is given in Table 1. We have analyzed each observation separately with the standard procedure, and detect the source in NGC 6440 in the 1993 observation and in the Sep 1994 observation, i.e. in the observations with the longer exposure times. In the shorter observations, we only obtain upper limits. From the observed number of 3 counts in a circle with 5′′ radius near the cluster center we derive an upper limit to the countrate of 8 counts for the central source for both the 1992 and the March 1994 observation. The three detections are compatible with a constant countrate, at a level below the derived upper limits. We therefore have no indication of variability between the ROSAT observations. On the other hand, a variation by a factor 2 in the countrate between the 1991 and the 1993 detections is well within the range allowed by the limited statistics.
The only source, other than the central source, detected significantly in any of the ROSAT HRI pointings, is a point source in the 1993 observation, listed as X3 in Table 3. There is no bright () optical counterpart to this source in the digitized sky survey; and no object in SIMBAD within 1′ of its position. We therefore cannot determine an accurate bore sight correction, and the uncertainty in the position of the central X-ray source is dominated by the inaccuracy of the bore sight determination, which is about 5′′ (1-; see David et al. 1995). With this uncertainty, the three positions found for the central source in 1991, 1993 and 1994 Sep are all compatible.
For each of the two longest observations, the standard analysis indicates that the central source is extended, i.e. the distributions of the photons is not compatible with that of a single point source. No such indication is present in the 1991 observation, which has a very small number of detected counts.
2.3 Closer investigation of the central source
To establish the nature of the extension of the central source we first study the longest observation, obtained in 1993. A smoothed X-ray image of the central region of NGC 6440, shown in Fig. 1, suggests that two sources are present. They are too close to be separated by the standard analysis. We therefore implement a further analysis, based on the maximum-likelihood method (see e.g. Cash 1979, Mattox et al. 1996), as follows.
The probability at detector pixel to obtain photons when a model predicts photons is described by Poisson statistics
| (1) |
The probability that the model describes the observations is given by the product of the probabilities for all in the region considered: . For computational ease we maximize the logarithm of this quantity:
| (2) |
The last term in this equation doesn’t depend on the assumed model, and – in terms of selecting the best model – may be considered as a constant. Thus maximizing is equivalent to minimizing , where
| (3) |
Our further analysis of the 1993 ROSAT HRI observation is limited to the central area, and consists of four steps, in which we fit a constant background, or a constant background plus one, two, or three sources. The values of for the best models of these fits are denoted as , , , and respectively. The significance of the th source is found by comparing with a distribution for three degrees of freedom (for the flux and position of the source).
| date | counts | cts/ksec | (3dof) | |||||
|---|---|---|---|---|---|---|---|---|
| X1 | X2 | X1 | X2 | X1 | X2 | ′′ | ′′ | |
| 1991 Mar | 10 | 4 | 1.8 | 0.8 | 29 | 10 | 9.3 | 8.5 |
| 1993 Mar | 44 | 24 | 1.6 | 0.9 | 76 | 39 | 7.7 | 9.0 |
| 1994 Sep | 15 | 14 | 1.0 | 0.9 | 22 | 19 | 7.2 | 8.5 |
In performing the fits, we use the analytical result that the best fit has a number of model photons equal to the number of detected photons. Thus, in the model of a constant background, i.e. a constant value of , the optimum value of is found directly by dividing the observed number of photons by the number of pixels under consideration.
In fitting a constant plus one source, we distribute the source counts around the source position according to the ROSAT HRI point spread function at the center of the detector (David et al. 1995). We then vary the background and source counts, and the source position, to minimize . In doing so we keep the sum of the source and background counts fixed at the observed number.
Next, we fit a constant background plus two or three point sources. In this fit, the parameters of the first source are allowed to vary; we use a Downhill Simplex method as implemented by Press et al. (1992) to minimize with respect to the 7 or 10 variables. Here again, the sum of the model counts for the background and the two/three sources is kept constant, at the observed number.
The results of this fitting procedure are summarized in Table 2; the resulting source positions are shown in Fig. 1 and listed in Table 3. A third source in the center is nominally significant at the 3- level; however, our analysis doesn’t take into account any remaining jitter in the Point Spread Function, and we consider the existence of this source not proven. Therefore, we do not list the source in Table 3; its position is shown in Fig. 1.
| (2000) | (2000) | cts/ksec | () | ||||||
|---|---|---|---|---|---|---|---|---|---|
| SAX | 17 | 48 | 53.4 | 20 | 21 | 43 | 60′′ | ||
| X1 | 17 | 48 | 52.98 | 20 | 21 | 40.6 | 10 | 1.60.3 | |
| X2 | 17 | 48 | 52.43 | 20 | 21 | 31.7 | 12 | 0.90.3 | |
| X3 | 17 | 48 | 34.91 | 20 | 25 | 46.0 | 12 | 0.90.2 | |
| C | 17 | 48 | 52.7 | 20 | 21 | 36.9 | 10 | ||
| V0 | 17 | 48 | 52.40 | 20 | 21 | 38.7 | 05 | ||
| V1 | 17 | 48 | 52.62 | 20 | 21 | 39.5 | 05 | ||
| V2 | 17 | 48 | 52.14 | 20 | 21 | 32.6 | 05 | ||
3 Optical observations
Optical images while the X-ray source was still on were taken for us in Service Time in the night of 1998 August 26 to 27 at the 3.5-m New Techology Telescope (NTT) at La Silla, using the Superb Seeing Imager SUSI2, and with the 8-m Unit Telescope #1 (Antu) of the Very Large Telescope at Paranal, using the VLT Test Camera. We will only discuss the NTT observations here, as these had better seeing. With SUSI2, one 10-s and two 100-s exposures were taken through a Bessell R filter, as well as two 900-s exposures through a Bessell B filter. During the observations, the seeing varied between from the first R-band image to in last B-band image. The night was not photometric. The detector was a mosaic of two EEV CCDs, each composed of square pixels of m on the side. They were read out binned by 2 in each direction, as the plate scale of would substantially oversample the seeing. For all but the first, 10-s R-band image, the telescope was offset such that the core of the cluster was not too close to the gap between the two CCDs. The data reduction was done using standard procedures, determining the bias from the overscan regions (after verification on bias frames) and correcting for pixel-to-pixel sensitivity variations using dome flats taken in the morning following the observations.
On 1999 July 15, when the X-ray source was off, we took images with the Focal Reducer/Low Dispersion Spectrograph FORS1 on Antu through Bessell R, B, and U filters. The night was not photometric, and the seeing varied from to . Two 10-s and one 100-s exposures were taken in R, two 30-s and one 300-s in B, and one 100-s and one 600-s in U. The detector was a Tektronix CCD with pixels of m. The standard resolution collimator was used, for which the plate scale is . The detector was read out through all four amplifiers, using the low-gain setting, of about .
The data reduction was done using standard procedures. From bias frames taken before and after the night, it was found that the level was somewhat variable, both in time and in position on the detector, but that the offsets remained constant relative to the levels found from the overscan pixels (the latter determined separately for the four quadrants). For bias subtraction, therefore, we subtracted both the levels from the overscan regions in individual frames, as well as an average of the overscan-corrected bias frames. The frames were corrected for sensitivity variations using flat fields constructed from images of the sky taken at dusk and dawn.
Since the conditions were not photometric during either of our two runs, we cannot reliably calibrate our data. We obtained a rough calibration using B and R magnitudes of Hamuy (1986) of the integrated flux of the cluster. Magnitudes are listed for two apertures, with diameters of 80 and 100″; these give consistent results. The calibration is consistent within 0.1 mag with one photoelectric B magnitude from Martins & Harvel (1979; star 5), within 0.3 mag with B and R magnitudes inferred from V and I magnitudes measured by Ortolani et al. (1994), but differs at the 0.5 magnitude level from what one would infer using photographic B magnitudes from Martins et al. (1980). We therefore estimate that the zero-point uncertainty on our quoted magnitudes is about 0.5 mag.
3.1 Astrometry
Astrometry of our frames was done relative to the USNO-A2.0 catalogue (Monet et al. 1998). For all USNO-A2.0 stars overlapping with the best-seeing FORS 10-s R-band image, centroids were determined and the pixel coordinates corrected for instrumental distortion using a cubic radial distortion function provided to us by T. Szeifert and W. Seifert (1999, private communication). From these, the zero point position, the plate scale, and the position angle on the sky were determined. Unexpectedly, the root-mean-square residuals are rather large, about in each coordinate. This is substantially larger than what we generally found in other fields; for instance, for a field at and , we find residuals of in each coordinate.
Most likely, the problem lies with the severe crowding in the field of NGC 6440, which causes many of the USNO-A2.0 stars to be blended. Furthermore, the USNO-A2.0 stars appear to have been derived from two different sets of plates, with epochs 1950.465 and 1980.488. The former will be plates taken from Palomar, at high airmass. For our solution, therefore, we selected only measurements for the more recent epoch, and from these, only those 246 stars which were well-exposed and appeared stellar on our FORS image. For these, the rms residuals were and in right ascension and declination, respectively. This is still much larger than usual, and therefore it is difficult to estimate the uncertainty. Fortunately, there is one Tycho star, TYC 6257-368-1, at the Southern edge of our VLT images. While this star is strongly overexposed, it was possible to determine a reasonably accurate centroid (verified using different exposures). The coordinates we infer using our astrometry are offset from the Tycho-2 coordinates (Høg et al. 2000) by and in right ascension and declination, respectively. We conclude that the systematic uncertainty in our astrometry is , i.e., substantially less than the uncertainty in the X-ray positions.
The individual frames were tied in to the astrometry using some 400 secondary reference stars in a square region 2′ on a side centered on NGC 6440, but excluding stars within 20″ of the core. Typical residuals range from in each coordinate for the tie to the SUSI R-band images to for that to the FORS U-band images.
3.2 Variable sources
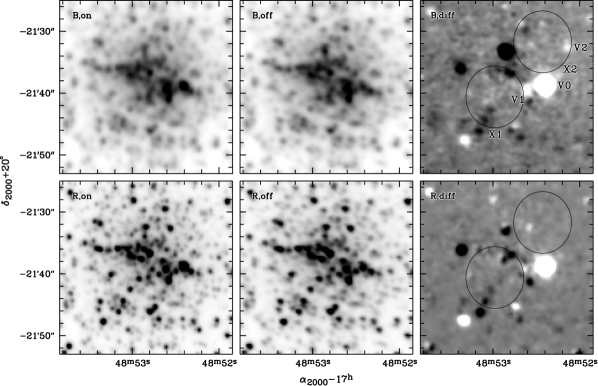
In Fig. 2, the reduced on and off-state B and R-band images are shown. The positions of the two X-ray sources fall close to the core of NGC 6440 and because of the crowding it is difficult to discern variable stars directly. To get an objective measure of variability in the core, we formed on-off difference images. For this purpose, we used the optimal image subtraction technique introduced by Alard & Lupton (1998). In this method, the image with better seeing is convolved with a kernel chosen such that the convolved point-spread function is as close as possible to that of the image with the worse seeing. In our case, this did not work perfectly, because for both bands the seeing is comparable in the on and off images, while the shapes of the point spread functions are somewhat different; the result is a convolution kernel which is negative in some points (in directions where “sharpening” of the better-seeing image is required). We proceeded by convolving the worst-seeing (FORS) images with a Gaussian with . Relative to this slightly smoothed image, it was possible to determine a kernel which is positive everywhere. After convolution with this kernel, the SUSI image and the slightly smoothed FORS image have very similar point-spread functions, and the subtraction works well.
The on minus off difference images found using the above method are shown in Fig. 2. It is clear that a number of stars brightened or dimmed considerably; a conspicuous one is star V0 on the Western end of the core. Most of these variables, including V0, are bright, red stars, most likely near the end of the asymptotic giant branch; indeed, the reddest, most luminous object in the sample of Ortolani et al. (1994) was found to be variable as well (it is out of the field shown in Fig. 2).
If the optical emission of the X-ray source is dominated by an accretion disk, as is generally the case for low-mass X-ray binaries, the optical counterpart is expected to be blue, and the brightess difference between on and off is expected to be relatively large. Given the problems with crowding, the resolution element that includes the source may not appear to be blue, but the difference between on and off should be blue. For this reason, we do not consider V0 to be a likely candidate; more likely, it is a Mira type variable. One could envisage a wide binary in which a Mira star transfers matter during its expansion. However, in that case the outburst would be expected to last rather longer than observed.
In each of the error circles, there is one source which was brighter when the X-ray source was on, and for which the difference flux is substantially bluer than that for other variables in the field. For X1, the source V1 is just outside the western edge of the error circle, while for X2, V2 is just inside the error circle. The coordinates of these variables are given in Table 3.V2 may be interesting in particular, since the relative brightening for that source is the second-largest in the field (about 10% in B, in R; the largest relative brightening – 50% and 100%, respectively – is shown by V0).
If V1 or V2 were the optical counterpart of the X-ray transient, we would expect that the source in quiescence had negligible contribution to the optical flux in the off image. The excess flux in the on image then would correspond to the the total flux of the source in outburst. We estimate the corresponding magnitudes using our approximate calibration. For V1 we find , , and for V2 , . Correcting for reddening, one infers and , respectively, again indicating that V2 is very blue.
From the above, it seems that V2 has all the characteristics expected for the optical counterpart. It is clear, however, that finding a variable source inside one of the two error circles is not unlikely, even one whose variation is relatively blue. Therefore, at present we consider this source as no more than an interesting candidate.
4 Discussion
We have tried to reconstruct the approximate X-ray lightcurve of the August 1998 outburst by combining data from various measurements. Detections were made by the Wide Field Cameras and the Narrow Field Instruments on board of BeppoSAX on Aug 22 and 26, respectively; and by the XTE All Sky Monitor in a seven-day period starting on Aug 19. We revise the flux detected with the Wide Field Cameras to mCrab, slightly upwards from the values given in In ’t Zand et al. (1999), on the basis of a better calibration. Upper limits were obtained with the BeppoSAX Wide Field Cameras on Sep 1 and with the XTE All Sky Monitor in the seven days periods preceding and following the detection. Fig. 3 shows the resulting lightcurve.

Extrapolating the 5-day exponential decay from the BeppoSAX detections to the time of the ROSAT HRI observation, we predict an X-ray luminosity of in the ROSAT band; this is about an order of magnitude above the observed upper limit. This may imply that the decay accelerated; or alternatively that the spectrum softened, since low-energy photons are much more affected by the heavy absorption towards NGC 6440. There is indeed evidence for other X-ray transients that the spectrum in the low state is much softer than during outburst, e.g. for Aql X-1 (Verbunt et al. 1994).
The X-ray lightcurve shown in Fig. 3 implies that the optical observations were made at an X-ray flux level of about 10 mCrab, corresponding to a source luminosity . Van Paradijs & McClintock (1994) give a semi-empirical relation between the orbital period, X-ray luminosity and absolute visual magnitude of a low-mass X-ray binary. Applying this relation to the transient in NGC 6440 with the estimate of the X-ray luminosity for the time of the optical observation, we obtain for an assumed 1 hr period. At the distance and reddening of NGC 6640 this corresponds to . The intrinsic colour of low-mass X-ray binaries is close to zero; with the reddening to NGC 6440 we thus predict for a one hour period. For a period of 5 hr (0.2 hr) the predicted magnitude is about 1 magnitude brighter (fainter). We conclude that the candidate in the error circle of X2 is viable; the proximity of the predicted magnitude to the observed one is fortuitous, considering that the spread in the relation given by Van Paradijs & McClintock is about a magnitude, and that our estimate of the X-ray luminosity is uncertain. We therefore dare not estimate an orbital period on the basis of the magnitude of our candidate.
The core of NGC 6440 contains PSR B 174520 (Lyne et al. 1996). The total energy loss for the pulsar is about , where is the moment of inertia of the neutron star, its rotation frequency and the time derivative of . Typical X-ray luminosities for radio pulsars are of order (e.g. Fig. 4 in Verbunt et al. 1996). We conclude that it is very unlikely that the pulsar is responsible for the observed X-ray flux of X1 or X2.
Acknowledgements.
We have made use of the ROSAT Data Archive of the Max Planck Institut für extraterrestrische Physik at Garching; and of the SIMBAD database operated at Centre de Données astronomiques in Strasbourg. The ROSAT HRI data of 8 Sep 1998 and the ESO data of 26/27 Aug 1998 were obtained as Target of Opportunity observations, triggered by quick look analysis of BeppoSAX observations. We thank Michael Smith for making the BeppoSAX observations quickly available, and Vanessa Doublier and Bruno Leibundgut for making the ESO NTT and VLT observations.References
- Alard & Lupton (1998) Alard, C., Lupton, R. 1998, ApJ, 503, 325
- Bradt & McClintock (1983) Bradt, H., McClintock, J. 1983, ARA&A, 21, 13
- Cash (1979) Cash, W. 1979, ApJ, 228, 939
- Chen et al. (1997) Chen, W., Shrader, C., Livio, M. 1997, ApJ, 491, 312
- Cruddace et al. (1988) Cruddace, R., Hasinger, G., Schmitt, J. 1988, in F. Murtagh, A. Heck (eds.), Astronomy from large databases, p. 177
- David et al. (1995) David, L., Harnden, Jr, F., Kearns, K., Zombeck, M. 1995, The ROSAT High Resolution Imager (HRI), Technical report, U.S. ROSAT Science Data Center/SAO
- Forman et al. (1976) Forman, W., Jones, C., Tananbaum, H. 1976, ApJ (Letters), 207, L25
- Hamuy (1986) Hamuy, M. 1986, A&AS, 65, 103
- Hasinger et al. (1998) Hasinger, G., Burg, R., Giacconi, R., Schmidt, M., Trümper, J., Zamorani, G. 1998, A&A, 329, 482
- Hertz & Grindlay (1983) Hertz, P., Grindlay, J. 1983, ApJ, 275, 105
- Høg et al. (2000) Høg, E., Fabricius, C., Makarov, V. V., et al. 2000, A&A, 355, L27
- in ’t Zand et al. (1999) in ’t Zand, J., Verbunt, F., Strohmayer, T., et al. 1999, A&A, 345, 100
- Johnston et al. (1995) Johnston, H., Verbunt, F., Hasinger, G. 1995, A&A, 298, L21
- Lyne et al. (1996) Lyne, A., Manchester, R., D’Amico, N. 1996, ApJ (Letters), 460, L41
- Markert et al. (1975) Markert, T., Backman, D., Canizares, C., Clark, G., Levine, A. 1975, Nat, 257, 32
- Martins & Harvel (1979) Martins, D., Harvel, C. 1979, AJ, 84, 1025
- Martins et al. (1980) Martins, D., Harvel, C., Miller, D. 1980, AJ, 85, 521
- Mattox et al. (1996) Mattox, J., Bertsch, D., Chiang, J., et al. 1996, ApJ, 461, 396
- Monet & et al. (1998) Monet, D., et al. 1998, The PMM USNO-A2.0 Catalog, US Naval Observatory
- Ortolani et al. (1994) Ortolani, S., Barbuy, B., Bica, E. 1994, A&AS, 108, 653
- Picard & Johnston (1995) Picard, A., Johnston, H. 1995, A&AS, 112, 89
- Press et al. (1992) Press, W., Teukolsky, S., Vetterling, W., Flannery, B. 1992, Numerical Recipes: The Art of Scientific Computing, Cambridge U. P., Cambridge
- Trümper et al. (1991) Trümper, J., Hasinger, G., Aschenbach, B., Bräuninger, H., Briel, U., Burkert, W., Fink, H., Pfeffermann, E., Pietsch, W., Predehl, P., Schmitt, J., Voges, W., Zimmermann, U., Beuermann, K. 1991, Nat, 349, 579
- van Paradijs & McClintock (1994) van Paradijs, J., McClintock, J. 1994, A&A, 290, 133
- Verbunt et al. (1994) Verbunt, F., Belloni, T., Johnston, H., van der Klis, M., Lewin, W. 1994, A&A, 285, 903
- Verbunt et al. (1996) Verbunt, F., Kuiper, L., Belloni, T., Johnston, H., de Bruyn, A., Hermsen, W., van der Klis, M. 1996, A&A, 311, L9
- Zimmermann et al. (1996) Zimmermann, H., Becker, W., Belloni, T., Döbereiner, S., Izzo, C., Kahabka, P., Schwentker, O. 1996, EXSAS User’s Guide: Extended scientific analysis system to evaluate data from the astronomical X-ray satellite ROSAT, Edition 5, Technical report, MPE