Line formation in solar granulation
Abstract
Using realistic hydrodynamical simulations of the solar surface convection as 3D, time-dependent, inhomogeneous model atmospheres, the solar photospheric Si abundance has been determined to be log . This constitutes a difference of 0.04 dex compared with previous estimates based on the 1D Holweger-Müller (1974) model, of which half is attributable to the adopted model atmosphere and the remaining part to the improved quantum mechanical broadening treatment. As a consequence, all meteoritic abundances should be adjusted downwards by the same amount. In particular the meteoritic Fe abundance will be log , in good agreement with the recently determined photospheric Fe abundance (Asplund et al. 2000b). The existing uncertainties unfortunately prevent an observational confirmation of the postulated effects of elemental migration of metals in the Sun.
Key Words.:
Convection – Hydrodynamics – Line: formation – Sun: abundances – Sun: granulation – Sun: photosphere1 Introduction
To compare the meteoritic and solar photospheric chemical compositions it is necessary to have a common reference element. The honour is normally given to Si, which is an abundant element and a natural choice to measure other elemental abundances against in meteorites considering the volatility of hydrogen. In order to place all other meteoritic abundances on an absolute scale to confront with the photospheric abundances, one must therefore accurately know the photospheric Si/H ratio. As a consequence all meteoritic absolute abundances will depend on the measured solar photospheric Si abundance. In practice, one often utilizes additional elements besides Si to anchor the two scales more firmly to each other (e.g. Anders & Grevesse 1989).
Several determinations of the solar photospheric Si abundance exist in the literature (e.g. Holweger 1973; Lambert & Luck 1978; Becker et al. 1980) using the Holweger-Müller semi-empirical model atmosphere (Holweger & Müller 1974) and the use of equivalent widths and the microturbulence concept. Given the recent progress in the construction of self-consistent, 3D, hydrodynamical simulations of the solar surface convection (e.g. Stein & Nordlund 1989, 1998; Asplund et al. 2000a,b, hereafter Paper I and II) and the significance of the solar photospheric Si abundance, a re-analysis seemed warranted, which is presented here. These convection simulations have now reached a very high degree of realism. Without relying on any free parameters, such as the mixing length parameters, the simulations successfully reproduce the granulation topology and statistics (Stein & Nordlund 1998), constraints from helioseismology (Rosenthal et al. 1999) and detailed spectral line shapes, shifts and asymmetries (Paper I and II). In particular, line profiles are accurately described without invoking any micro- and macroturbulence which are necessary in classical 1D spectral analyses. As a consequence several possible sources of uncertainties (e.g. model atmosphere limitations, equivalent widths and microturbulence) can be removed when deriving elemental abundances, which should result in more secure determinations.
2 3D spectral line formation and atomic data
The procedure is identical to that adopted for a recent determination of the solar photospheric Fe abundance (Paper II). In particular the model atmosphere is a realistic 3D hydrodynamical simulation of the solar surface convection consisting of 50 min solar time. For further details of the simulation and the 3D spectral line formation the interested reader is referred to Paper I and II.
| Species | Wavelength | log | log | ||
|---|---|---|---|---|---|
| [nm] | [eV] | [pm] | |||
| Si i | 564.56130 | 4.93 | -2.04 | 3.40 | 7.52 |
| Si i | 566.55550 | 4.92 | -1.94 | 4.00 | 7.45 |
| Si i | 568.44840 | 4.95 | -1.55 | 6.00 | 7.47 |
| Si i | 569.04250 | 4.93 | -1.77 | 5.20 | 7.51 |
| Si i | 570.11040 | 4.93 | -1.95 | 3.80 | 7.48 |
| Si i | 570.84000 | 4.95 | -1.37 | 7.80 | 7.48 |
| Si i | 577.21460 | 5.08 | -1.65 | 5.40 | 7.51 |
| Si i | 578.03840 | 4.92 | -2.25 | 2.60 | 7.52b |
| Si i | 579.30730 | 4.93 | -1.96 | 4.40 | 7.55 |
| Si i | 579.78560 | 4.95 | -1.95 | 4.00 | 7.55 |
| Si i | 594.85410 | 5.08 | -1.13 | 8.60 | 7.48 |
| Si i | 674.16280 | 5.98 | -1.65 | 1.60 | 7.55 |
| Si i | 697.65130 | 5.95 | -1.07 | 4.30 | 7.56b |
| Si i | 703.49010 | 5.87 | -0.78 | 6.70 | 7.54b |
| Si i | 722.62080 | 5.61 | -1.41 | 3.60 | 7.51 |
| Si i | 768.02660 | 5.86 | -0.59 | 9.80 | 7.54 |
| Si i | 791.83840 | 5.95 | -0.51 | 9.50 | 7.50b |
| Si i | 793.23480 | 5.96 | -0.37 | 9.70 | 7.53b |
| Si i | 797.03070 | 5.96 | -1.37 | 3.20 | 7.59 |
| Si ii | 634.71090 | 8.12 | 0.30 | 5.60 | 7.48 |
| Si ii | 637.13710 | 8.12 | -0.00 | 3.60 | 7.43 |
-
a
From Holweger (1973). Note that is only listed here to allow easy identification in Fig. 2 and is not used for the abundance determinations
-
b
Lines which are entered with half weight into the final abundance estimate due to uncertainties in broadening, oscillator strengths or suspected blends
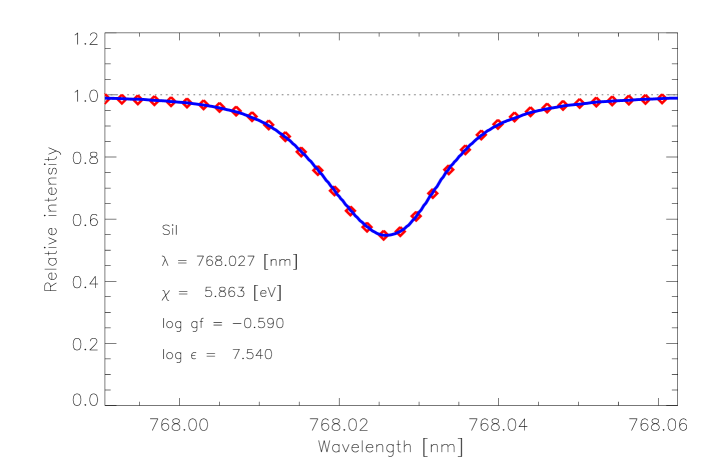
The Si lines used for the study are the same as in Holweger (1973) and are presented in Table 1 together with the necessary atomic data. The sample consists of 19 Si i and 2 Si ii lines. The necessary transition probabilities are taken from Becker et al. (1980), which are the same as measured by Garz (1973) but corrected using more recent lifetime measurements. We note that the lifetime measurements of Smith et al. (1987) in fact support the scale of Garz (1973) but until the conflicting lifetime situation has been clarified, I have chosen to adopt the values of Becker et al. (1980) to emphasize the effect of using 3D model atmospheres; new improved measurements of the branching ratios and lifetimes of the Si lines seem justified. The collisional broadening data for both Si i and Si ii lines have been computed following the recipes of Anstee & O’Mara (1991, 1995), Barklem & O’Mara (1997), Barklem et al. (1998) and Barklem (2000, private communication). If one instead would embrace the classical collisional treatment of Unsöld (1955) without any damping enhancement factors the final Si abundance would be 0.02 dex higher with a slightly increased scatter. Stark broadening and radiative broadening was included with data taken from the VALD database (Kupka et al. 1999), although Stark broadening is only of some significance for Si i 730.49 and 768.03 nm. The Si abundance has been determined from profile fitting of the individual Si lines through a -analysis in a similar fashion to the study of Nissen et al. (2000) rather than equivalent widths. The solar atlas of Brault & Neckel (1987) and Neckel (1999) provided the observed spectrum. Fig. 1 shows an example of the achieved agreement between predicted and observed line profiles. It should be emphasized that this has been accomplished without invoking any free parameters besides the elemental abundance; the result is clearly superior to what is possible using 1D model atmospheres such as the Holweger-Müller (1974) model.
3 The solar photospheric Si abundance
Fig. 2 reveals no clear trend in the derived individual Si abundances with line strength; the span in excitation potential is unfortunately too small to clearly delineate any possible trend. When including all Si i and Si ii lines with equal weight, the estimated solar photospheric Si abundance is log 111On the customary logarithmic abundance scale defined to have log, where the quoted uncertainty is the standard deviation. If equivalent widths from the literature (Holweger 1973) had been used instead of profile fitting, the mean abundance would have remained the same but the scatter would have increased somewhat. When comparing line profiles it was noticed that a few lines are less suitable for abundance determinations. The most likely reasons for the poor agreement in the profile fitting appear to be suspected blends or erroneous broadening treatment. Such lines enter the final abundance estimate with half weight as marked in Table 1.
The re-analysis of the solar Si lines then results in
which is only slightly less than the value () published by Becker et al. (1980) with the same set of transition probabilities. Half of this difference is due to the adoption of a 3D hydrodynamical model atmosphere instead of the Holweger-Müller (1974) model atmosphere and the remaining part to the improved quantum mechanical broadening treatment instead of Unsöld (1955) pressure broadening. Clearly the Si lines are little sensitive to the detailed atmospheric structure and emphasizes that the main uncertainty is likely to be the absolute -scale, although the small scatter suggests that the relative measurements by Garz (1973) are of good internal consistency. Departures from LTE will probably not significantly influence the derived mean abundance, considering the relatively small scatter for the Si i lines and since ionization balance seems to be essentially fulfilled; some caution in this matter should still be exercised however, since only two Si ii lines enter the analysis. Additional Si ii lines would certainly be very helpful in securing the results further.

4 The photospheric and meteoritic abundance scales
A re-analysis of the solar photospheric Si abundance using 3D, time-dependent, inhomogeneous model atmospheres have revealed only a difference of 0.04 dex (10%) with previously published estimates. As described in Sect. 1 this also suggests that the meteoritic abundances remain largely unaltered compared with the commonly adopted values (Grevesse & Sauval 1998). If only Si is used to place the meteoritic and photospheric abundances on a common scale, the meteoritic Fe abundance for example will be log (an additional 0.01 dex decrease may come from the existing difference in adopted meteoritic and photospheric Si abundances, Grevesse & Sauval 1998). It should be noted though that several other elements are often utilized as well (Na, Mg, Si, Ca, V, Cr, Co, Ni, Y, Zr, Nb and Mo, Anders & Grevesse 1989) for the purpose and it is not clear whether all these elements will behave similarly to Si when changing from the Holweger-Müller (1974) model atmosphere to the 3D solar convection simulations forming the basis of this work. However, given the similarity in this respect between Si and Fe (Paper II) it seems reasonable that all meteoritic abundances indeed need to be adjusted downwards by about 0.04 dex.
The difference between the meteoritic Fe abundance arrived at here and the recently determined photospheric abundance (Paper II) is only 0.02 dex for Fe i (log) and 0.01 dex for Fe ii (log) lines, when solely relying on the Si results presented here for the absolute scale for the meteoritic abundances. It is worthwhile to keep in mind, however, that the photospheric Fe results using 3D model atmospheres are based on the assumption of LTE. For some 1D model atmospheres there are indications that low-excitation Fe i lines may be influenced by departures from LTE at the level of dex (Solanki & Steenbock 1988; Shchukina 2000, private communication), which would, if assumed to be valid also in the 3D case, degrade the agreement between the 3D LTE results for Fe i and Fe ii (Paper II). However, until detailed 3D NLTE calculations have been performed such a conclusion appears to be premature since the NLTE results are sensitive to the adopted model atmosphere. Rather the consistency between the meteoritic value and the abundances derived from both weak and strong Fe i and Fe ii lines and the absence of any trend in abundances with excitation potential may be interpreted as NLTE effects being insignificant; in any case the Fe ii results should be robust against departures from LTE (Solanki & Steenbock 1988; Shchukina 2000, private communication).
The difference between the here estimated meteoritic and photospheric Fe abundances is slightly smaller than the value of 0.04 dex (10%) expected due to diffusion and gravitational settling (e.g. Vauclair 1998), similarly to the situation for He which has been uncovered by helioseismology (e.g. Basu 1998). However, the absolute transition probabilities for Fe and Si are unfortunately still not of sufficient accuracy to definitely reveal such a small effect, even though the atmospheric modelling now has answered the challenge. Furthermore, and more importantly, the absolute abundances in meteorites have been obtained by enforcing the average differences between the photospheric and meteoritic abundances for some 10 metals to vanish. It is therefore not surprising that the average difference in abundances for the 59 elements (excluding e.g. Li, Be, B, which may have been depleted) is dex (Grevesse & Sauval 1998). Thus, in order to observationally prove elemental migration for the Sun through spectroscopy, differential diffusion effects must be identified, which are expected to be significantly less than the overall depletion of metals by about 10%.
Acknowledgements.
Nicolas Grevesse is thanked for helpful discussions regarding solar and meteoritic abundances. The author is greatly indebted to Paul Barklem for computing quantum mechanical broadening data specifically for the Si lines. Discussions with Natalia Shchukina regarding departures from LTE for Fe are much appreciated, as are the constructive suggestions by an anonymous referee.. The VALD database has been providing an abundance of useful data, which is gratefully acknowledged by the author.References
- (1) Anders E., Grevesse N., 1989, Geochim. Cosmochim. Acta 53, 197
- (2) Anstee S.D., O’Mara B.J., 1995, MNRAS 276, 859
- (3) Anstee S.D., O’Mara B.J., 1991, MNRAS 235, 549
- (4) Asplund M., Nordlund Å., Trampedach R., Allende Prieto C., Stein R.F., 2000a, A&A, in press (Paper I)
- (5) Asplund M., Nordlund Å., Trampedach R., Stein R.F., 2000b, A&A, in press (Paper II)
- (6) Barklem P.S., O’Mara B.J., 1997, MNRAS 290, 102
- (7) Barklem P.S., O’Mara B.J., Ross J.E., 1998, MNRAS 296, 1057
- (8) Basu S., 1998, MNRAS 298, 719
- (9) Becker U., Zimmermann P., Holweger H., 1980, Geochim. Cosmoch. Acta 44, 2145
- (10) Brault J., Neckel H., 1987, Spectral atlas of solar absolute disk-averaged and disk-center intensity from 3290 to 12510 Å, available at ftp.hs.uni-hamburg.de/pub/outgoing/FTS-atlas
- (11) Garz T., 1973, A&A 26, 471
- (12) Grevesse N., Sauval A.J., 1998, in: Solar composition and its evolution – from core to corona, Frölich C., Huber M.C.E., Solanki S.K., von Steiger R. (eds). Kluwer, Dordrecht, p. 161
- (13) Holweger H., 1973, A&A 26, 275
- (14) Holweger H., Müller E.A., 1974, Solar Physics 39, 19
- (15) Kupka F., Piskunov N.E., Ryabchikova T.A., et al., 1999, A&AS 138, 119
- (16) Lambert D.L., Luck R.E., 1978, MNRAS 183, 79
- (17) Neckel H., 1999, Solar Physics 184, 421
- (18) Nissen P.E., Asplund M., Hill V., D’Odorico S., 2000, A&A, in press
- (19) Rosenthal C.S., Christensen-Dalsgaard J., Nordlund Å., Stein R.F., Trampedach R., 1999, A&A 351, 689
- (20) Smith P.L., Huber M.C.E., Tozzi G.P., et al., 1987, ApJ 322, 573
- (21) Solanki S.K., Steenbock W., 1988, A&A 189, 243
- (22) Stein R.F., Nordlund Å., 1989, ApJ 342, L95
- (23) Stein R.F., Nordlund Å., 1998, ApJ 499, 914
- (24) Unsöld A., 1955, Physik der Sternatmosphären, 2nd ed., Springer, Heidelberg
- (25) Vauclair S., 1998, SSRv 84, 265