The infrared counterpart of the Z source GX 5–1
Abstract
We have obtained UKIRT infrared observations of the field of the bright Galactic Z source GX 5–1. From an astrometric plate solution tied to Tycho-ACT standards we have obtained accurate positions for the stars in our field which, combined with an accurate radio position, have allowed us to identify the probable infrared counterpart of GX 5–1. Narrow–band photometry marginally suggests excess Br emission in the counterpart, supporting its association with an accretion–disc source. No significant variability is observed in a limited number of observations. We compare the H and K magnitudes with those of other Z sources, and briefly discuss possible sources of infrared emission in these systems.
keywords:
binaries: close – stars : individual : GX 5–1 – infrared : stars1 Introduction
GX 5–1 is the second brightest persistent Galactic X-ray source. The source is well studied in X-rays; it was classified as a Z source on the basis of the pattern it traces in a colour-colour diagram and its timing properties (Hasinger & van der Klis 1989). Quasi-periodic oscillations with frequencies of 13–50 Hz, 6 Hz, and 200–800 Hz were detected in the X-ray lightcurves (van der Klis 1985a,b; Lewin et al. 1992; Wijnands et al. 1999, respectively). Naylor, Charles, & Longmore (1991) identified several candidate infrared counterparts of GX 5–1. Since it is located near the Galactic centre, source confusion and heavy optical obscuration hinder the classification.
GX 5–1 is also a radio source (Braes, Miley, & Schoenmaker 1972; Grindley & Seaquist 1986; Penninx et al. 1988; Berendsen et al. 2000), like all Z sources (Hjellming & Han 1995; Fender & Hendry 2000). The radio emission is likely to arise in a compact jet from the system. The radio counterpart allows for extremely accurate position measurements.
Study of the Z sources has been hampered in most cases by the lack of reliable optical and/or infrared counterparts. For example, Deutsch et al. (1999) showed that the proposed infrared counterpart (Tarenghi & Reina 1972) of another persistently X-ray bright Z source, GX 17+2 was not consistent with the position of its radio counterpart. Furthermore, they detected a faint star close to the proposed counterpart. Callanan, Fillipenko, & Garcia (1999) reported variability of about 3.5-4 mag in the K band for the latter, providing additional evidence for its classification as the counterpart.
In this Letter, we present United Kingdom Infrared Telescope (UKIRT) infrared (IR) observations of the X-ray source GX 5–1. We resolve the previously reported counterparts, and show that the radio position is consistent with only one of them.
2 Observations, analysis and results
We observed the field of GX 5–1 with UKIRT. Observations were taken in H, K, and in a narrow filter around the Brackett Gamma line (Br) in 1999 May and October. A log of the observations can be found in Table 1. The observations of 1999, May 23 were obtained using the IRCAM3 camera; the frames consist of 256 256 pixels with a pixel size of 0.286 arc seconds. The observations of 1999, October 8 and 13 were performed using the UFTI camera; the UFTI frames consist of 1024 1024 pixels, with a pixel size of 0.0909 arc seconds. The Br narrow filter is centred on the wavelength of the Br line (2.166 micron; 50% of the light was obtained in the wavelength range 2.151–2.171 m in case of IRCAM3 observations, and in the range 2.155–2.177 m in case of UFTI observations). The night was photometric only during the 1999, May 23 observations. The exposure time used in the Br filter was 100 seconds, and in the H and K filter band a 10 second exposure was used. On 1999, October 13 an observation time of 100 seconds was used in the K band.
| Date (1999) | MJD | Filter | No. of exposures |
|---|---|---|---|
| May 23 | 51321 | K, H, Br | 5, 5, 10 |
| Oct 8 | 51459 | Br | 9 |
| Oct 13 | 51464 | K | 6 |
2.1 Photometry
All images were dark subtracted. Five (or three in case of the 1999, October 13 observations) dithered IR frames were used to calculate a sky image. This dark subtracted sky image was subtracted from the dark subtracted image after scaling it to the object image level. The resulting images were flatfielded, where the flatfield image was obtained by normalizing the combined five (or three) dithered images. The reduced images were aligned and combined.
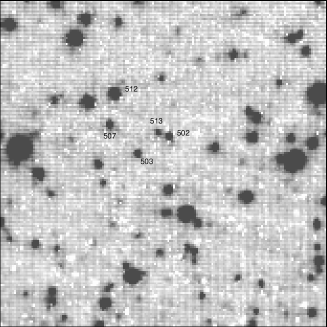
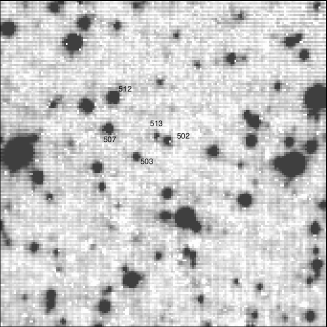
In Fig. 1, we show the observed field in both the K and H filter bands. Clearly visible is that objects 502 and 513, which were blended in the images of Naylor et al. (1991), are resolved into two separate stars.
We used three reference stars in the field (503, 507, 512 in the images of Naylor et al. 1991, see Fig. 1) to obtain differential magnitudes of the counterpart. These stars were calibrated by observing the standard star HD 161903 on 1999, May 23. To obtain the differential magnitudes, we used the point spread fitting (psf) routine to both the reference and object stars using the DoPHOT package (Schechter, Mateo, & Saha 1993). The magnitudes derived in this way did not differ significantly from the magnitudes derived using aperture photometry. We corrected the magnitudes for the airmass dependent atmospheric extinction in the H and K band. The magnitudes we derived in the H and K bands are listed in Table 2. We seached for variability on timescales of minutes and in between the observations, but no significant variability was observed in any of the stars listed in Table 2. We determined an upper limit on photometric variability on timescales of minutes of 0.6 magnitudes in the H and K band. In Table 2 we also list the flux densities obtained in the H and K filter bands, as well as the Br–K instrumental magnitude difference. No standard magnitude in the Br filter is known for the star HD 161903, therefore we could only calculate instrumental magnitudes in this band.
Accretion disks are known to sometimes produce Br emission lines (eg. Bandyopadhyay et al. 1997;1999). Therefore, if a strong Br emission line is present in the accretion disk of GX 5–1 the counterpart could appear brighter in this filter. We compared the instrumental Br–K colour of the stars 502, 513, and our reference stars (503, 507, and 512); these are also listed in Table 2. Star 513 seems to have a smaller instrumental Br–K colour, although the effect is only marginally detected. We also checked for variability in the Br band, but no significant variability was found on timescales of minutes with an upper limit of 0.45 magnitude.
| Stars | H magnitude | Flux density H (mJy) | K magnitude | Flux density K (mJy) | H–K | Br–K |
|---|---|---|---|---|---|---|
| 502 | 4.9 | 6.0 | 0.7 | |||
| 503 | 4.1 | 4.5 | 0.6 | |||
| 507 | 11.0 | 7.1 | 0.0 | |||
| 512 | 21.3 | 20.2 | 0.42 | |||
| 513 | 2.3 | 2.2 | 0.4 |
2.2 Astrometry
We used the higher resolution UFTI images obtained on 1999, October 8 for our astrometry. To define astrometric solutions for the IR frames we used secondary astrometric standards derived from United Kingdom Schmidt photographic plate material measured using the precision microdensitometer SuperCOSMOS (eg. Hambly et al. 1998). The global astrometric solution for the Schmidt plate was derived using the Tycho–ACT reference catalogue (Urban, Corbin, & Wycoff 1998), and includes correction for non-linear systematic effects caused by the mechanical deformation of the plates during exposure (eg. Irwin et al. 1998). We used the ”short red” survey plate R5803 (epoch 1979.5, field number 521). These short exposures, taken at low galactic latitudes, are far less crowded than the sky limited survey plates and reach R20 (as opposed to R for the deep survey plates). They are ideal for accurate astrometry of secondary standards as faint as R=20 which overlaps with unsaturated objects on the IR frames. The rms residual per ACT star in the global astrometric photographic plate solution was arcsec in both coordinates. A solid–body linear plate solution (ie. 4–coefficient) was derived between 7 stars in common between the photographic and IR data, yielding a plate scale of 0.0903 arcsec/pix and rms errors per secondary standard of arcsec in either coordinate. We estimate that there will be no systematic zero–point errors in the global IR array astrometric solution larger than arcsec.
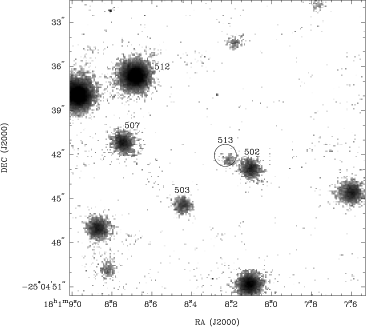
Since the uncertainty in the radio position is small (40 mas, Berendsen et al. 2000) compared to the estimated uncertainty in the astrometric solution, the overall uncertainty in the radio–infrared alignment was estimated to be 0.25 arcsec. The coordinates of the stars 502 and 513 are listed in Table 3. Comparing these positions with the accurate radio position of GX 5–1 given by Berendsen et al. (2000), we conclude that of the detected stars, star 513 is the only plausible counterpart of GX 5–1 (see Fig. 2).
| Stars | RA | DEC | d | |
| 502 | 18:01:08.109 | -25:04:43.02 | 0.25” | ” |
| 513 | 18:01:08.222 | -25:04:42.46 | 0.25” | ” |
| Radio | 18:01:08:233 | -25:04:42.044 | 0.04” |
| Stars | K band | D (kpc)1 | ()1 | (hr) | Companion Type | |
| Sco X–1 | 11.9 2 | 2.8 | 2.9 | -0.5 | 18.99 | G5 III7 () |
| GX 17+2 | 14.5 3 | 7.5 | 17.3 | -1.1 | – | – |
| 18.5 | +2.9 | |||||
| Cyg X–2 | 13.8 2 | 8.0 | 2.8 | -0.9 | 236.28 | A9 III8() |
| GX 5–1 | 13.7 | 9.0 | 25.4 | -2.8 | – | – |
| GX 340+0 | 17.3 4 | 11.0 | 50 | -1.0 | – | – |
| GX 349+2 | 14 5 | 5.0 | 8.8 | 0.0 | 225,10 or 14 d11 | – |
| GX 13+1 | 12 6 | 7.0 | 25.4 | -3.8 | – | K5 III7() |
1. Christian & Swank (1997), Sco X–1 from Bradshaw et al. (1999); 2. Priv. comm. T. Shabhaz; 3. Callanan et al. (1999), magnitude when flaring; 4. Miller et al. (1993); 5. Wachter & Margon (1996); 6. Charles & Naylor (1992); 7. Bandyopadhyay et al. (1999); 8. Casares et al. (1998); 9. Gottlieb et al. (1975); 10. Barziv et al. (1997); 11. Southwell et al. (1996)
3 Discussion
We have shown that star 513 of Naylor et al. (1991) is most likely the IR counterpart of the low-mass X-ray binary (LMXB) GX 5–1, since its position coincides with the accurate position of the radio counterpart. Furthermore, the Br–K instrumental colour is smaller for star 513, when compared to the reference stars in the field. This effect, although only marginally detected might be caused by the presence of a Br emission line in the spectrum of star 513. The presence of an absorption line could result in a higher Br–K colour, which might explain the higher value obtained for star 507.
The H and K magnitudes we derived are significantly lower than the H and K magnitudes derived by Naylor et al. (1991), but as they mention in their paper they estimate systematic errors to play a role (although these errors were estimated to be smaller than the discrepancy with our results). Bandyopadhyay et al. (1999) obtained IR spectra of the stars 502 and 503. Since they did not find evidence for emission typical of an accretion disk in these two stars, they suggested that star 513 might be the counterpart of GX 5–1.
The counterpart (star 513) did not vary significantly in any of the three filters (H, K, and Br) we used. Its reddening uncorrected H–K colour index is 0.4. Using the conversion of (Predehl & Schmitt 1995) and the estimate of for GX 5–1 of (Christian & Swank 1997; see Table 4) we obtain . Using the relations found by Rieke & Lebofsky (1985) we obtained an intrinsic . This is bluer than stellar (Tokunaga 2000), which may indicate an overestimate of the extinction. Limiting the intrinsic emission in the near-infrared to be no steeper than the Rayleigh-Jeans tail of a black-body implies .
In Table 4 we compare the K-band absolute magnitudes of the six Z sources plus the ‘hybrid Z/atoll’ source GX 13+1, based on the estimated distance and to each source. There is a rather large range, from as bright as for GX 13+1 to possibly as faint as for GX 17+2 if the observed K magnitude in quiescence is as faint as (Callanan et al. 1999). Uncertainties in distance estimates and reddening are likely to be significant at a level of about magnitude, and so cannot account for the broad range. Several different components may contribute significantly to the emission in the near–infrared; as a guide to their significance (see below) we have also listed binary orbital periods and, where available, the spectral types of the mass donors in Table 4. Thermal emission will be produced both by the stellar companion and the accretion disc (for a discussion of their relative contributions see also Bandyopadhyay et al. 1997; 1999). We may expect the accretion-disc contribution to depend on the size of the disc (van Paradijs & McClintock 1994), which in turn should be a function of the orbital period of the system. We note that for the three systems with some attempt at spectral classification of the mass donor there is a good agreement between the absolute K band magnitudes derived and those expected for the companion spectral class. This implies that GX 5–1 should contain a relatively bright mass donor. Luminosity class III was found for the companion star in Sco X–1 and Cyg X–2 (see Table 4, and references therein). Following the conjecture made by Hasinger & van der Klis (1989) that all Z sources have evolved companions, we assume also luminosity class III for GX 5–1. The companion star in GX 5–1 is then most likely of spectral type K.
There may also be an additional contribution from infrared synchrotron emission, as found in the black hole system GRS 1915+105 (Fender & Pooley 1998 and references therein). If at all, this should only occur when the source is radio–bright. The Z sources are brightest at radio wavelengths when they are observed on the Horizontal Branch (HB) in the X-ray colour-colour diagram (Penninx et al. 1988; Hjellming & Han 1995). Radio flaring in Z sources typically has amplitudes of a few mJy (Hjellming & Han 1995 and references therein); if the synchrotron emission has a flat spectrum to the near-infrared we might observe a (reddened) contribution of mJy at times. For GX 5–1 this could cause up to 1 magnitude variability.
If star 513 is not the counterpart of GX 5–1, the counterpart must have been 2.5 magnitudes fainter in the K band at the time of our observations. Future spectroscopic observations and/or the detection of variability should confirm star 513 as the counterpart.
To conclude, we have most likely identified the IR counterpart of the bright Z-type X-ray source GX 5–1 based upon positional coincidence with the radio counterpart, an identification which is supported by marginal evidence for excess Br emission. We have discussed the possible origins of IR emission in this system and in the other Z sources (and GX 13+1), and suggest that GX 5–1 may contain a KIII mass donor.
Acknowledgments
The UKIRT is operated by the Joint Astronomy Centre on behalf of the U.K. Particle Physics and Astronomy Research Council. The data reported here were obtained as part of the UKIRT Service Programme. We would like to thank Sandy Leggett for the May 23 observations and helpful comments in reducing the observations, John Davies for the October observations, Paul Vreeswijk for help with the reduction of the images, Tim Naylor for providing us with electronic versions of the images presented in Naylor et al. (1991) facilitating comparisons, and the referee, Phil Charles for his comments which improved the paper.
References
- [Bandyopadhyay et al. 1997] Bandyopadhyay R., Shabhaz T., Charles P.A., van Kerkwijk M.H.,& Naylor T., 1997, MNRAS, 285, 718
- [Bandyopadhyay et al. 1999] Bandyopadhyay R., Shabhaz T., Charles P.A.,& Naylor T., 1999, MNRAS, 306, 417
- [Barziv et al. 1997] Barziv O., Kuulkers E., Méndez M., van der Hooft F., Groot P.J., van der Klis M., Kemper C., & van Paradijs J., 1997, A&A, 325, 1035
- [Berendsen et al. 2000] Berendsen S.G.H., Fender R., Kuulkers E., Heise J., van der Klis M., 2000, MNRAS, in press
- [Bradshaw et al. 1999] Bradshaw C.F., Fomalont E.B., & Geldzahler B.J., 1999, ApJ, 512, L121
- [Braes, et al. 1972] Braes L.L.E., Miley G.K., & Schoenmaker A.A., 1972, Nature, 236, 392
- [Callanan et al. 1999] Callanan P.J., Fillipenko A.V., & Garcia M.R., 1999 IAU Circ. 7219
- [Casares, Charles, & Kuulkers (1998)] Casaras J., Charles P., & Kuulkers E., 1998, ApJ, 493, L39
- [Charles & Naylor 1992] Charles P.A., Naylor T., 1992, MNRAS, 255, 6
- [Christian & Swank 1997] Christian D.J., & Swank J.H., 1997, ApJ, 109, 177
- [Deutsch et al. 1999] Deutsch E.W., Margon B., Anderson S.F., Wachter S., & Goss W.M., 1999, ApJ, 524, 406
- [] Fender R.P., Pooley G.G., 1998, MNRAS, 300, 574
- [Fender & Hendry 2000] Fender R.P., Hendry M.A., 2000, MNRAS, in press
- [Gottlieb et al. 1975] Gottlieb E.W., Wright E.L., & Liller W., 1975, ApJ, 195, L33
- [Grindley & Seaquist 1986] Grindley J.E., & Seaquist E.R., 1986, ApJ, 310, 172
- [Hambly et al. 1998] Hambly N.C., Miller L., MacGillivray H.T., Herd J.T., & Cormack W.A., 1998, MNRAS, 298, 897
- [Hasinger & van der Klis (1989)] Hasinger, G., & van der Klis, M. 1989, A&A, 225, 79
- [Hjellming & Han 1995] Hjellming R.M., Han X., 1995 pag. 308 in X-Ray Binaries, ed. W.H.G. Lewin, J. van Paradijs, & E.P.J. van der Heuvel (Cambridge: Cambridge Univ. Press)
- [Irwin et al. 1998] Irwin M.J., Hawkins M.R.S., Hambly N.C., & MacGillivray H.T., 1998, Anglo–Australian Observatory Newsletter No.85 (April 1998), 14
- [Lewin & van Paradijs 1985] Lewin W.H.G., van Paradijs J., 1985, A&A, 149, L27
- [Lewin et al. 1992] Lewin W.H.G., Lubin L.M., Tan J., van der Klis M., van Paradijs J., Penninx W., Dotani T., & Mitsuda K., 1992, MNRAS, 256, 545
- [Miller et al. 1993] Miller B.W., Margon B., Burton M.G., 1993, ApJ, 106, 28
- [Naylor et al. 1991] Naylor T., Charles P.A., & Longmore A.J., 1991, MNRAS, 252, 203
- [Penninx et al. 1988] Penninx W., Lewin W.H.G., Zijlstra A.A., Mitsuda K., van Paradijs J., & van der Klis M., 1988, Nature, 336,146
- [Predehl & Schmitt 1995] Predehl P., & Schmitt J.H.M.M., 1995, A&A, 293, 889
- [Schechter, Mateo, & Saha 1993] Schechter P.L., Mateo M., Saha A., 1993, PASP, 105, 1342
- [Southwell et al.] Southwell K.A., Casares J., Charles P.A., 1996, in: Cataclysmic Variables and Related Objects, IAU Coll. 158, A. Evans & J.H. Wood (eds.), Kluwer Academic Publishers, p. 365
- [Tarenghi & Reina 1972] Tarenghi M., & Reina C., 1972, Nature Phys. Sci. 240, 53
- [Tokunaga A.T. 2000] Tokunaga A.T., 2000, in Astrophysical Quantities, ed. A. Cox, Springer Verlag
- [Urban, Corbin, & Wycoff 1998] Urban S.E., Corbin T.E., Wycoff G.L., 1998, AJ, 115, 2161
- [van Paradijs & McClintock 1994] van Paradijs J., McClintock J.E., 1994, A&A, 290, 133
- [van der Klis et al. 1985a] van der Klis M., Jansen F., van Paradijs J., Lewin W.H.G., Trümper J., Sztjano M., 1985a, IAU Circ. 4140
- [van der Klis et al. 1985b] van der Klis M., Jansen F., van Paradijs J., Lewin W.H.G., van den Heuvel E.P.J., Trümper J.E., Sztjano M., 1985b, Nature 316, 225
- [van der Klis 1995] van der Klis, M, 1995 pag. 252 in X-Ray Binaries, ed. W.H.G. Lewin, J. van Paradijs, & E.P.J. van der Heuvel (Cambridge: Cambridge Univ. Press)
- [van der Klis 1998] van der Klis M., in Proc., NATO Advanced Study Institute, The Many faces of Neutron Stars ed. R., Buccheri, J., van Paradijs, & M.A. Alpar (Kluwer Academic Publishers), 1998, Vol. 515, 337–368
- [Wachter & Margon 1996] Wachter S., Margon B., 1996, AJ, 112, 6
- [Wijnands et al. 1999] Wijnands R., Méndez M., van der Klis M., Psaltis D., Kuulkers E., Lamb F.K., 1999, ApJ, 504, L35