Multiwavelength study of the nuclei of a volume-limited sample of galaxies I: X-ray observations
Abstract
We discuss ROSAT HRI X-ray observations of 33 very nearby galaxies, sensitive to X-ray sources down to a luminosity of approximately erg s-1. The galaxies are selected from a complete, volume limited sample of 46 galaxies with Mpc for which we have extensive multi-wavelength data. For an almost complete sub-sample with (29/31 objects) we have HRI images. Contour maps and source lists are presented within the central region of each galaxy, together with nuclear upper limits where no nuclear source was detected. Nuclear X-ray sources are found to be very common, occurring in of the sample. Nuclear X-ray luminosity is statistically connected to host galaxy luminosity - there is not a tight correlation, but the probability of a nuclear source being detected increases strongly with galaxy luminosity and the distribution of nuclear luminosities seems to show an upper envelope that is roughly proportional to galaxy luminosity. While these sources do seem to be a genuinely nuclear phenomenon rather than nuclear examples of the general X-ray source population, it is far from obvious that they are miniature Seyfert nuclei. The more luminous nuclei are very often spatially extended, and HII region nuclei are detected just as often as LINERs. Finally, we also note the presence of fairly common super-luminous X-ray sources in the off-nuclear population – out of 29 galaxies we find 9 sources with a luminosity larger than 1039 erg s-1. These show no particular preference for more luminous galaxies. One is already known to be a multiple SNR system, but most have no obvious optical counterpart and their nature remains a mystery.
keywords:
galaxies: general – galaxies: active – galaxies: nuclei – X-rays: galaxies.1 Introduction
Evidence has been growing that both (i) weak nuclear activity, and (ii) the presence of quiescent black holes, are common features of normal galaxies. The best evidence to date for (i) comes from the very thorough high S/N spectroscopic survey of 486 nearby galaxies by ?. They found that 86% of galaxies have emission lines; roughly a third have Seyfert 2 or LINER spectra, indicating but not proving some kind of weak AGN; and 10% have weak broad emission lines, so are almost certainly AGN (?). These latter objects are, however, three orders of magnitude less luminous than classic Seyfert galaxies and six orders of magnitude less luminous than the most luminous quasars. They have become known as ‘dwarf AGN’. The evidence for (ii) comes from dynamical studies. The review by ? found evidence for ‘Massive Dark Objects’ (MDOs) in 20% of galaxies, but this can be considered a lower limit because of the difficulty of rigorously demonstrating the requirement for a dark mass. With a more relaxed analysis, ? have claimed that there is strong evidence for an MDO in essentially all galaxies.
Most interestingly, ? and ? also claim a correlation between the MDO mass and the stellar bulge mass, with . Likewise, various authors have shown evidence that AGN activity correlates with galaxy size (?; ?; ?; ?; ?; ?). A weakness with all these studies is that only fairly luminous galaxies are considered. As well as investigating whether feeble AGN are present in normal galaxies, it is very important to know whether AGN occur at all in feeble galaxies. Is there a minimum galaxy size below which quasar-like nuclei are simply not present? There are two known examples of AGN in relatively small galaxies: a Seyfert 1 nucleus in NGC 4395 (?; ?) and a Seyfert 2 nucleus in G1200-2038 (?). Both these galaxies have , an order of magnitude less luminous than typical galaxies and two orders of magnitude less luminous than the giant ellipticals which dominate the ? sample. Are they rare freaks, or the tip of the iceberg? Furthermore, in the local field there are are plenty of spiral galaxies an order of magnitude less luminous still than NGC 4395 and below that we have true dwarf galaxies, dwarf irregulars, dwarf ellipticals, and dwarf spheroidals, which continue all the way down to . Where does AGN activity stop?
To address the issues of (a) how common weak AGN are, and (b) how activity is connected to host galaxy size and type, we have undertaken a multi-wavelength study of a complete volume-limited sample of 46 very nearby AGN, with (broad-band and emission line) optical, IR, X-ray and radio imaging, and long slit spectroscopy. In terms of survey size and spectroscopic quality it would be hard to improve on the ? survey. Instead, our study has several key features. (i) The multiwavelength approach gives the greatest chance of finding a weak AGN, being sensitive to a variety of signatures, and gives us diagnostic information on the nature of the objects seen. (ii) All our galaxies are closer than 7 Mpc, maximizing spatial resolution, and minimizing the detectable luminosity. (iii) The volume-limited nature (as opposed to magnitude-limited) of the sample means that we have a fairly even distribution of galaxy sizes and types, going down to extremely small galaxies. (iv) In many cases we found that the location of the true nucleus is not entirely obvious. Multi-wavelength imaging gave us a ‘shooting list’ of multiple targets for spectroscopy to ensure we did not miss the true nucleus.
This paper (Paper I) focuses on the analysis of the ROSAT HRI X-ray data for the galaxies in our sample and presents some preliminary scientific results. Section 2 describes the main characteristics of the sample. In section 3 the acquisition and analysis of the X-ray data are described. The atlas of X-ray images is found in section 4. In Section 5 we describe detailed results for individual galaxies. In section 6 we summarize and discuss some of the most interesting results and examine the correlation of X-ray luminosity and host galaxy luminosity.
In subsequent papers we will present optical-IR imaging and radio maps (Paper II), long-slit spectroscopy (Paper III), and a final analysis of results (Paper IV).
2 The volume-limited sample
| Broad Band Observations | Nuclear | ||||||||
| Galaxy | Position (2000) | Morph | D (Mpc) | Radio | Near-IR | Optical | X-ray | Spect. | |
| NGC 147 | 00 30 +48 14 | 13.71 | dE5 | 0.65 | |||||
| AND III | 00 33 +36 14 | 10.17 | dE | 0.65 | |||||
| NGC 185 | 00 36 +48 04 | 13.94 | dE3 | 0.65 | |||||
| NGC 205–M 110 | 00 38 +41 25 | 15.24 | S0/E5 | 0.65 | |||||
| NGC 221–M 32 | 00 40 +40 36 | 15.06 | E2 | 0.65 | |||||
| NGC 224–M 31 | 00 40 +40 60 | 19.69 | Sb | 0.65 | |||||
| AND I | 00 43 +37 44 | 10.17 | dE3 | 0.65 | |||||
| NGC 247 | 00 45 -21 02 | 18.32 | Sc(s) | 3.69 | |||||
| NGC 253 | 00 45 -25 34 | 20.26 | Sc(s) | 4.77 | |||||
| SCULPTOR | 00 58 -33 58 | 10.38 | dE3 | – | |||||
| NGC 404 | 01 07 +35 27 | 17.07 | S0 | 4.34 | |||||
| AND II | 01 14 +33 09 | 10.17 | dE | 0.65 | |||||
| NGC 598–M 33 | 01 31 +30 24 | 18.43 | Sc(s) | 0.87 | |||||
| MAFFEI I | 02 33 +59 26 | 13.87 | E3 | 5.43 | |||||
| FORNAX | 02 38 -34 44 | 12.64 | dE0 | 0.22 | |||||
| MAFFEI II | 02 38 +59 23 | 8.08 | Sbc | 5.21 | |||||
| IC 342 | 03 42 +67 56 | 19.50 | S(B)cd(rs) | 6.08 | |||||
| NGC 1560 | 04 27 +71 46 | 15.95 | Sd(s) | 4.34 | |||||
| NGC 2366 | 07 24 +69 19 | 17.53 | SBm | 6.29 | |||||
| NGC 2403 | 07 32 +65 43 | 20.25 | Sc(s) | 6.73 | |||||
| NGC 2976 | 09 43 +68 09 | 16.98 | Sd | 3.69 | |||||
| A 0951+68 | 09 51 +68 50 | 11.21 | dE | 1.52 | |||||
| NGC 3031–M 81 | 09 52 +69 18 | 19.22 | Sb(r) | 2.60 | |||||
| LEO I | 10 06 +12 33 | 10.87 | dE3 | 0.22 | |||||
| LEO Ba | 11 11 +22 26 | 8.98 | dE0 | 0.22 | |||||
| UGC 6456 | 11 25 +79 16 | 12.19 | peculiar | 2.39 | |||||
| NGC 3738 | 11 33 +54 48 | 16.78 | Sd | 6.08 | |||||
| NGC 4136 | 12 07 +30 12 | 17.63 | Sc(r) | 6.94 | |||||
| NGC 4144 | 12 07 +46 44 | 16.83 | Scd | 5.86 | |||||
| NGC 4150 | 12 08 +30 41 | 15.30 | S0/a | 3.47 | |||||
| NGC 4236 | 12 14 +69 45 | 17.50 | SBd | 3.26 | |||||
| NGC 4244 | 12 15 +38 05 | 17.59 | Scd | 4.34 | |||||
| UGC 7321 | 12 15 +22 49 | 14.82 | Scd | 5.43 | |||||
| NGC 4395 | 12 23 +33 50 | 17.89 | Sd | 5.21 | |||||
| NGC 4605 | 12 38 +61 53 | 17.80 | Sc(s) | 5.64 | |||||
| NGC 4736–M 94 | 12 49 +41 24 | 20.00 | RSab(s) | 6.08 | |||||
| NGC 4826 | 12 54 +21 57 | 19.39 | Sab(s) | 5.64 | |||||
| NGC 5204 | 13 28 +58 41 | 17.39 | Sd | 6.73 | |||||
| NGC 5238 | 13 33 +51 52 | 15.79 | S(B)dm | 6.73 | |||||
| NGC 5236–M 83 | 13 34 -29 37 | 20.16 | SBc(s) | 5.43 | |||||
| NGC 5457–M 101 | 14 01 +54 36 | 21.22 | Sc(s) | 7.60 | |||||
| URSA MINOR | 15 08 +67 23 | 7.40 | dE4 | – | |||||
| DRACO | 17 19 +57 58 | 7.00 | dE0 | – | |||||
| NGC 6503 | 17 50 +70 10 | 18.28 | Sc(s) | 6.94 | |||||
| NGC 6946 | 20 34 +59 59 | 19.66 | Sc(s) | 7.38 | |||||
| NGC 7793 | 23 55 -32 52 | 18.43 | Sd(s) | 4.12 | |||||
To study the occurrence of nuclear activity in galaxies to the lowest possible level, a volume-limited sample of galaxies was defined. The sample contains the nearest examples of various morphological types of galaxies, and a representative range of intrinsic luminosities (Johnson 1997; see also Paper II).
The starting point was the Kraan-Korteweg & Tamman Catalogue (?; ?) with all galaxies with V 500 km/s giving a distance-complete sample within (after applying a virgocentric flow model with an infall velocity of the Local Group equal to 220 km s-1). With Mpc, the sample is complete for nearby galaxies within 7.6 Mpc. The catalogue is not complete for intrinsically faint galaxies without velocity information, but it includes all galaxies down to . Comparing the distribution of absolute magnitudes of the galaxies in the KKT with the galaxies in the Revised Shapley Ames (magnitude-limited) catalogue (?) it is found that the RSA sample of galaxies presents a strong peak around and has less than 10% of the objects below , while the KKT sample shows a broad distribution with a maximum around and a significant number of galaxies down to magnitude .
The observations were restricted to objects with . Because the aim was to observe objects with well-formed nuclei, galaxies classified as Sdm, Sm and Irr were removed from the sample. This gave a basic sample of 46 nearby galaxies (26 spirals, 5 E/S0, 12 dwarf ellipticals and 3 blue compact dwarfs, of which two are classified as Sm spirals and one is a peculiar object). The assumed distances for the galaxies are based on the observed recession velocities and the assumed Virgo flow model.
Table 1 shows the resulting sample on which our study is based, the properties of the galaxies concerned, and a summary of the observations available to date. Note that only 34/46 galaxies have available X-ray data. However, we can define a very useful sub-sample of all those galaxies with (these are all disk systems, except for the elliptical galaxy NGC 221). Of these, 29/31 have X-ray data – only UGC 7321 and NGC 7793 are missing. In addition this paper describes observations of five further dwarf galaxies: NGC 147, NGC 185, UGC 6456, Leo B, and A 0951+68. Only one of these has a detected X-ray source. The analysis we present in section 6 is based on the almost-complete subsample with .
3 High resolution X-ray imaging
3.1 Observations
The data reported here come from pointed observations carried out with the ROSAT HRI. Table 2 shows those galaxies in the volume-limited sample with available data. Observations for 17 galaxies were awarded to this project through Announcement of Opportunity (AO) calls. For 13 objects data were retrieved from the public archives using arnie (a World Wide Web interface to the databases and catalogues supported by the Leicester Database and Archive Service, ledas). Galaxies are identified in table 2 with an ‘N’ (new data allocated to this project) or a ‘P’ (public data retrieved from the archive). Since NGC 4826 has both new and archive observations a total of 29 objects are covered. The ROSAT HRI data have been reduced and analyzed as described below.
| Galaxy | ROR Number | Observing Date | Livetime | Origin | Galaxy | ROR Number | Observing Date | Livetime | Origin |
|---|---|---|---|---|---|---|---|---|---|
| NGC 147 | 400744 | 19/01/95 | 14616.6 | P | NGC 4236 | 600763 | 01/12/94 | 7543.2 | N |
| NGC 185 | 400743 | 19/01/95 | 20881.3 | P | 600763 | 10/04/95 | 3390.6 | N | |
| NGC 205 | 600816 | 04/08/96 | 27842.5 | P | NGC 4244 | 702724 | 20/06/96 | 8630.9 | N |
| NGC 221 | 600600 | 19/07/94 | 12533.5 | P | NGC 4395 | 702725 | 23/06/96 | 11252.5 | N |
| NGC 247 | 600622 | 29/06/94 | 33701.1 | P | NGC 4605 | 702729 | 16/06/96 | 2158.4 | N |
| 600622 | 12/06/95 | 17681.8 | P | NGC 4736 | 600678 | 07/12/94 | 111870.5 | P | |
| NGC 404 | 703894 | 04/01/97 | 23562.6 | N | 600769 | 25/12/94 | 27033.8 | P | |
| IC 342 | 600022 | 13/02/91 | 18990.4 | P | NGC 4826 | 600715 | 09/07/95 | 10042.8 | P |
| NGC 1560 | 702727 | 08/03/96 | 17287.5 | N | 703900 | 12/06/97 | 9248.9 | N | |
| NGC 2366 | 702732 | 31/03/96 | 31465.5 | N | 703900 | 08/01/98 | 5342.2 | N | |
| NGC 2403 | 600767 | 18/09/95 | 26244.7 | P | NGC 5204 | 702723 | 31/12/95 | 14683.0 | N |
| NGC 2976 | 600759 | 04/10/94 | 26238.1 | P | 702723 | 02/05/96 | 13554.1 | N | |
| 600759 | 12/04/95 | 23244.3 | P | NGC 5236 | 600024 | 20/01/93 | 23316.5 | P | |
| A 0951+68 | 703895 | 29/03/97 | 14240.2 | N | 600024 | 30/07/94 | 23920.5 | P | |
| UGC 6456 | 703896 | 01/04/97 | 13027.7 | N | NGC 5238 | 702733 | 13/06/96 | 23163.1 | N |
| NGC 3738 | 703897 | 01/11/97 | 13711.2 | N | NGC 5457 | 600092 | 09/01/92 | 18452.8 | P |
| NGC 4136 | 702734 | 25/06/96 | 1951.0 | N | 600383 | 10/12/92 | 32361.1 | P | |
| NGC 4144 | 703898 | 11/11/97 | 11083.4 | N | NGC 6503 | 600618 | 08/03/94 | 14640.6 | N |
| NGC 4150 | 600762 | 25/12/94 | 3730.1 | N | NGC 6946 | 600501 | 14/05/94 | 59885.3 | P |
| 600762 | 23/05/95 | 10353.8 | N | 600718 | 13/08/95 | 21514.3 | P |
For several galaxies more than one exposure was available. This could be because several observations were requested, or because a single request was scheduled as several observations months apart. In table 2 observations of the same galaxy associated with different requests are distinguished by their ROR (ROSAT Observation Request) numbers. If a single request was scheduled in more than one observation only one ROR is given but the different observing dates distinguish between the individual observations.
3.2 Data analysis
The aim of the analysis is to extract fluxes and upper limits for all the sources within a region centered on the position of the galaxy. In this way the X-ray field matches the size of the optical frames obtained using the Jacobus Kapteyn Telescope (JKT) (Johnson 1997; Paper II). For each galaxy an isointensity contour map was overlaid onto the optical image. No attempt has been made to systematically study the temporal behavior of the sources, although some interesting individual cases will be mentioned later (section 5).
The reduction and analysis of the ROSAT HRI data was done using pros, an X-ray analysis software system designed to run under the Image Reduction and Analysis Facility (iraf).
For each galaxy with more than one exposure, the different images were coadded, merging their respective livetimes. Using the sources in the field, the images were inspected and corrected for systematic shifts in the positions before co-adding.
3.2.1 Source identification
For the identification of all point sources in the images we used the ROSAT Standard Analysis Software System (SASS) source list as a starting point. The following steps were followed to identify all source candidates in the X-ray images:
-
1.
the images were binned into 2″ pixels and smoothed using gaussians with and ; the smoothed images were inspected visually to evaluate the existence of sources not reported by SASS and to exclude obvious spurious sources;
-
2.
whenever more than one exposure was available for a target the different files were compared so that variable sources that might appear weak in the coadded image could be recognized in the individual frames where they might have been more luminous;
-
3.
optical images with X-ray isocontours were generated in order to look for weak sources with optical counterparts.
For each source candidate a background subtracted count number was obtained from the coadded imaged. An aperture of 10″ was adopted for all point sources which should encircle 99% of the photons at 0.2 keV and 86% of the photons at 1.7 keV for nearly on-axis sources (?). The pixel coordinates were obtained from the SASS report or by using a separate centroid algorithm. To estimate the background one or two large circular regions free of evident X-ray sources and away from the galaxy were used. These regions normally lay outside the central image.
A final list of sources for each galaxy was created with all sources that comply with at least one of the following criteria:
-
1.
have a signal-to-noise ratio above 2.5 in the coadded image,
-
2.
have a signal-to-noise ratio above 2.5 in at least one of the individual images,
-
3.
or have a low signal-to-noise ratio (between 1.5 and 2.5) and an optical counterpart.
For sources with an extended component an additional, larger aperture was used to estimate its contribution. The size of the aperture was determined from the radial profile of the source. For galaxies without nuclear X-ray source detections, upper limits were established using a 10″ aperture located at the best estimate of the nuclear position from our optical images. They were computed as limits (ie., 0.9772 CL) assuming Bayesian statistics (?). To find the count rates the total livetime of the coadded images was used.
| Galaxy | Size | Bremsstrahlung | Power Law | |||
|---|---|---|---|---|---|---|
| (deg2) | (cm-2) | keV | keV | |||
| NGC 147 | 0.091 | 21.02 | 24.71 | 1.21 | 2.26 | 1.42 |
| NGC 185 | 0.098 | 21.04 | 25.02 | 1.22 | 2.27 | 1.42 |
| NGC 205 | 0.148 | 20.82 | 10.87 | 1.17 | 2.07 | 1.37 |
| NGC 221 | 0.038 | 20.81 | 10.58 | 1.17 | 2.07 | 1.37 |
| NGC 247 | 0.129 | 20.17 | 1.96 | 1.01 | 1.36 | 1.14 |
| NGC 404 | 0.016 | 20.70 | 8.28 | 1.15 | 1.98 | 1.34 |
| IC 342 | 0.270 | 21.48 | 43.83 | 1.30 | 2.48 | 1.48 |
| NGC 1560 | 0.017 | 21.06 | 25.34 | 1.22 | 2.27 | 1.43 |
| NGC 2366 | 0.023 | 20.59 | 4.62 | 1.11 | 1.78 | 1.29 |
| NGC 2403 | 0.170 | 20.62 | 5.23 | 1.12 | 1.83 | 1.30 |
| NGC 2976 | 0.011 | 20.65 | 6.05 | 1.13 | 1.89 | 1.32 |
| A 0951+68 | – | 20.63 | 5.48 | 1.12 | 1.85 | 1.31 |
| UGC 6456 | 0.001 | 20.56 | 4.15 | 1.10 | 1.74 | 1.27 |
| NGC 3738 | 0.004 | 20.01 | 1.67 | 0.99 | 1.27 | 1.10 |
| NGC 4136 | 0.014 | 20.20 | 2.03 | 1.02 | 1.38 | 1.15 |
| NGC 4144 | 0.008 | 20.16 | 1.94 | 1.01 | 1.36 | 1.14 |
| NGC 4150 | 0.004 | 20.19 | 2.01 | 1.02 | 1.38 | 1.15 |
| NGC 4236 | 0.112 | 20.26 | 2.20 | 1.03 | 1.43 | 1.16 |
| NGC 4244 | 0.036 | 20.27 | 2.23 | 1.03 | 1.43 | 1.17 |
| NGC 4395 | 0.123 | 20.12 | 1.85 | 1.00 | 1.33 | 1.13 |
| NGC 4605 | 0.011 | 20.26 | 2.20 | 1.03 | 1.43 | 1.16 |
| NGC 4736 | 0.087 | 20.15 | 1.92 | 1.01 | 1.35 | 1.13 |
| NGC 4826 | 0.044 | 20.42 | 2.88 | 1.06 | 1.57 | 1.22 |
| NGC 5204 | 0.013 | 20.18 | 1.98 | 1.01 | 1.37 | 1.14 |
| NGC 5236 | 0.100 | 20.63 | 5.48 | 1.12 | 1.85 | 1.31 |
| NGC 5238 | 0.100 | 20.04 | 1.71 | 0.99 | 1.29 | 1.11 |
| NGC 5457 | 0.618 | 20.07 | 1.76 | 1.00 | 1.30 | 1.11 |
| NGC 6503 | 0.013 | 20.61 | 5.01 | 1.12 | 1.82 | 1.30 |
| NGC 6946 | 0.094 | 21.31 | 31.90 | 1.26 | 2.37 | 1.45 |
3.2.2 Astrometry checks
In order to check the absolute astrometry of the HRI observations we used bright X-ray sources in the field of view of each image and looked for optical counterparts that would signal the presence of large shifts in the astrometric solutions. However, in many cases the only bright sources available were found at large off-axis angles. Given the dependancy of the PSF with distance from the centre of the HRI optical axis (?), it is important to establish if the position of these sources could be reliably recovered.
To establish the accuracy with which the position of X-ray sources could be recovered we examined two HRI observations for which a large number of optical couterparts for the X-ray sources has been found: one of the Lockman Hole observations (ROR 701867) and one of the ROSAT Deep Surveys centered in the direction and (ROR 900717). The optical identifications of the X-ray sources were obtained from ? and ?.
We used a total of 12 sources from the Lockman Hole and the ROSAT Deep Survey image, with off-axis angles ranging from 4 to 14.5 arcmin, and count numbers ranging from hundred to a few thounsands. It was found that the position of the X-ray sources could be recovered with an accuracy better than 5 arcsec (average of 2.8 arcsec) regardless of the count numbers and off-axis angle of the source. Therefore, by using optical identifications (IDs) of the X-ray sources found in the field of view of our HRI observations, it should be possible to detect shifts in the astrometric solutions larger than 5 arcsec.
We checked the astrometry of our HRI observations for all those images that showed X-ray sources that could be associated with the galaxies. To look for optical counterparts large DSS images were used and inspected carefully to identify as many candidate IDs as possible. The celestial positions for the IDs were obtained usign a centroid algorithm and compared with the positions of the X-ray sources. The results can be grouped into two categories as follows: fields for which at least two secure optical IDs were found (NGC 247, NGC 2976, NGC 5457, NGC 6503, NGC 6946, UGC 6456); fields for which only one secure ID was found (IC 342, NGC 221, NGC 404, NGC 2403, NGC 4136, NGC 4150, NGC 4236, NGC 4395, NGC 4736, NGC 4826, NGC 5204, NGC 5236).
The analysis showed that most astrometric solutions were accurate to within 5 arcsec. Exceptions were NGC 2976, for which the observation obtained on the 12/04/1995 presented a shift of arcsec, NGC 4236 for which both observations presented a significant shift (notice however, that this result is based on only one optical ID), and NGC 6946 – ROR 600718, which was corrected by a shift arcsec.
3.2.3 X-ray fluxes and luminosities
The conversion of the HRI count rates to fluxes was done assuming a Bremsstrahlung spectrum with keV, an energy range 0.1–2.4 keV, and a Galactic line of sight absorption derived from the 21 cm line of atomic hydrogen (?), listed in table 3. This choice of parameters is justified by typical galactic soft X-ray spectral properties (?). Fluxes were converted to luminosities assuming the distances in table 1. Fluxes and luminosities inferred from a Bremsstrahlung spectrum with or 0.1 keV, or a power law model with index or 1.5, can be calculated using the conversion factors in table 3 for each galaxy.
3.3 Contour maps
Isointensity contour maps were produced for all the coadded images. All the files were binned into pixels and then smoothed using a gaussian with . The binning and gaussian sizes were chosen so that the representation of the sources was consistent with the statistical asssesment of their strength. Contours were drawn at times the standard deviation in the smoothed background, where , and so on. With this selection of contour intensities bright sources do not present contour crowding. For each map, the background fluctuation was calculated for the same region used earlier (when measuring source fluxes in the raw data).
4 The atlas
| Galaxy | Source | S/N | Corrected Flux | Luminosity | Comments |
| (ergs s-1 cm-2) | (ergs s-1) | ||||
| NGC 205 | X1 | 3.82 | Probably not associated with NGC 205 | ||
| NGC 221 | X1 | 10.60 | |||
| NGC 247 | X1 | 22.39 | |||
| X2 | 5.99 | ||||
| NGC 404 | X1 | 3.34 | Nuclear | ||
| IC 342a | X1 | 2.31 | Low S/N (see text); source 6 in BCT | ||
| X2 | 9.27 | Nuclear; marginally extended; source 8 in BCT | |||
| X3 | 6.48 | Possible optical counterpart; source 9 in BCT | |||
| NGC 2403 | X1 | 15.19 | |||
| X2 | 2.92 | ||||
| X3 | 7.88 | Possible very faint optical counterpart | |||
| X4 | 2.08 | Low S/N; giant HII region (?) | |||
| NGC 2976 | X1 | 8.75 | |||
| A 0951+68 | X1 | 4.79 | Probably not associated with A 0951+68 | ||
| UGC 6456 | X1 | 13.85 | |||
| NGC 3738 | X1 | 4.74 | Probably not associated with NGC 3738 | ||
| X2 | 2.46 | Probably not associated with NGC 3738 | |||
| NGC 4136 | X1 | 2.15 | Diffuse blue optical counterpart | ||
| NGC 4144 | X1 | 3.09 | |||
| NGC 4150 | X1 | 15.84 | Background quasar (); see section 5; | ||
| flux obtained assuming a power law spectrum | |||||
| with | |||||
| NGC 4236 | X1 | 2.61 | |||
| NGC 4395 | X1 | 1.67 | Nuclear; low S/N; flux obtained assuming a | ||
| power law spectrum with ; see chapter 4 | |||||
| X2 | 11.85 | ||||
| NGC 4736 | X1 | 5.78 | |||
| X2 | 18.78 | ||||
| X3 | 65.32 | Nuclear | |||
| X3 | 84.49 | Total nuclear emission (r = 100″) | |||
| NGC 4826 | X1 | 9.58 | Nuclear | ||
| X1 | 13.03 | Total nuclear emission (r = 40″) | |||
| X2 | 2.27 | Probably not associated with NGC 4826 | |||
| NGC 5204 | X1 | 25.23 | Faint optical counterpart | ||
| NGC 5236 | X1 | 4.46 | Variable | ||
| X2 | 6.07 | ||||
| X3 | 26.69 | Nuclear | |||
| X3 | 38.48 | Total nuclear emission (r = 100″) | |||
| X4 | 5.09 | ||||
| X5 | 3.78 | ||||
| X6 | 8.60 | ||||
| X7 | 5.01 | Variable | |||
| X8 | 4.13 | Variable | |||
| NGC 5457 | X1 | 4.13 | Nuclear | ||
| X2 | 3.52 | ||||
| X3 | 4.80 | ||||
| X4 | 3.31 |
ROSAT HRI fluxes and luminosities. : Re-analysis of the observations reported by ?-BCT. Galaxy Source S/N Corrected Flux Luminosity Comments (ergs s-1 cm-2) (ergs s-1) NGC 6503 X1 3.01 X2 2.51 Probably off-nuclear X2 3.47 Total emission (r = 30″) NGC 6946 X1 11.85 X2 2.67 X3 10.73 Nuclear X3 12.80 Total nuclear emission (r = 50″) X4 4.37 X5 3.06 X6 5.48 X7 13.25 X8 32.22 Known SNR (see text); faint red optical counterpart X9 5.13
In this section we present an atlas of X-ray images, and tabulate all X-ray sources found satisfying the conditions described in the previous section, for the 29 galaxies with ROSAT HRI data found in table 2.
The atlas consists of maps of isointensity contour levels overlaid on optical images. The size of the images is centered on the position of the galaxy. Whenever an optical JKT image was not available, a Digital Sky Survey plate was used. The atlas is ordered by increasing values of right ascension.
All detected X-ray point sources fluxes are given in table 5. The sources are ordered by increasing values of right ascension. For each source in table 5 successive columns list the measured signal to noise ratio, the flux corrected for Galactic absorption in the 0.1–2.4 keV band, and the luminosity found assuming the distances shown in table 1. Comments on particular sources are given in the last column (nuclear sources are also noted in this way). When there is evidence of an extended component, the source is listed twice: the flux measured in a 10″ radius aperture is followed by the total flux observed in a larger aperture (the radius of the second aperture is given in the comments).
Upper limits () were obtained for galaxies without detected nuclear sources using a 10″ aperture located at the nuclear positions and can be found in table 6.
In addition to the galaxies listed in table 2 the results for four galaxies with comprehensive studies of their X-ray emission from HRI observations have been obtained directly from the literature. Luminosities for the detected point sources in these galaxies (and located within a region centered on the nuclei) are shown in table 7. These values will be used during the analysis in chapter 6.
| Galaxy | Corrected Upper Limit | Log luminosity |
|---|---|---|
| (ergs s-1 cm-2) | (ergs s-1) | |
| NGC 147 | 36.49 | |
| NGC 185 | 36.43 | |
| NGC 205 | 36.54 | |
| NGC 221 | 36.45 | |
| NGC 247 | 37.59 | |
| NGC 1560 | 38.13 | |
| NGC 2366 | 38.14 | |
| NGC 2403 | 38.41 | |
| NGC 2976 | 37.87 | |
| A 0951+68 | 36.96 | |
| UGC 6456 | 37.60 | |
| NGC 3738 | 38.36 | |
| NGC 4136 | 39.09 | |
| NGC 4144 | 38.39 | |
| NGC 4150 | 38.34 | |
| NGC 4236 | 37.98 | |
| NGC 4244 | 38.33 | |
| NGC 4605 | 39.15 | |
| NGC 5204 | 38.39 | |
| NGC 5238 | 38.27 | |
| NGC 6503 | 38.48 |
| NGC 2241 | NGC 2532 | NGC 5983 | NGC 30314 | ||||
|---|---|---|---|---|---|---|---|
| source | log L | source | log L | source | log L | source | log L |
| 27 | 36.46 | 23 | 37.36 | 14 | 36.91 | 4 | 37.78 |
| 31 | 37.27 | 25 | 37.36 | 15 | 36.89 | 5 | 37.38 |
| 32 | 36.41 | 26 | 36.85 | 16a | 39.04 | 7 | 37.26 |
| 35 | 38.25 | 28 | 37.26 | 16c | 39.11 | 9 | 38.22 |
| 36 | 36.63 | 29 | 36.90 | 10 | 37.24 | ||
| 37 | 37.49 | 32 | 37.04 | 12 | 37.24 | ||
| 38 | 36.23 | 33 | 38.47 | 13a | 39.64 | ||
| 39 | 36.84 | 34a | 38.82 | 14 | 37.41 | ||
| 40 | 36.44 | 34b | 39.51 | 16 | 37.56 | ||
| 41 | 36.92 | 35 | 37.32 | ||||
| 42 | 36.88 | 36 | 37.90 | ||||
| 43 | 37.11 | 40 | 37.97 | ||||
| 44a | 37.32 | 42 | 37.43 | ||||
| 46 | 36.25 | 44 | 36.95 | ||||
| 47 | 37.35 | ||||||
| 48 | 37.20 | ||||||
| 49 | 36.83 | ||||||
| 50 | 37.30 | ||||||
| 52 | 37.29 | ||||||
| 54 | 37.58 | ||||||
| 55 | 36.50 | ||||||
| 57 | 37.54 | ||||||
| 60 | 37.35 | ||||||
| 65 | 36.62 | ||||||
| 67 | 37.00 | ||||||
5 Notes on individual objects
In this section we briefly review the results on all 34 objects with high resolution X-ray data. This includes objects for which ROSAT HRI data is analyzed in this paper (tables 5 and 6), objects for which we have used ROSAT HRI results from the literature (table 7), and Leo B, which was observed with the Einstein HRI but has not been observed by the ROSAT HRI.
NGC 147: NGC 147 was observed for the first time in X-rays using the ROSAT HRI and no emission was detected. These observations have also been reported by ?. They give a upper limit for the flux from a point source located in the galaxy of ergs s-1 cm-2 in the 0.1–2.5 keV band-pass, which is in good agreement with the upper limit reported in table 6.
NGC 185: As with NGC 147, this galaxy was observed for the first time in X-rays and no emission was detected. These observations have also been reported by ?. A upper limit for the flux of a point source was found to be ergs s-1 cm-2 in the 0.1–2.5 keV band-pass, again in good agreement with the value quoted in table 6.
NGC 205 - M 110: This small elliptical galaxy was observed with the Einstein HRI and no X-ray sources were detected with a flux ergs s-1 cm-2 in the 0.5–4.0 keV band-pass (?; ?). The ROSAT HRI observations of NGC 205 reported here give an upper limit of ergs s-1 cm-2 for the flux of any point source in the nuclear region. The only source seen in figure 3 lies 2.7′ away from the nucleus and is probably not associated with the galaxy.
NGC 221 - M 32: A strong off-nuclear source in NGC 221 has been found with the HRI on both Einstein and ROSAT. The flux reported here is consistent with the Einstein measurements ( ergs s-1 cm-2 in the 0.5–4.0 keV band-pass (?)). The X-ray source lies away from the NGC 221 nucleus and has no optical counterpart. ASCA observations of this source reported by ? reveal a hard spectrum and a flux decrease of 25 percent in two weeks, favoring the identification of the source as a single XRB. Variability by a factor 3 has also been detected during ROSAT PSPC observations (?). An upper limit for the nuclear X-ray emission is given in table 6. The position of the aperture used to compute the upper limit was shifted slightly from the exact position of the galactic nucleus to avoid contamination from the off-nuclear source.
Dynamical studies of the stellar rotation velocities in this galaxy have revealed the presence of a central dark massive object, probably a black hole, with mass (?; ?), which corresponds to an Eddington luminosity of ergs s-1. The X-ray upper limit in table 6 shows that the central object is emitting at most at .
NGC 224 - M 31: No analysis of X-ray data for this galaxy has been done in this paper. Einstein and ROSAT HRI observations of M 31 have detected over 100 individual sources with luminosities ergs s-1 (?; ?). The ROSAT PSPC, which is a more sensitive than the HRI (but with worse spatial resolution) gives an upper limit for a diffuse component associated with the galactic bulge of ergs s-1 (?).
The point sources are associated with two components, the disk and the bulge, and are strongly concentrated towards the centre. PSPC data show that the bulge and disk components account for about one and two thirds of the total emission, respectively (?). Ginga (2–20 keV) and BeppoSAX (0.1–10 keV) observations have shown that this emission from the galaxy is consistent with a population of LMXRB (?; ?). A list of the sources found within from the nucleus is shown in table 7. The source coincident with the galactic nucleus has been reported to vary (?) and is probably an XRB.
NGC 247: Two strong X-ray sources are seen in the southern region of the ROSAT HRI image (see figure 5). A upper limit for a point source located in the nuclear region of the galaxy can be found in table 6. ? report the detection of 5 ROSAT PSPC sources associated with the galaxy, 3 of which lie outside our optical image. The remaining two correspond to our sources X1 and X2. No obvious optical couterparts are seen at these positions, although X1 is located at the edge of a bright star-forming region. Notice that the astrometry of the observations is thought to be accurate (section 3.2.2).
From a fit in the 0.1–2.0 keV range, ? found that the PSPC spectrum of X1 indicates a very soft and obscured source ( keV, cm-2). Using their spectral parameters we find that the HRI count rate corresponds to a flux in the 0.1–2.0 keV energy range, (corrected by Galactic absorption only) of ergs s-1 cm-2, compared with the PSPC flux of ergs s-1 cm-2 given by ?. This corresponds to an increase in the source luminosity by more than a factor 2 between the PSPC and HRI observations. From the HRI count rate, the intrinsic luminosity of the source is found to be ergs s-1 for an assumed distance to NGC 247 of 3.69 Mpc, although variations in the adopted parameters can change this significantly. For example, changing the hydrogen column and temperature by 1 each (using the error bars in ?, ie., keV, cm-2) decreases the luminosity by an order of magnitude. The very soft spectral distribution, extremely high intrinsic luminosity, and detected variability make this source a good candidate for a stellar accreting black hole.
? also report PSPC observations and find a faint nuclear source with ergs s-1, which is well below the detection limit of our HRI observations. However, due to the poor spatial resolution of the PSPC, it is not clear whether this source is coincident with the galaxy nucleus.
NGC 253: No analysis of X-ray data for this galaxy has been done in this paper. This starburst galaxy has very complex X-ray emission. Thirty one point sources have been detected with the Einstein and ROSAT HRI (?) with luminosities of up to a few times ergs s-1 (see table 7). Analysis of HRI and PSPC observations show that the source located in the nuclear region is extended, soft and possibly variable (?). Spectral fits to some disk sources using PSPC observations show that they are consistent with the spectra of absorbed XRBs (?).
Extended emission is detected well above and below the galactic plane of this galaxy (see figure 11 and 12 in ?) and NGC 253 is a prototype object for the study of X-ray emission from starburst galaxies. Combined ASCA (FWHM ) and PSPC observations show that three components are required to fit the integral spectrum of the galaxy: a power law () and a two-temperatur plasma ( keV and ) (?). The determination of more detailed physical parameters is hampered by the difficulty of measuring multiple absorbing columns, as discussed by ?. Their analysis of the halo diffuse emission detected with the PSPC shows that the spectrum is well fitted by a two-temperatur plasma ( keV and ) if solar abundances are assumed. BeppoSAX observations of NGC 253 show the presence of a eV Fe K line at 6.7 KeV, probably of thermal origin (?). Other prominent lines are also resolved with ASCA (?).
NGC 404: A weak X-ray nuclear source ( ergs s-1) has been detected by the ROSAT HRI in the LINER nucleus of this galaxy. An ASCA 2–10 keV upper limit of ergs s-1 cm-2 has been reported by ?, which implies that the ROSAT flux is either dominated by very soft emission, or that the source is variable. The former idea is supported by recent UV observations of the NGC 404 nucleus which show that the spectrum is dominated by stellar absorption features from massive young stars (?) and not by the blue, featureless continuum expected from an active nucleus.
NGC 598 - M 33: No analysis of X-ray data for this galaxy has been done in this paper. Several point sources have been detected with the Einstein and ROSAT HRI in this spiral galaxy (?; ?). Those sources located within the central region are listed in table 7. The most striking source is the nucleus, with a luminosity of ergs s-1 which makes it a good AGN candidate. However, the nucleus is not detected at radio wavelengths and shows very little line emission in the optical (Schulman & Bregman 1995, Paper III). Nuclear dynamical studies also give a strict limit for a central black hole mass of (?). ASCA observations show that the X-ray emission from this source is much softer than the typical AGN spectrum and it does not show signs of variability to within 10% on time scales of 100 minutes (?). This almost certainly excludes the possibility of an active nucleus in NGC 598. In fact, a disk blackbody fit to the ASCA data shows that its emission is similar to Galactic black hole candidates (?; ?). Diffuse emission around the nucleus has been detected in ROSAT HRI as well as PSPC observations (?; ?; ?).
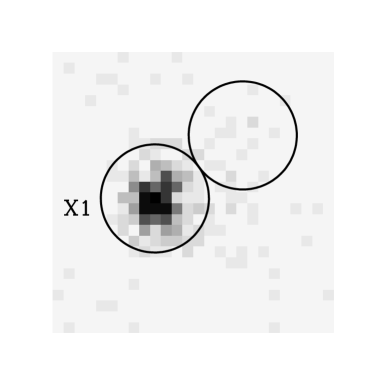
IC 342: We have re-analyzed the ROSAT HRI data already discussed by ?. They found evidence for a diffuse nuclear component that could be explained as a hot interstellar medium generated by a very young nuclear starburst.


Figure 7 shows that three sources lie within the limits of the optical JKT image of the galaxy. The brightest source is coincident with the nucleus and visual inspection of the image suggests that it is marginally resolved. A comparison of the azimuthally averaged profile of the source and the HRI model PSF can be seen in figure 30 and a clear deviation from the model PSF is visible at a radius of between 7 and 13 arcsec from the centre. For comparison, an off-nuclear source is also shown, which is in good agreement with the model PSF, confirming the diffuse nuclear component.
X3 is located close to a faint knot of optical emission while X1 has no obvious optical counterpart. Notice however, that only one source was used to check the astrometry of this observation (section 3.2.2). X1 has a S/N of 2.3 (see table 5), but is included here because it was reported by ? (they found a S/N of 2.8, probably due to a different background estimate).
? analyzed Einstein IPC observations of the nuclear region in IC 342 and argued that the emission is consistent with starburst activity. Unfortunately, the IPC was not able to resolve the three sources detected with the HRI.
NGC 1560: This galaxy was observed for the first time in X-rays and no emission was detected in the ROSAT HRI data. A upper limit for a point source located in the nuclear region of the galaxy can be found in table 6.
NGC 2366: No emission was detected in the ROSAT HRI observations of this galaxy. A upper limit for a point source located in the nuclear region of the galaxy can be found in table 6.
NGC 2403: This galaxy was observed with the Einstein HRI and IPC instruments (?). Three prominent sources were identified in the IPC observations with no emission from the nuclear region of the galaxy.
The ROSAT HRI observations reported here show a total of 4 point sources associated with the galaxy. Sources X1 and X3 in figure 10 correspond to two of the sources reported by ? (their third source lies outside the JKT image). Sources X2 and X4 are about one order of magnitude fainter than X1 and X3, and were probably below the sensitivity threshold of the Einstein observations. It is confirmed that no nuclear source is present in the galaxy and a upper limit for a nuclear point source is given in table 6.
A search for SNRs in NGC 2403 has yielded 35 detections (?). The position of remnant number 15 in table 2 of ? is coincident with the X-ray source X3 reported here (see table 5). A very faint optical counterpart is observed at this position. If the identification is correct the SNR would belong to a class of super-luminous (probably young) remnants (?).
Source X4 is coincident with a giant HII region. A photometric study of this region (N2403-A) reveals more than 1400 detected stars, among them 800 O-type stars and a lower limit of 23 WR stars (?).
The coincidence of X3 and X4 with previously known sources in NGC 2403 gives support to the astrometric checks carried out for this galaxy (section 3.2.2).
NGC 2976: This galaxy was observed for the first time in X-rays and no emission was detected in the ROSAT HRI data. A upper limit for a point source located in the nuclear region of the galaxy can be found in table 6.
The only detected X-ray source has no obvious counterpart. Notice, however, that the astrometry of the observations is highly uncertain given that only one optical identification was found in the field of view of the HRI and a significant shift was applied to one of the images (section 3.2.2).
A 0951+68: This galaxy has been observed in X-rays for the first time. As can be seen in figure 12, the only detected source is probably a foreground or background object.
NGC 3031: No analysis of X-ray data for this galaxy has been done in this paper. Nine and 30 point sources have been detected in this galaxy from observations with the Einstein and ROSAT HRI, respectively (?; ?). All Einstein sources within the galaxy D25 isophote were detected by ROSAT with the exception of the Einstein source X1. ROSAT sources located within the central region are listed in table 7.
The central emission is dominated by the nuclear source, coincident with a low-luminosity active nucleus, with a luminosity ergs s-1 in the 0.2–4.0 keV band-pass. Einstein IPC data show that the spectrum of the nuclear source is soft, with a good fit given by thermal emission with keV or by a power law with index (?). Broad band observations obtained with BBXRT (0.5–10 keV) and ASCA (0.2–10 keV) show, however, that the nuclear emission is consistent with a power law distribution with index (?; ?; ?). The ASCA data also revealed the presence of a broad iron K emission line similar to those seen in more luminous Seyfert galaxies (?; ?). It must be kept in mind that due to the coarse spatial resolution of ASCA some contamination is expected from nearby sources, although ? estimated this to be less than 10 percent. X-ray long term and fast variability by significant factors have been reported for the nuclear source (?; ?; ?).
Leo B: No analysis of X-ray data for this galaxy has been done in this paper. Leo B was observed with the Einstein HRI. ? report that no sources were detected.

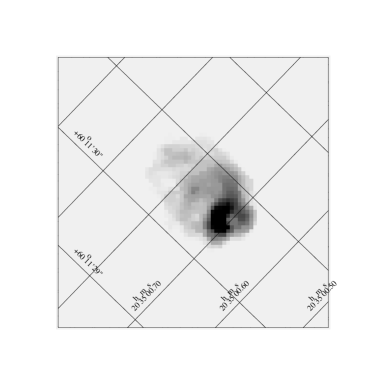
UGC 6456: This is a blue compact galaxy. These galaxies are characterized by low metallicities, high gas content and vigorous star formation. In UGC 6456, evidence of both a recent episode of strong star formation (600–700 Myr) and an older stellar population has been found (?).
The JKT optical images show that the galaxy has numerous bright knots of emission surrounded by a low surface brightness outer envelope (Johnson 1997; Paper II). The knots of emission are displaced south from the geometrical center of the envelope and it is not clear whether they represent the true nuclear region of the galaxy (figure 31).
ROSAT PSPC observations of this galaxy show a central X-ray core and three extended structures connected to the central source (?). This morphology was interpreted as outflows from the central region of the galaxy, powered by starburst activity. The total PSPC flux within a circular aperture of radius 3′ is ergs s-1 cm-2.
The high resolution data reported here show a strong X-ray source located at the north-most limit of the optical emission knots, but displaced to the west with respect to the geometrical centre of the outer envelope (figure 31). Notice also that the astrometry of the HRI observation is fairly well established (section 3.2.2). There is no evidence of extended X-ray emission in the observations, probably due to the lower sensitivity of the HRI. The HRI flux of the point source is ergs s-1 cm-2, about 5 times more luminous than the PSPC observations. A very luminous XRB ( ergs s-1) could be responsible for this flux variation.
NGC 3738: This galaxy has an irregular optical appearance with several bright knots of emission, although the outer parts are quite regular. None of the bright knots seems to coincide with the geometrical center of the galaxy (Johnson 1997; Paper II).
NGC 3738 has been observed in X-rays for the first time and no point sources associated with the galaxy have been found. An upper limit for the X-ray emission can be found in table 6. Source X1 in figure 14 is coincident with a faint knot of optical emission and is probably a foreground or background object. Source X2 is coincident with a bright point-like object and probably corresponds to a foreground star.
NGC 4136: This spiral galaxy has been observed for the first time in X-rays. No sources associated with the nuclear region have been found. An upper limit to the flux from a nuclear point source can be found in table 6. A strong X-ray source is coincident with one of the spiral arms of the galaxy where several knots of emission can be seen in the optical image (see figure 15). The remnant of the historic Type II supernova SN 1941C seen in NGC 4136 is not located close to this X-ray source (?).
NGC 4144: This galaxy was observed for the first time in X-rays and no emission was detected in the ROSAT HRI data. A upper limit for a point source located in the nuclear region of the galaxy can be found in table 6.
NGC 4150: A strong point-like source coincident with this galaxy was detected in the ROSAT All-Sky Survey with ergs s-1 cm-2 and a photon index . The emission was assumed to be from the nucleus of NGC 4150 (?; ?). The high resolution image seen in figure 17 shows, however, that the X-ray source is more than 15″ away from the galactic nucleus and has a position consistent with a knot of optical emission. Spectroscopy of the optical counterpart shows that the source is a background quasar at redshift 0.52 (figure 32).
Figure 17 shows that the X-ray contours of the source are elongated in the north west direction, suggesting that some emission might be coming from the nuclear region of the galaxy. An estimate of the nuclear emission was obtained using a 10″ radius aperture located as shown in figure 33. Although the observed counts have a S/R (and so would be considered a significant detection by the criteria defined in section 3.2.2) the measurement will be treated as an upper limit because of contamination from the nearby quasar.
NGC 4236: This galaxy has a very low surface brightness and no obvious nucleus (Johnson 1997; Paper II). From the ROSAT HRI observations reported here no X-ray sources have been found in the central region of the galaxy. The only detected source (X1) is located in the galactic plane and might have a faint optical counterpart. Notice, however, that the astrometry of the observations is highly uncertain given that only one optical identification was found in the field of view of the HRI and a significant shift was applied to both coadded images (section 3.2.2). A upper limit for a point source located in the nuclear region of the galaxy can be found in table 6.
NGC 4244: No emission was detected in the ROSAT HRI observations of this galaxy. A upper limit for a point source located in the nuclear region of the galaxy can be found in table 6.
NGC 4395: This galaxy contains the faintest and nearest Seyfert 1 nucleus known today (?; ?). Its nuclear X-ray source is highly variable and the continuum is well fitted by a power-law distribution with photon index (?). The bright source seen in figure 20 (X2) has no obvious optical counterpart.


NGC 4605: This galaxy was observed for the first time in X-rays and no emission was detected in the ROSAT HRI data. A upper limit for a point source located in the nuclear region of the galaxy can be found in table 6.
NGC 4736 - M 94: Strong X-ray emission is associated with the LINER nucleus of this galaxy. An extended nuclear source can be seen in figure 22. The azimuthally averaged profile of this source and the HRI model PSF are shown in figure 34.
The galaxy was previously imaged with the Einstein HRI. A nuclear flux of ergs s-1 cm-2 was measured within an aperture of 60″ radius in the 0.5–4.0 keV band-pass (?). The fluxes measured from the ROSAT HRI observation using a small (r = 10″) and a large aperture (r = 100″) are and ergs s-1 cm-2 respectively (see table 5). Since the emission is highly concentrated towards the nucleus, the difference between the 60″ Einstein and 100″ ROSAT fluxes cannot be explained by the different aperture sizes alone. The change in the total observed flux could be explained, however, if the central source is variable or if a substantial fraction of the emission is radiated in the very soft X-rays ( keV).
? have recently reported on ASCA and ROSAT PSPC and HRI observations for NGC 4736. They find that the nuclear emission is consistent with an unresolved source plus an extended component. PSF modeling shows that the unresolved source accounts for more than 50% of the detected emission (?). The 0.1–10 keV ASCA spectrum of the emission is consistent with a power-law with index plus a softer thermal component ( keV) which dominates below 2 keV.
NGC 4826: The nucleus of NGC 4826 has been classified as a transition object (a combination of a LINER and an HIIR nucleus) by ?. The galaxy was observed with the Einstein IPC and a nuclear flux of ergs s-1 cm-2 was measured within a 4.5′ radius aperture (?), in good agreement with the flux found in table 5. Figure 35 shows the azimuthally averaged profile as observed by the ROSAT HRI. Significant extended emission is observed within of the central peak.
NGC 5204: Einstein IPC observations of this galaxy show strong X-ray emission with a total flux of ergs s-1 cm-2 (?) in good agreement with the measurement given here (see table 5). Population I XRBs were thought to be responsible for this emission since the number of OB stars inferred from IUE observations were in agreement with the X-ray luminosity (?). However, the HRI image (see figure 24) shows that the X-ray emission is consistent with a single off-nuclear point source away from the nucleus. Since only one optical ID was found in the field of view of the HRI, the astrometric solution of these observations is quite uncertain. However, the very good agreement in the pointing of the two coadded exposures argues in favor of a fairly accurate astrometry.
Three SNRs have been identified in NGC 5204, but none of them is coincident with the position of the X-ray source (?). Although there is no obvious optical counterpart for the source, several nearby optical knots can be seen in figure 24. The spectrum of one of the candidates, which corresponds to a star forming region, will be presented in Paper III.
The extremely high luminosity of the X-ray source, together with the lack of variability observed between the Einstein and the ROSAT observations, favor an identification as a SNR from a class of super-luminous remnants (the SASS report does not find conclusive evidence of variability during the HRI observations, either). However, the null detection by ? argues against this hypothesis, unless the remnant has an unusually low SII/H ratio (a value was adopted by ? as selection criteria to identify SNRs) or unsually high /H ratio (the super-luminous remnant in NGC 6946 - see below - has /H, which is the highest value seen in these type of objects; the SNR in NGC 5204 would require /H).
| Source | CR (20/01/93) | CR (30/07/94) |
|---|---|---|
| (counts ks-1) | (counts ks-1) | |
| X1 | ||
| X2 | ||
| X3a | ||
| X4 | ||
| X5 | ||
| X6 | ||
| X7 | ||
| X8 |

NGC 5236 - M 83: The very complex X-ray emission in this galaxy can be appreciated in figure 25. Several X-ray knots are distributed on top of bright, uneven extended emission. Comparison between the two ROSAT HRI observations reveals that at least three of the eight detected point sources are variable. Table 8 shows the count rates observed in January 1993 and July 1994. Sources X1, X7 and X8 are not detected during the observations obtained in July 1994, but are among the brightest objects seen in January 1993.

? reported on the Einstein HRI observations of this galaxy. From their observations (obtained in January 1980 and February 1981) only 3 sources were detected in the nuclear region of the galaxy. Two correspond to the ROSAT sources X3 (the nucleus) and X6, which are the brightest sources observed in the ROSAT HRI data (see table 8). Their fluxes in the Einstein (0.5–3.0 keV) band-pass are in good agreement with the fluxes given in table 5. The third source had a luminosity of ergs s-1 in the Einstein band-pass (for a distance to NGC 5236 of 3.75 Mpc as assumed by ?), and it is not detected in the ROSAT data. It probably corresponds to a transient XRB.
? report on ROSAT PSPC observations of NGC 5236 obtained between January 1992 and January 1993. They find a luminosity for the nuclear source of ergs s-1 cm-2, in good agreement with the measurement in table 5. They also detect all the point sources seen in the HRI observations, with the exception of X5, which corresponds to the faintest source in the nuclear region. This suggests that the variable sources X1, X7 and X8 were detectable for at least a year (from the beginning of 1992 until the beginning of 1993), before fading away, becoming undetectable by July 1994.
The diffuse emission from the central region of NGC 5236 can be appreciated in figure 36. From the PSPC observations ? find that the soft 0.1-0.4 keV diffuse component accounts for almost half of the total X-ray emission and argue that most of it is due to hot gas in a super bubble with radius kpc. Evidence of vigorous starburst activity comes from observations of the nuclear and circumnuclear regions of NGC 5236 which have intricate morphologies in the UV, optical and infrared (?; ?; ?).
Finally, several historic supernovae have been observed in this galaxy, but none of them is consistent with the positions of the point X-ray sources.
NGC 5238: This galaxy was observed for the first time in X-rays and no emission was detected in the ROSAT HRI data. A upper limit for a point source located in the nuclear region of the galaxy can be found in table 6.
NGC 5457 - M 101: Observations of this galaxy with the Einstein IPC and ROSAT PSPC have been widely reported (?; ?; ?). Results from an ultra-deep (229 ks) ROSAT HRI observation have become available recently (?). The data reported here were the result of combining 2 of the 4 images used to produce the ultra-deep observation reported by ?.
? find a total of 51 point sources down to fluxes ergs s-1 cm-2, of which about half are thought to be associated with the galaxy. The X-ray emission beautifully traces the spiral arms of the galaxy and 5 of the individual sources are associated with giant HIIRs (?), but they are located outside the optical JKT image shown in figure 27.
From IPC data ? find a nuclear X-ray flux of ergs s-1 cm-2 within a circle of 90″ radius for the Einstein (0.2–4.0 keV) band-pass. From the ROSAT HRI observations a nuclear flux of ergs s-1 cm-2 is obtained, an order of magnitude fainter than the IPC flux. The difference can be explained if sources X2 and X3, which are not resolved by the IPC, were contained within the large aperture used by ?, or by the effect of luminous and highly variable XRBs. The ROSAT HRI count rate found by ? for the nuclear source is identical to our value (0.67 counts ks-1), although the inferred fluxes disagree by a factor , probably because different spectral models were assumed.
The presence of a soft diffuse component is discussed by ? and ?. They find conclusive evidence in ROSAT PSPC observations for extended emission within the inner 7′ of the galaxy. The radial profile obtained from the ROSAT HRI observations shown in figure 37 suggests some patchiness in the X-ray. The better signal to noise data analyzed by ? confirm this result.
An astonishing total of 93 SNRs have been identified in the galaxy (?). Remnants 57 and 54 are consistent with the positions of sources X2 and X3 seen in figure 27. ? detected X-ray emission from two further remnants, but they fall outside our JKT image.


NGC 6503: The nucleus of this galaxy has been classified as a combination of a transition object and a Seyfert 2 nucleus by ?. The ROSAT HRI observations in figure 28 show extended and elongated emission close to the central region of the galaxy. This diffuse emission can be better appreciated in figure 38 where the X-ray image has been smoothed using a Gaussians with .
The extended source lies away from the galactic nucleus. The astrometric solution of the HRI observation has been confirmed using two bright X-ray sources in the field with optical counterparts and therefore the location of the diffuse emission is probably off-nuclear. Notice, however, that the astrometric checks carried out in section 3.2.2 assumed a point source distribution of counts, while the source seen in NGC 6503 is clearly extended, implying possible errors in the determination of the centroid of the emission. The shape and energetics of the diffuse emission could be explained within the super-wind model for starburst galaxies. More detailed observations are necessary to confirm this hypothesis.
NGC 6946: Einstein IPC observations showed X-ray emission associated with the whole body of this galaxy. Two peaks of emission were detected, one coincident with its starburst nucleus and the other associated with a prominent northern spiral arm (?). The spectral fit to these data was consistent with a soft and a hard component, probably associated with diffuse emission and individual accreting sources respectively. The presence of diffuse emission across the disk of the galaxy was confirmed by ROSAT PSPC observations (?) and can also be appreciated in our HRI image (figure 29). The PSPC also resolved the nucleus into three sources which correspond to X3, X4 and X7 in the HRI data. Figure 39 shows the profile of the nuclear source X3 and of an off-nuclear source (X7). Comparing both plots it is clear that the nuclear source is extended up to away from the central peak. From the analysis of ASCA and PSPC data, ? found that a composite spectrum (a Raymond-Smith plasma with keV plus a power-law with photon index ) was a good fit to the observations. It should be remembered, however, that due to the poor spatial resolution of ASCA most of the sources seen in figure 29 were probably contained in the extraction apertures of the X-ray spectra.
Six historic SNs have been seen in this spiral galaxy (SNs 1917A, 1939C, 1948B, 1968D, 1969P, and 1980K) (?). A total of 27 remnants (not including the historic SNs) have been detected by ?. SN 1980K has been observed in X-rays (?), but the source lies outside the JKT optical image of the galaxy. The extreme northern source seen in this galaxy (X8 in figure 29) seems to belong to an extreme group of SNRs with ergs s-1 (?). A faint, red () counterpart is seen at the position of this source in our optical images, which also corresponds to the object No 16 in the ?’s list of SNRs. Recent PC2 HST images show that the optical source has an intricate morphology, with a small bright shell and what seem to be two outer loops or arcs, as can be seen in the narrow filter image (F673N) shown in figure 40. Based on this morphology, ? suggested that the source could be explained as two interacting remnants of different age, with the smaller shell being a young remnant colliding with the outer, older shells. However, ? have found no high velocity components in their optical high-dispersion spectra of the source, which is not consistent with the presence of a very young and compact SNR. From the H flux they derived a kinetic energy of ergs for the shocked gas. Although this value is somewhat larger than what is normally assumed for supernova explosions, it is still within the range of normal events.
6 Discussion
First we summarize the most striking results, before discussing some of the key issues more carefully.
(i) Of the 34 galaxies with X-ray data, 12 have X-ray sources associated with their nuclear regions: a 35% success rate. The first result, then, is that nuclear X-ray sources are very common. (It should be noticed that due to the astrometric uncertainties discussed in section 3.2.2, the aligment of the sources with the galactic nuclei is a tentative result for NGC 404, IC 342, and NGC 4395. However, the presence of an active nucleus in NGC 4395 – see section 5 – gives further support to this identification).
(ii) However, it is clear that the detection rate changes markedly with host galaxy luminosity. All 12 detections are in the sub-sample of 29 galaxies with . This effect is discussed in more detail below.
(iii) Of the galaxies spectroscopically classified as Seyfert, LINER, or transition object, 5/7 have detected nuclear X-ray sources, whereas only 7/22 objects with HIIR or absorption-line spectra are detected (spectroscopic classifications will be discussed in Paper III, but the same result holds using the classifications of ?). However, this apparent preference for AGN only reflects the fact that nearly all the smaller galaxies are classified as HIIR. Amongst detected nuclear X-ray sources, 5/12 are classified as AGN of some kind, and 7/12 as HIIR or absorption line.
(iv) Some of the nuclear sources are only just at the limit of detectability, but many are considerably more luminous, up to erg s-1. Of these more luminous sources, a large fraction are clearly extended on a scale of 10 arcsec or more, corresponding to pc or so at the typical distance of our sample galaxies.
(v) Many sources outside the nucleus are detected – most interestingly nine off-nuclear sources are found with luminosities exceeding erg s-1, not easily explained as individual X-ray binaries or SNRs.
6.1 Dwarf galaxies
Of the twelve galaxies classified as dwarfs in the sample (see table 1), only five have Einstein or ROSAT HRI observations (NGC 147, NGC 185, A 0951+68, Leo B and UGC 6456). Of these only one has a positive detection of an X-ray source (UGC 6456) and even this one is not nuclear. For the rest of section 6, we do not include these dwarfs in the analysis, concentrating on the sub-sample of 29 galaxies with .
6.2 Super-luminous X-ray off-nuclear sources
| Number | Host | ID | Remarks | |
| (ergs s-1) | ||||
| 1 | NGC 247 | X1 | 39.08 | Possible counterparts at the edge |
| of a bright star-forming region | ||||
| 2 | IC 342 | X3 | 39.18 | Possible () counterpart |
| 3 | NGC 2403 | X1 | 39.47 | Possible faint counterpart |
| 4 | NGC 2403 | X3 | 39.01 | Possible very faint counterpart - known SNR |
| 5 | NGC 4136 | X1 | 39.10 | Diffuse blue counterpart |
| 6 | NGC 5204 | X1 | 39.77 | Several faint counterparts |
| 7 | NGC 6946 | X1 | 39.13 | No obvious optical counterpart |
| 8 | NGC 6946 | X7 | 39.21 | Possible very faint counterparts |
| 9 | NGC 6946 | X8 | 39.87 | Known SNR; faint red counterpart |
Outside the nucleus, remarkably luminous sources ( erg s-1) are seen very frequently in galaxies spanning 2 orders of magnitude in luminosity. These are plotted against host galaxy luminosity in figure 41. The most luminous sources ( erg s-1) have been labeled with numbers and brief comments about them can be found in table 9. Figure 41 shows that there is no obvious correlation with galaxy size.


The population of X-ray sources in the Milky Way and M 31 does not include luminosities above ergs s-1. The presence of luminous ( ergs s-1) sources in the Magellanic Clouds was assumed to be a metallicity effect (?; ?). However, as more galaxies were surveyed using the capabilities of the Einstein and ROSAT satellites it became clear that extremely luminous objects ( ergs s-1) were not rare (?).
Next we assess the possibility that the ultra-luminous sources are actually background objects. Using the results from the ROSAT Deep Survey in the Lockman Field (?) we estimate that no more than three background sources with fluxes of ergs s-1 cm-2 would be found in a 1 deg2 field. If these targets are distant, and so obscured by the intervening galaxy, their intrinsic luminosities must be higher and the corresponding number densities even lower. Given the average projected size of the galaxies on the sky (see table 3 for the area contained within the D25 ellipses) the probability that all the sources correspond to background objects is extremely small.
At least one super-luminous source has been identified as a multiple object formed by interacting SNRs in the disk of NGC 6946 (?) (see figure 40). ? has recently suggested that some of the X-ray bright remnants observed in M 101 could correspond to ‘Hypernova Remnants’, a term introduced by Paczyński (1998) for super-energetic -ray bursts and the associated afterglow event - but see also ?. Other multiple object systems could be formed from XRBs, SNRs, and diffuse emission from hot bubbles of interstellar gas. Alternatively, the sources could be super-Eddington XRBs with luminosities several times greater than the Eddington limit for a neutron star. The high luminosities in this case are explained as anisotropic emission from neutron stars in binary systems with very strong magnetic fields (?), or as black hole XRBs.


? have recently analyzed ASCA data from three nearby spiral galaxies. One of the galaxies is M 33 and these observations have already been discussed in section 5. The other two galaxies (NGC 1313 and NGC 5408) each harbor a luminous source ( ergs s-1) displaced from the nucleus. The fit to the X-ray spectra of these sources shows that at least two components, a steep power law and a ‘Disk Black Body’, are required to explain the observations, suggesting that these are accretion driven systems. The parameters from the model imply BH masses of , intermediate between those seen in XRB and AGN. Given the observed X-ray luminosities and the estimated masses, these objects are not super Eddington sources.
It is clear, then, that super-luminous point sources are common. However, unlike nuclear sources discussed in the next section, there seems to be no correlation between the probability of having a super-luminous off-nuclear source and the brightness of the parent galaxy.
6.3 Correlation between nuclear X-ray luminosity and host galaxy luminosity
Figure 42 shows the nuclear X-ray luminosities and upper limits for the galaxies in the sample as a function of the blue absolute magnitude of the host. Different symbols have been used to show the optical classification of the nuclear emission as starlight, HII regions, LINERs, transition objects (i.e., a HIIR and LINER composite), and Seyferts (Paper III). As was suggested before, it is found that the probability of detection of a nuclear X-ray source correlates strongly with host galaxy luminosity: the rate of detection is 0% (0/7) below , 25% (3/12) for , and 90% (9/10) for galaxies with .
? have collected data from ROSAT HRI observations for 39 nearby spiral and elliptical galaxies, of which 9 objects are common to our sample. Their results confirm what is seen in figure 42: for those sources detected within arcsecs from the optical center of the galaxy, and therefore likely to be nuclear sources, the detection rate is nearly 100 percent for hosts with .
The distribution of points does not suggest a straightforward correlation, but rather a large spread with an upper envelope. In other words, large galaxies can have luminous or feeble nuclei, but small galaxies can only have feeble nuclei. A similar upper-envelope effect has been claimed for the host galaxy luminosities of quasars and Seyferts (?). Given this correlation, the lack of detection of nuclear sources in small galaxies does not necessarily mean they cannot form AGN at all – it may be that they are exceedingly weak nuclear sources.
It is not clear how to model the envelope-like relationship between nuclear and host galaxy luminosities. However, a simple visual comparison with other related samples reveals a rather striking effect. The upper envelope for our sample seems to go roughly as . Figures 43, 44 and 45 show nuclear emission line data taken from the study of ?. The nuclear H luminosity from galaxies classified as HII regions shows a very similar correlation with host galaxy luminosity (figure 43) and once again an upper envelope with slope 1.5 is a good fit. Likewise for dwarf Seyferts, the broad H component shows a correlation with a slope of 1.5 (figure 44). However, for the narrow-line component of H for Seyfert nuclei, the correlation is much steeper, with a slope of 3.0 (figure 45). Figure 46 shows data from the radio survey of elliptical galaxies by ?. Here we find that nuclear radio luminosity shows a very strong correlation with an upper envelope slope of 3.0. (? do a more careful analysis showing that the 30th percentile goes as ). So it seems that narrow emission lines in AGN are intimately connected with radio emission. On the other hand, the relation seen for our X-ray sources is equally consistent with either AGN or star formation.
6.4 Nuclear X-ray sources as disk sources
Some of the nuclear X-ray sources we have seen are consistent with the most luminous known X-ray binaries. Furthermore, we have seen that super-luminous off-nuclear sources do occur quite often. Is it possible, then, that the nuclear sources are simply examples of the general X-ray source population that happen to be located in the nucleus? Where we see a clear extended source, this cannot be the case. This argument assumes that the observed extended emission is truly diffuse in nature. Of course, we cannot exclude a contribution of unresolved sources to the extended component, but this cannot account for the bulk of the emission for the more conspicuous cases (see ?, ?, ?, and ?). It could also be that more luminous galaxies are simply more likely to have at least one example of a particularly luminous source. The strongest argument against this is that amongst the off-nuclear sources we do not see the upper-envelope correlation with host galaxy luminosity (figure 41). We can also crudely estimate the likely size of such an effect if we know the luminosity distribution of X-ray sources.
The combined luminosity distribution of disk (ie, off-nuclear) X-ray sources from a sample of 83 spiral galaxies has been established recently by ?. The sample was defined as those objects surveyed by ? that had archive ROSAT HRI observations. The distribution determined by ? reaches luminosities for off-nuclear sources just below ergs s-1, ie, it extends well into the realm of the super-luminous sources discussed in the previous section. The low luminosity end of the distribution was found using the ROSAT PSPC deep observations of NGC 224 (M 31) published by ?. ? find that the (differential) luminosity distribution is well fitted by a power law slope of , with a flattening for luminosities ergs s-1. It is not clear whether this change in the slope is due to incompleteness or to an intrinsic variation in the faint source population.
Since the luminosity distribution determined by ? corresponds to an average distribution a direct comparison between the properties of the populations in individual galaxies and their hosts is not possible. Moreover, as their sample is drawn from the flux-limited sample surveyed by ?, with an under-representation of low luminosity galaxies, it is not possible to confirm the lack of correlation between the probability of finding a super-luminous off-nuclear source and the luminosity parent galaxy seen in figure 41.
The luminosity distribution of off-nuclear sources predicts that about 8 disk sources with ergs s-1 will be found in a () galaxy. Of these sources only one will have a luminosity ergs s-1. The probability of that source being located within the nucleus of the parent galaxy can be expressed as the ratio between the total luminosity and the luminosity of a ‘nuclear region’ of 100 pc (equal to the HRI spatial resolution at a distance of 4 Mpc). Using the well established exponential disk profile in spirals, and assuming a scale length for the disk equal to 4 kpc (?) this ratio is only .
For more luminous sources the situation is even worse, since the ? luminosity distribution predicts that about galaxies have to be surveyed in order to find a ergs s-1 X-ray source. This prediction does not agree with our results, however. In our sample of 29 galaxies we have detected 9 sources with luminosities above ergs s-1 and all but one of the host galaxies (NGC 2403) have (see figure 41). A closer look at the results reveals that two effects could be responsible for this difference: (1) statistic fluctuations introduced in the results drawn from our smaller sample due to the distances adopted for the parent galaxies; (2) the fairly large threshold radius (25 arcsecs) adopted by ? to discriminate between nuclear and off-nuclear sources (as an example, the ultra-luminous off-nuclear source in NGC 5204 was labeled as nuclear by ?). As pointed by ?, individual galaxies can also show important deviations from the determined luminosity distribution. The X-ray population in NGC 5457, for example, shows the same power-law index determined by ? for the combined sample, but the normalization is 4 times larger.
In summary, even with a large error (or fluctuation) in the normalization of the luminosity distribution of off-nuclear sources, it is clear that nuclear sources cannot be explained as disk sources located by chance in the nuclei of galaxies. There is another possibility, however. Nuclear sources could be explained if massive X-ray emitting systems, such as black hole binaries, suffer considerable dynamical friction against field stars and so migrate to the centre of their parent galaxies. In this scenario the upper envelope seen in figure 42 could be the result of smaller galaxies having shallower potential wells and therefore being less efficient in dragging the heavy objects to their centres. However, it is well known that the scale time for a significant change in the orbit of any stellar system is comparable to the local relaxation time which, in the case of disks, is much longer than the Hubble time (?). Therefore, galactic disks are too young for a source to have migrated significantly from its original location.
6.5 Nuclear X-ray sources as bulge sources
An alternative to the scenario described above is that the massive XRBs could have originally been located in the bulge of the galaxy, where larger background stellar densities make mass segregation a much more efficient mechanism. However, the anticorrelation between the time it takes for a massive object to migrate to the galactic nucleus and the mass of the object implies that an XRB would need a mass of over to fall to the galactic centre from a distance of only 10 pc within the lifetime of the parent galaxy (1 Gyr) (?). Therefore, dynamical friction will only be efficient for very heavy or very nearby stars. Indeed, ? show that only extremely massive objects such as globular clusters would have spiralled into the centre of their parent galaxies in less than a Hubble time from a significantly extra-nuclear (2 kpc) distance.
It could also be argued that the X-ray emission from the central regions corresponds to bulge sources which appear coincident with the galactic nuclei. This is unlikely, however, given the spatial resolution of our observations (ranging from pc for NGC 224 to pc for NGC 5457, with most galaxies with detected nuclear sources being observed at a resolution pc), implying that a very large number of highly centrally concentrated bulge sources would be necessary to explain the observations. NGC 224 indeed shows a high concentration of bulge sources when compared with our own Galaxy, with 4 times more sources seen in NGC 224 within the central 5 arcmins (?). However, only two sources are found within the innermost 100 pc, giving a total luminosity of ergs s-1. The probability of those sources having ergs s-1 is extremely small, as is shown in the bulge luminosity distribution determined of ?. Also, as we have already shown, the hypothesis that particularly heavy (and luminous) binary systems are located within this region because of mass segregation is not viable. Therefore, most of the galaxies with seen in figure 42 would need to harbor a much larger population of bulge sources that the one seen in NGC 224 in order to explain their observed nuclear luminosities, which is a very unlikely scenario.
6.6 The nature of the nuclear X-ray sources
The very different correlations between X-ray luminosity and host galaxy absolute magnitude seen in figures 41 and 42 for nuclear and off-nuclear sources imply two different populations. Nuclear sources are not disk or bulge sources located in the nuclear region by chance. Instead, nuclear sources have a particular nuclear nature.
The next step is to try to unveil this nature. What are these sources? Are they connected with stellar processes in the nuclear region of the galaxies? Could they be an expression of nuclear activity that somehow escapes detection at optical wavelengths?
An interesting pattern can be seen in figure 42 between the optical (spectral) classification of the galaxies and their X-ray luminosities. Both LINER objects (NGC 404 and NGC 4258) lie close to the upper envelope of the distribution of detected sources, as does the Seyfert galaxy NGC 3031. The second Seyfert nucleus, NGC 4395, is heavily absorbed below 3 keV and its intrinsic soft X-ray luminosity is estimated to be an order of magnitude larger than the values found from ROSAT observations (?). Introducing this last correction all objects classifies as AGN would be found near the top of the upper envelope in figure 42.

The distribution of X-ray sources with galaxy absolute magnitude, shown in figure 42, can be bounded by a nearly linear upper envelope. A similar linear upper envelope has been found in the correlation between nuclear (AGN) luminosity and host galaxy luminosity for samples of Seyfert galaxies and low redshift quasars at IR and optical wavelengths (?; ?). This suggests that there is a maximum allowed AGN luminosity which is an increasing function of the luminosity of the parent galaxy. The limit could be the result of a correlation between the total mass of the host galaxy and the mass of the central engine. The observed range of nuclear luminosities would be given by different accretion rates, with sources located at the bound of the region, showing the maximum possible luminosity. Indeed, from their study of nearby quasars ? and ? show that if the correlation between black hole mass and galaxy size claimed by ? is correct, then the upper envelope is consistent with the most luminous AGN radiating at roughly 20% of the Eddington limit. If the smaller ratio of black hole mass to galaxy mass suggested by ? is used then the closeness of the upper envelope to the Eddington prediction is even more remarkable.
However, in the case of the comparatively weak nuclear X-ray sources we have found here, it is not clear what process determines the maximum possible luminosity. If the observed X-ray emission is driven by accretion of matter onto a BH, then the Eddington limit for the central mass seems the most straight-forward mechanism to explain the existence of the linear upper envelope. However, this cannot be the case. The only two Seyfert galaxies in the sample, NGC 3031 (M 81) and NGC 4395, are thought to be extremely sub-Eddington (?; ?), with their bolometric luminosities being only .
Figure 47 makes this point graphically. We use the relation given by ?, , where is the -band luminosity of the bulge and all quantities are expressed in solar units. The bulge magnitudes for the galaxies in our sample can be found from the total magnitudes shown in table 1 using the relantionship obtained by ? as a function of Hubble Type, while a colour was assumed for all objects to convert the blue magnitudes to visual magnitudes. Using the relationship above we can infer the X-ray output for a central BH emitting at the Eddington limit as a function of its host galaxy bulge luminosity, assuming that the soft X-ray emission corresponds to of the bolometric luminosity. It is found that the predicted X-ray luminosities (seen as a dotted line in figure 47) are about 4 orders of magnitude brighter than what is observed.
The nuclear-host correlation we have seen cannot, therefore, be simply interpreted as the upper envelope relation seen amongst luminous AGN, because the X-ray sources are so feeble. However, it should be borne in mind that the objects discussed in ? have been pre-selected as AGN, whereas we are looking at galaxies as a whole. For example, it is possible that the probability distribution is a universal function for all galaxies, declining continuously from large values at small to small values at large , but with a cutoff at . The envelope seen in AGN samples then traces the cutoff, but the envelope seen in complete galaxy samples is a statistical effect, tracing in each host-galaxy-bin the nuclear luminosity beyond which the expected number of objects is just less than one. With a larger sample, the density of points would be greater, so the envelope would move up, but the slope might stay the same.
Most of the preceding discussion has centred round the possibility that the weak nuclear X-ray sources are AGN. However, this is not obvious. They seem to show no particular preference for AGN-like optical spectra, and the correlation with host galaxy luminosity is exactly like that shown by the emission line luminosity for HII nuclei (see figure 43). Furthermore many of the most luminous sources are extended on scales of hundreds of parsecs or more. It seems equally likely that the X-ray emission is connected with star formation, but with the current data we cannot go much further. In later papers in this series we examine the correlation between X-ray, optical, and emission-line luminosities, and test specific AGN and star formation models.
Although it is unclear which physical process causes the observed distributions, the upper envelopes give strong evidence for a correlation between the host galaxy luminosity and the level of nuclear activity. The fact that an upper envelope is also observed in the distribution of the nuclear HII regions might suggest that the correlations are governed by the amount of gas available in the nuclear regions. If bigger galaxies are more efficient in dragging gas to their nuclear regions they could show more vigorous star formation and, potentially, feed their massive BHs more efficiently.
7 Summary
X-ray sources in the nuclei of galaxies are very common and the luminosity of these sources is strongly connected to the luminosity of the host galaxy. The highest luminosities reach ergs s-1 which is times less than the Eddington limit for the massive black holes that may be present in such galaxies. The most luminous nuclear X-ray sources are frequently extended on scales of hundreds of parsecs. It is, so far, unclear whether these nuclear X-ray sources are miniature AGN of some kind or a phenomenon connected with normal star formation. Outside the nuclei of galaxies, extremely luminous sources ( erg s-1, compared with ‘normal’ erg s-1 SNRs or erg s-1 XRBs) are also quite common, occurring in a third of all galaxies. The nature of these sources is currently also unclear.
Acknowledgements
We thank Gordon Stewart and John Arabadjis for insightfull discussion on this paper. This research has made use of data obtained from the Leicester Database and Archive Service at the Department of Physics and Astronomy, Leicester University, UK. The Jacobus Kapteyn Telescope is operated on the island of La Palma on behalf of the UK Particle Physics and Astronomy Research Council (PPARC) and the Nederlanse Organisatie voor Wetenschappelijk Onderzoek (NWO) and is the located at the Spanish Observatorio del Roque de los Muchachos. The observatory is hosted by the Instituto de Astrofísica de Canarias. The DSS plates used in this paper were based on photographic data of the National Geographic Society – Palomar Observatory Sky Survey (NGS-POSS) obtained using the Oschin Telescope on Palomar Mountain. The NGS-POSS was funded by a grant from the National Geographic Society to the California Institute of Technology. The plates were processed into the present compressed digital form with their permission. The Digitized Sky Survey was produced at the Space Telescope Science Institute under US Government grant NAG W-2166. The data presented in this paper were reduced using Starlink facilities.
References
- [Barbon, Capellaro & Turatto¡1989¿] Barbon R., Capellaro E., Turatto M., 1989, A&AS, 81, 421
- [Bender, Kormendy & Dehnen¡1996¿] Bender R., Kormendy J., Dehnen W., 1996, ApJ, 464, L123
- [Binney & Tremaine¡1987¿] Binney J., Tremaine S., 1987, Galactic dynamics
- [Blair, Fesen & Schlegel¡1997¿] Blair W. P., Fesen R. A., Schlegel E. M., 1997, Bull. American Astron. Soc., 190, 2706
- [Bohlin et al.¡1983¿] Bohlin R. C., Cornett R. H., Hill J. K., Smith A. M., Stecher T. P., 1983, ApJ, 274, L53
- [Boller et al.¡1992¿] Boller T., Meurs E. J. A., Brinkmann W., Fink H., Zimmermann U., Adorf H. M., 1992, A&A, 261, 57
- [Brandt et al.¡1997¿] Brandt W. N., Ward M. J., Fabian A. C., Hodge P. W., 1997, MNRAS, 291, 709
- [Bregman, Cox & Tomisaka¡1993¿] Bregman J. N., Cox C. V., Tomisaka K., 1993, ApJ, 415, L79
- [Chu, Chen & Shih-Ping¡1999¿] Chu Y.-H., Chen C.-H. R., Shih-Ping L., 1999, in STScI Symposium: The Largest Explosions Since the Big Bang: Supernovae and Gamma Ray Bursts, preprint, astro-ph/9909091
- [Colbert & Mushotzky¡1999¿] Colbert E. J. M., Mushotzky R. F., 1999, preprint, astro-ph/9901023
- [Dahlem, Weaver & Heckman¡1998¿] Dahlem M., Weaver K. A., Heckman T. M., 1998, apjs, 118, 401
- [David et al.¡1998¿] David L. P., Harnden F. R., Kearns K. E., Zombeck M. V., 1998, The ROSAT High Resolution Imager (HRI) Calibration Report
- [Dibai & Zasov¡1985¿] Dibai E. A., Zasov A. V., 1985, Soviet Astronomy, 29, 273
- [Drissen & Roy¡1996¿] Drissen L., Roy J. R., 1996, in ASP Conf. Ser. 98: From Stars to Galaxies: the Impact of Stellar Physics on Galaxy Evolution, eds, Leitherer C., Fritze-Von Alvensleben U., Huchra J.
- [Ehle et al.¡1998¿] Ehle M., Pietsch W., Beck R., Klein U., 1998, A&A, 329, 39
- [Fabbiano & Panagia¡1983¿] Fabbiano G., Panagia N., 1983, ApJ, 266, 568
- [Fabbiano & Trinchieri¡1984¿] Fabbiano G., Trinchieri G., 1984, ApJ, 286, 491
- [Fabbiano & Trinchieri¡1987¿] Fabbiano G., Trinchieri G., 1987, ApJ, 315, 46
- [Fabbiano, Kim & Trinchieri¡1992¿] Fabbiano G., Kim D. W., Trinchieri G., 1992, ApJS, 80, 531
- [Fabbiano¡1988¿] Fabbiano G., 1988, ApJ, 325, 544
- [Fabbiano¡1995¿] Fabbiano G., 1995, in X-ray binaries, eds, Lewin W. H., Van Paradijs J., Van Den Heuvel E. P.
- [Filippenko & Sargent¡1989¿] Filippenko A. V., Sargent W. L. W., 1989, ApJ, 342, L11
- [Gallais et al.¡1991¿] Gallais P., Rouan D., Lacombe F., Tiphene D., Vauglin I., 1991, A&A, 243, 309
- [Gehren et al.¡1984¿] Gehren T., Fried J., Wehinger P. A., Wyckoff S., 1984, ApJ, 278, 11
- [Hasinger et al.¡1998¿] Hasinger G., Burg R., Giacconi R., Schmidt M., Trumper J., Zamorani G., 1998, A&A, 329, 482
- [Helfand¡1984¿] Helfand D. J., 1984, PASP, 96, 913
- [Ho, Filippenko & Sargent¡1995¿] Ho L. C., Filippenko A. V., Sargent W. L. W., 1995, ApJS, 98, 477
- [Ho, Filippenko & Sargent¡1996¿] Ho L. C., Filippenko A. V., Sargent W. L. W., 1996, ApJ, 462, 183
- [Ho, Filippenko & Sargent¡1997a¿] Ho L. C., Filippenko A. V., Sargent W. L. W., 1997a, ApJS, 112, 315
- [Ho, Filippenko & Sargent¡1997b¿] Ho L. C., Filippenko A. V., Sargent W. L. W., 1997b, ApJ, 487, 568
- [Huchra & Burg¡1992¿] Huchra J., Burg R., 1992, ApJ, 393, 90
- [Hutchings, Crampton & Campbell¡1984¿] Hutchings J. B., Crampton D., Campbell B., 1984, ApJ, 280, 41
- [Ishisaki et al.¡1996¿] Ishisaki Y., Makishima K., Iyomoto N., Hayashida K., Inoue H., Mitsuda K., Tanaka Y., Uno S. I., Kohmura Y., Mushotzky R. F., Petre R., Serlemitsos P. J., Terashima Y., 1996, PASJ, 48, 237
- [Iwasawa et al.¡2000¿] Iwasawa K., Fabian A. C., Almaini O., Lira P., Lawrence A., Hayashida K., Inohue H., 2000, submitted
- [Johnson¡1997¿] Johnson R. A., 1997, PhD thesis, Queen Mary and Westfiled College
- [Kim, Fabbiano & Trinchieri¡1992¿] Kim D. W., Fabbiano G., Trinchieri G., 1992, ApJ, 393, 134
- [Kormendy & McClure¡1993¿] Kormendy J., McClure R. D., 1993, AJ, 105, 1793
- [Kormendy & Richstone¡1995¿] Kormendy J., Richstone D., 1995, ARA&A, 33, 581
- [Kraan-Korteweg & Tammann¡1979¿] Kraan-Korteweg R. C., Tammann G. A., 1979, Astron. Nachr., 300, 181
- [Kraan-Korteweg¡1986¿] Kraan-Korteweg R. C., 1986, A&AS, 66, 255
- [Kraft, Burrows & Nousek¡1991¿] Kraft R. P., Burrows D. N., Nousek J. A., 1991, ApJ, 374, 344
- [Kunth, Sargent & Bothun¡1987¿] Kunth D., Sargent W. L. W., Bothun G. D., 1987, AJ, 93, 29
- [Lira et al.¡1999¿] Lira P., Lawrence A., O’Brien P., Johnson R. A., Terlevich R., Bannister N., 1999, MNRAS, 305, 109
- [Loewenstein et al.¡1998¿] Loewenstein M., Hayashida K., Toneri T., Davis D. S., 1998, ApJ, 497, 681
- [Long et al.¡1994¿] Long K. S., Gordon S. M., Blair W. P., Charle P. A., 1994, in AIP Conference Proceedings: The soft X-ray cosmos, eds, Schlegel E. M., Petre R.
- [Lynds et al.¡1998¿] Lynds R., Tolstoy E., O’Neil., Earl J. J., Hunter D. A., 1998, AJ, 116, 146
- [Mackie et al.¡1995¿] Mackie G., Fabbiano G., Kim D.-W., Ikebe Y., 1995, in IAU Sym. 164, Stellar Populations, eds, van der Kruit P. C., Gilmore G.
- [Magorrian et al.¡1998¿] Magorrian J., Tremaine S., Richstone D., Bender R., Bower G., Dressler A., Faber S. M., Gebhardt K., Green R., Grillmair C., Kormendy J., Lauer T., 1998, AJ, 115, 2285
- [Makishima et al.¡1989¿] Makishima K., Ohashi T., Hayashida K., Inoue H., Koyama K., Takano S., Tanaka Y., Yoshida A., Turner M. J. L., Thomas H. D., Stewart G. C., Williams R. O., Awaki H., Tawara Y., 1989, PASJ, 41, 697
- [Maoz et al.¡1998¿] Maoz D., Koratkar A., Shields J. C., Ho L. C., Filippenko A. V., Sternberg A., 1998, AJ, 116, 55
- [Markert & Donahue¡1985¿] Markert T. H., Donahue M. E., 1985, ApJ, 297, 564
- [Markert & Rallis¡1983¿] Markert T. H., Rallis A. D., 1983, ApJ, 275, 571
- [Matonick & Fesen¡1997¿] Matonick D. M., Fesen R. A., 1997, ApJS, 112, 49
- [Matonick et al.¡1997¿] Matonick D. M., Fesen R. A., Blair W. P., Long K. S., 1997, ApJS, 113, 333
- [McHardy et al.¡1998¿] McHardy I. M., Jones L. R., Merrifield M. R., Mason K. O., Newsam A. M., Abraham R. G., Dalton G. B., Carrera F., Smith P. J., Rowan-Robinson M., Abraham R. G., 1998, mnras, 295, 641
- [McLeod & Rieke¡1995¿] McLeod K. K., Rieke G. H., 1995, ApJ, 441, 96
- [McLeod, Rieke & Storrie-Lombardi¡1999¿] McLeod K. K., Rieke G. H., Storrie-Lombardi L. J., 1999, ApJ, 511, L67
- [McLeod¡1997¿] McLeod K. K., 1997, in Quasar Hosts, eds, Clements D. L., Perez-Fournon I.
- [McLure et al.¡1999¿] McLure R. J., Kukula M. J., Dunlop J. S., Baum S. A., O’Dea C. P., Hughes D. H., 1999, MNRAS, 308, 377
- [Moran, Halpern & Helfand¡1996¿] Moran E. C., Halpern J. P., Helfand D. J., 1996, ApJS, 106, 341
- [Morris¡1993¿] Morris M., 1993, ApJ, 408, 496
- [Papaderos et al.¡1994¿] Papaderos P., Fricke K. J., Thuan T. X., Loose H. H., 1994, A&A, 291, L13
- [Persic et al.¡1998¿] Persic M., Mariani S., Cappi M., Bassani L., Danese L., Dean A. J., Di Cocco G., Franceschini A., Hunt L. K., Matteucci F., Palazzi E., Palumbo G. G. C., Rephaeli Y., Salucci P., Spizzichino A., 1998, A&A, 339, L33
- [Petre et al.¡1993¿] Petre R., Mushotzky R. F., Serlemitsos P. J., Jahoda K., Marshall F. E., 1993, ApJ, 418, 644+
- [Primini, Forman & Jones¡1993¿] Primini F. A., Forman W., Jones C., 1993, ApJ, 410, 615
- [Ptak et al.¡1997¿] Ptak A., Serlemitsos P., Yaqoob T., Mushotzky R., Tsuru T., 1997, AJ, 113, 1286
- [Ptak et al.¡1999¿] Ptak A., Serlemitsos P., Yaqoob T., Mushotzky R., 1999, ApJS, 120, 179
- [Read, Ponman & Strickland¡1997¿] Read A. M., Ponman T. J., Strickland D. K., 1997, MNRAS, 286, 626
- [Roberts & Warwick¡2000¿] Roberts T. P., Warwick R. S., 2000, MNRAS in press
- [Roberts, Warwick & Ohashi¡1999¿] Roberts T. P., Warwick R. S., Ohashi T., 1999, MNRAS, 304, 52
- [Sadler, Jenkins & Kotanyi¡1989¿] Sadler E. M., Jenkins C. R., Kotanyi C. G., 1989, MNRAS, 240, 591
- [Sandage & Tammann¡1981¿] Sandage A., Tammann G. A., 1981, A Revised Shapley-Ames Catalog of Bright Galaxies (RSA)
- [Schlegel¡1994a¿] Schlegel E. M., 1994a, AJ, 108, 1893
- [Schlegel¡1994b¿] Schlegel E. M., 1994b, ApJ, 424, L99
- [Schlegel¡1994c¿] Schlegel E. M., 1994c, ApJ, 434, 523
- [Schmidt et al.¡1998¿] Schmidt M., Hasinger G., Gunn J., Schneider D., Burg R., Giacconi R., Lehmann I., MacKenty J., Trumper J., Zamorani G., 1998, aa, 329, 495
- [Schulman & Bregman¡1995¿] Schulman E., Bregman J. N., 1995, ApJ, 441, 568
- [Serlemitsos, Ptak & Yaqoob¡1996¿] Serlemitsos P., Ptak A., Yaqoob T., 1996, in ASP Conf. Ser. 103, The physics of LINERs in view of recent observations, eds, Eracleous M., Koratkar A. P., Leitherer C., Ho L.
- [Simien & De Vaucouleurs¡1986¿] Simien F., De Vaucouleurs G., 1986, ApJ, 302, 564
- [Snowden & Pietsch¡1995¿] Snowden S. L., Pietsch W., 1995, ApJ, 452, 627
- [Stark et al.¡1992¿] Stark A. A., Gammie C. F., Wilson R. W., Bally J., Linke R. A., Heiles C., Hurwitz M., 1992, ApJS, 79, 77
- [Supper et al.¡1997¿] Supper R., Hasinger G., Pietsch W., Truemper J., Jain A., Magnier E. A., Lewin W. H. G., Van Paradijs J., 1997, A&A, 317, 328
- [Takano et al.¡1994¿] Takano M., Mitsuda K., Fukazawa Y., Nagase F., 1994, ApJ, 436, L47
- [Trinchieri & Fabbiano¡1991¿] Trinchieri G., Fabbiano G., 1991, ApJ, 382, 82
- [Trinchieri et al.¡1999¿] Trinchieri G., Israel G. L., Chiappetti L., Belloni T., Stella L., Primini F., Fabbiano P., Pietsch W., 1999, A&A, 348, 43
- [Trinchieri, Fabbiano & Paulumbo¡1985¿] Trinchieri G., Fabbiano G., Paulumbo G. G. C., 1985, ApJ, 290, 96
- [Trinchieri, Fabbiano & Romaine¡1990¿] Trinchieri G., Fabbiano G., Romaine S., 1990, ApJ, 356, 110
- [Van Der Marel, De Zeeuw & Rix¡1997¿] Van Der Marel R. P., De Zeeuw P. T., Rix H.-W., 1997, ApJ, 488, 119
- [Van Der Marel¡1999¿] Van Der Marel R. P., 1999, AJ, 117, 744
- [Van Dyk, Hamuy & Filippenko¡1996¿] Van Dyk S. D., Hamuy M., Filippenko A. V., 1996, AJ, 111, 2017
- [Van Paradijs & McClintock¡1995¿] Van Paradijs J., McClintock J., 1995, in X-ray binaries - Cambridge Astrophysics Series, Cambridge, MA: Cambridge University Press, eds, Lewin W. H., Van Paradijs J., Van Den Heuvel E. P.
- [Vogler & Pietsch¡1999¿] Vogler A., Pietsch W., 1999, A&A, 342, 101
- [Wang, Immler & Pietsch¡1999¿] Wang D., Immler S., Pietsch W., 1999, preprint, astro-ph/9903479
- [Wang¡1999¿] Wang D., 1999, preprint, astro-ph/9903246
- [Williams & Chu¡1995¿] Williams R. M., Chu Y.-H., 1995, ApJ, 439, 132
- [Yee¡1992¿] Yee H. K., 1992, in ASP Conf. Ser. 31, Relationships Between Active Galactic Nuclei and Starburst Galaxies, ed., Filippenko A. V.