The Infrared Jet in 3C 66B
Abstract
We present images of infrared emission from the radio jet in 3C 66B. Data at three wavelengths (4.5, 6.75 and 14.5 ) were obtained using the Infrared Space Observatory. The 6.75 image clearly shows an extension aligned with the radio structure. The jet was also detected in the 14.5 image, but not at 4.5 . The radio-infrared-optical spectrum of the jet can be interpreted as synchrotron emission from a population of electrons with a high-energy break of 41011 eV. We place upper limits on the IR flux from the radio counter-jet. A symmetrical, relativistically beamed twin-jet structure is consistent with our results if the jets consist of multiple components.
keywords:
galaxies: active; galaxies: jets; galaxies: individual: 3C 66B; infrared: galaxies1 Introduction
Jets are common in extragalactic radio sources. They are believed to trace beams of particles and fields ejected from the compact central region at bulk velocities approaching the speed of light, combined with material swept up by the flow, and are usually visualised through the loss of energy as synchrotron radiation. The emission measured at radio frequencies should, in the absence of a high-energy cutoff in the electron energy spectrum, extend to the optical and infrared bands, although optical counterparts are detected for relatively few jets [Martel et al. (1998) list 9 such cases] and an even smaller number of infrared jets have been reported. One noteable exception is the jet in M87 which has been detected in the near-IR (Killeen et al. 1984) and with ISO in the mid-IR (Tansley et al. in preparation).
The radio galaxy 3C 66B has one of the best-studied optical jets. The source has a redshift of 0.0212 (Stull et al. 1975) and is associated with a 13th magnitude elliptical galaxy in a small group in the vicinity of the cluster Abell 347. Its radio structure (Leahy, Jägers and Pooley 1986; Hardcastle et al. 1996) has been studied in detail, and reveals a morphology which is intermediate between an edge-darkened double and a head-tail structure, possibly indicating the effect of the parent galaxy’s motion through the ambient medium.
The optical jet in 3C 66B was first detected by Butcher, van Breugel and Miley (1980). Further ground-based work (Fraix-Burnet, Nieto and Poulain 1989) has revealed the presence of five distinct knots of polarized optical emission along the jet. These correspond to five similar knots in the radio emission. A tentative optical detection of the southern counter-jet was made in the I-band (Fraix-Burnet 1997). This is interesting as it allows the radio-optical spectra in the jet and the counter-jet to be compared. If the simplest twin-relativistic-beam model is valid, then the spectra of the jet and counter-jet should differ in intensity and shape in ways described by a single component synchrotron model.
Hubble Space Telescope (HST) images of 3C 66B (Macchetto et al. 1991) show the optical jet on scales of arcsec, and have revealed an intriguing double-stranded filamentary structure which resembles the radio image at the same resolution. A comparison between HST and VLA data at 0.25 arcsec resolution (Jackson et al. 1993) shows further similarities.
Here we present data obtained with the Infrared Space Observatory111ISO is an ESA project with instruments funded by ESA Member States (especially the PI countries: France, Germany, the Netherlands and the United Kingdom) and with the participation of ISAS and NASA. (ISO) which appear to detect the jet at 6.75 and 14.5 .
Throughout this paper we assume H0=50 km s-1 Mpc-1.
2 Observations and Data Reduction
3C 66B was observed with the European Space Agency telescope ISO as part of a larger project to study infrared emission from the dusty central regions of a sample of 3CRR objects (Tansley et al. in preparation). Observations were carried out with the ISOCAM instrument (ISO’s near-mid IR imaging camera; Kessler et al. 1996, Cesarsky et al. 1996) using the LW1, LW2 and LW3 filters to obtain images in bands 4.00-5.00, 5.00-8.50 and 12.00-18.00 m centred on wavelengths of 4.5, 6.75 and 14.5 , respectively. A pixel scale of 3 arcsecs was selected, and the angular resolution of the data was 3.26, 3.98 and 4.03 arcsecs for the three filters (measured from the supplied PSF libraries), LW1, LW2 and LW3 respectively. The noise levels on the final images are close to the theoretically expected values of 69, 71, 70 Jy for the three filters, respectively.
The data were processed initially using the ISOCAM Consortium/ESA CAM
Interactive Analysis (CIA) package (Ott et al. 1997), running under
the Interactive Data Language, IDL. The data were corrected for
instrumental and cosmic-ray glitch artifacts and also for data
stabilization using the multi-resolution median method.222For
details see: http://isowww.estec.esa.nl/manuals/
HANDBOOK/III/cam_hb/node51.html.
The most recent (15th March, 1998) calibration-library flat-field and dark frames were then applied. The
final calibrated images have unexpectedly “lumpy” backgrounds,
perhaps indicating that the supplied flat-fields were not ideal. Further
details of the analysis are given in Tansley et al. (in preparation)
| Components | Component Flux Density | Goodness of Fit |
|---|---|---|
| mJy | / degrees of freedom | |
| AGN | 4.40.5 | 450.1/60 |
| Galaxy | 8.40.4 | 208.8/58 |
| AGN | 2.00.3 | 157.7/55 |
| + Galaxy | 8.20.4 | |
| One jet point | 0.40.1 | 143.3/52 |
| + AGN | 1.80.3 | |
| + Galaxy | 8.30.4 | |
| Two jet points | 0.80.1 | 135.2/49 |
| + AGN | 0.30.1 | |
| + Galaxy | 2.10.2 | |
| 8.20.4 |
| Component | Position of Component | Offset From Centre |
| RA & Dec | of Galaxy/ arcsecs | |
| Galaxy | , | N/A |
| AGN | , | 0 |
| Jet 1 | , | 13.9 |
| Jet 2 | , | 7.2 |
3 Results and Analysis
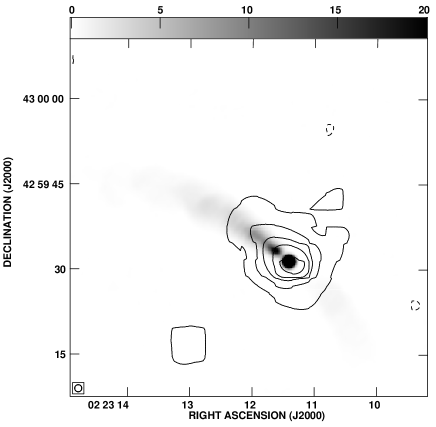
The 6.75 m image can be seen in Figure 1. The contours of this image represent the ISO data and the greyscale is a 1425 MHz VLA image from Hardcastle et al. (1996)
The final calibrated images were fitted with a three-component model, consisting of an extended galactic component (modelled as an elliptical Gaussian based on the optical galaxy as a template), an unresolved AGN component, and a set of one or two unresolved points representing emission from the jet component. The goodness of fit of the model at various stages of complexity is shown for the LW2 data in Table 1. Table 2 shows the positions and central offsets of the best fit components with this filter. Fitting only an extended galactic component or unresolved AGN component gives a significantly worse fit (by =51 and 292 respectively) than a combination of the two. At this stage, a residual map of the ISO LW2 (and LW3) data showed clear evidence for excess emission, with structure significantly different from, and brighter than, the background “lumps”. This excess was to the east of the AGN/galaxy position in the region of the inner radio and optical jet. The overall fit improves further (by =14.4 or 22.5) when one or two unresolved components representing jet emission were added to the model.
Table 3 presents the fitted flux densities in the three ISO filters for the jet components based on the positions derived from the LW2 image. We believe the high values to be caused primarily by inaccuracies in the flat-field calibration frame rather than the model itself: a map of the fitted region is similar to a map of an off-source region in showing patchy (scale 6 - 9 arcsecs) low-level (peaks of 0.1 mJy) residual structure. Although this structure lies above the nominal noise level, it is much fainter than the jet components that we identify: if a post-facto assessment of the image noises is made, based on the final values, the errors on the LW1 and LW2 flux densities would increase by 50 and 68% respectively. Errors in the absolute flux scale can also contribute to uncertainties in the measured flux densities. The ISOCAM documentation quotes an uncertainty in the spectral energy distribution calibration of 5%. Which is much less than the random errors on the jet and is not accounted for in our quoted errors.
Table 4 lists the jet flux densities at radio, IR and optical wavelengths. The radio measurements were taken from images obtained with the VLA at 1.4 and 8 GHz (Hardcastle et al. 1996) integrated over the same regions covered by the IR components. The corresponding I band flux density was taken from the galaxy-subtracted image of Fraix-Burnet (1997) obtained at the Canada-France-Hawaii telescope. The optical flux densities were taken from the HST measurements of Jackson et al. (1993), or measured directly from archival HST data. However, since the field of view (FOV) of the HST Faint Object Camera (FOC) does not include the full extent of the IR emission, we assumed that the radio-optical spectral index of the entire region was equal to that of the observed region and we scaled the measured optical flux densities by a factor 1.66 to correct for the 40% of the radio emission that lies outside the FOC’s FOV.
| Filter | Goodness of Fit | Flux Densities | ||
|---|---|---|---|---|
| / degrees of freedom | Component 1 | Component 2 | Total | |
| (mJy) | (mJy) | (mJy) | ||
| LW1 | 110.0/55 | 0.36 | 0.36 | 0.72 |
| LW2 | 135.2/49 | 0.430.13 | 0.670.18 | 1.100.22 |
| LW3 | 116.0/49 | 1.080.26 | 0.590.18 | 1.660.31 |
| Frequency | Flux Density | Reference |
|---|---|---|
| Hz | mJy | |
| 1.301015 | 0.0061 0.0009 | Jackson et al. 1993 (scaled to |
| account for smaller FOV) | ||
| 9.671014 | 0.0102 0.0016 | Jackson et al. 1993 (scaled to |
| account for smaller FOV) | ||
| 8.801014 | 0.0128 0.0014 | Macchetto et al. 1991 |
| 7.321014 | 0.0184 0.0024 | This paper (from public archive) |
| 3.331014 | 0.111 0.001 | Fraix-Burnet 1997 |
| 6.671013 | 0.72 | This paper |
| 4.441013 | 1.10 0.22 | This paper |
| 2.061013 | 1.66 0.31 | This paper |
| 8.41109 | 105.0 2.7 | Hardcastle et al. 1996 |
| 1.42109 | 315.0 9.0 | Hardcastle et al. 1996 |


4 Discussion
Figure 3 shows the measurements from Table 4 fitted with two separate synchrotron models. In both cases, the volume was assumed to be a simple cylinder (of length 5 kpc and radius 0.5 kpc) along the length of the IR jet. We assumed that the emission arises from a plasma with velocity v=0.7c oriented at 45∘ to the line of sight. These assumptions have only a modest effect on the best-fit field, and are consistent with the beam decomposition discussed later (Section 4).
The simplest spectral shape that fits the data is one in which p=2 (where ) in the radio-optical region that turns down sharply at higher energies to match the optical points. We fitted two synchrotron spectra based on indicative models of the population of relativistic electrons. The first model population has a high energy cutoff at Emax=6.51011eV and an equipartition magnetic field of 3.7 nT. This fit reproduces the optical points badly, giving a spectrum that is too steep. The second model consists of a broken power law population of electrons, where the spectrum breaks from p=2 to p=6 at an energy Ebreak=4.51011eV. The maximum energy in this model is Emax=151011eV, and the same equipartition field of 3.7 nT is present. The broken-power-law model shows a considerably better fit to the optical points (=215 as compared to for the model with no power-law break).
The worst fitting point in both models is the low-frequency radio point, though we attribute this to the presence of steep-spectrum material in the jet, possibly indicative of a two-component flow in the jet structure (discussed later). Similarly, both fits poorly reproduce the I-band data point, though this may merely be a consequence of deficiencies in the simple models since the spectrum near I band is strongly dependent on the shape of the break in the electron spectrum. Of greater interest is the higher-than-expected UV point from the HST observation as this may represent an unmodelled component of the electron energy distribution.
To test whether the flatter optical spectrum is an artifact of our extrapolation of the observed FOC flux densities, fluxes were measured on the radio, I-band and HST images only within the FOV of the FOC. These data points still show a shallower optical spectrum than is predicted by our two models. Thus, the extrapolation of the optical flux over the full radio-jet region is not the cause of the flattening. Furthermore, a U-band observation of 3C 66B using the STIS instrument on HST (Sparks et al. in preparation), covers the full extent of the radio jet and has a flux density that is similar to the scaled Jackson et al. (1993) flux density in the same band.
Forthcoming Chandra X-ray observations of this source will allow us to constrain further the model parameters of the emission; in particular they will show whether the flattening of the spectrum in the optical continues to higher frequencies. If this is true, it may be the case that we are seeing emission in the blue dominated by a newer, flat spectrum component, the origin of which is uncertain. Further observations in the optical and UV would be needed to investigate this.
The counter-jet seen in radio maps of Hardcastle et al. and possibly in the optical images (Fraix-Burnet 1997) is not detected with ISO. Upper limits for the flux densities (Table 5) have been measured using the radio and I-band maps as guides to the emission region. The radio-IR spectral index is found to be 0.5.
Fraix-Burnet (1997) identified several components of the counter-jet which appeared coincident with radio features. The measured radio and optical flux densities of these knots imply that the counter-jet has a flatter radio-to-optical spectrum than the jet. This seems to contradict the usual interpretation of the jet and counter-jet as physically identical, with their brightness asymmetry caused by the relativistic Doppler effect. Our IR upper limits lie above the fluxes that we expect for the counter-jet, based on a simple broken-power-law model with the same parameters as the main jet. This model is plotted with the data in Figure 4. As can be seen, the fit to the optical point in the counter-jet spectrum is poor, and agrees with the finding of Fraix-Burnet (1997) that the spectrum does not conform to that expected if 3C66B was a twin beamed structure with identical jets. Instead, it is possible that either the source is not described by a symmetrical beamed-jet model or that the observed optical structures are not real.
The radio spectrum of the counter-jet spectrum is steeper ( = 0.88) than the radio points of the jet ( = 0.62). A possible explanation could be that we are seeing the superposition of an old population of material (forming a sheath around the jet) combined with newer material recently ejected and passing through the sheath. Evidence for such an enclosing structure has been reported in (for example) Hardcastle et al. (1996), Laing (1996) and Hardcastle et al. (1997) and is also described by O’Dea and Owen (1987) in relation to the radio maps of NGC 1265. As a weak sheath of emission appears at only 1415 MHz in NGC 1265, O’Dea and Owen concluded that the sheath has a steeper spectrum than the jet itself, as would be expected from older material which had undergone spectral ageing. The presence of the sheath is attributed to the diffusion of particles out of the beam into the static external medium.
In this model, we expect the inner component to be travelling faster than the sheath material, so that emission from the inner flow is relativistically-boosted on the jet side and dimmed on the counter-jet side, relative to sheath emission. Hence the spectrum of the counter-jet would be less dominated by the inner material, and consequently steeper. Hardcastle et al. (1996) have produced a polarization intensity map that shows clearly a distinct line of depolarization marking the boundary between the sheath and the inner jet in 3C 66B. Flux-density measurements of the inner and outer regions of the jet show that the inner jet is dimmed on the counter-jet side by a greater amount than the sheath component, as the model predicts.
If we accept this model of the inner beam and outer sheath then we can use the measured flux densities from the radio polarization intensity map to estimate the inner flow and sheath velocities. We can represent the emission from the jet as the sum of emission components.
where is the bulk relativistic Doppler factor:
is the emissivity of the material, V is the volume of the emitting region and is the spectral index of the region (either sheath or inner). is the orientation angle to the line of sight and is the ratio of the velocity to the speed of light, . Measuring equal volumes on both sides and equating each component, we find and (using =0.62 and measured from the jet and counter-jet radio spectral indices respectively and an orientation angle to the line of sight, = 45∘).
The observed steepness of the spectrum of the counter-jet in the radio initially places doubt on the association of the I-band detections with material in the jet itself. However, if the multi-component model proposed here is accepted, then at higher frequencies the counter-jet may be dominated by the inner jet rather than the steeper spectrum sheath, despite the relativistic dimming of the inner jet. Using this assumption, we can perform a simple calculation to test whether the optical flux of the counter-jet from the Fraix-Burnet image is what we expect to observe. In fact, using the Doppler parameters of the inner jet, the optical spectral index of =1.4 (Jackson et al. 1993) and the flux density measurement from the corresponding frequency in the jet, we find an expected flux density of 2 Jy, much lower than the flux of 7 Jy measured by Fraix-Burnet (1997).
5 Conclusions
We have made the first mid-IR detection of emission from a radio jet. Fits to synchrotron models using radio and optical data points have shown that the overall spectral-energy distribution of 3C 66B resembles a simple synchrotron spectrum from the radio to the optical, though the optical slope is unexpectedly flat, perhaps because of inhomogeneities in the jet. The counter-jet in 3C 66B is not detected in our data. The jet and counter-jet spectra can be interpreted in terms of a model in which the beam structure is composed of a slow-moving (=0.2), steep-spectrum component and a faster-moving (=0.7), flatter-spectrum component, a conclusion supported by radio images of polarised emission from the jet structure.
| Frequency | Flux Density | References |
|---|---|---|
| Hz | mJy | |
| 3.331014 | 0.007 | Measured from the maps of |
| Fraix-Burnet 1997 | ||
| 6.671013 | 0.16 | This paper. |
| 4.441013 | 0.15 | This paper. |
| 2.061013 | 0.29 | This paper. |
| 8.41109 | 15 | Measured from the maps of |
| Hardcastle et al. 1996 | ||
| 1.42109 | 73 | Measured from the maps of |
| Hardcastle et al. 1996 |

6 Acknowledgments
We would like to thank Didier Fraix-Burnet for kindly allowing us to use his I-band images of 3C 66B. The ISOCAM data presented in this paper was analysed using ‘CIA’, a joint development by the ESA Astrophysics Division and the ISOCAM Consortium. The ISOCAM Consortium is led by the ISOCAM PI, C. Cesarsky, Direction des Sciences de la Matière, C.E.A., France.
References
- [1] Butcher, H. R., van Breugel, W. Miley, G. K. 1980 ApJ 235 749
- [2] Cesarsky, C. J. et al. 1996 A&A 315, L32
- [3] Fraix-Burnet, D., Nieto, J.-L., Poulain, P. 1989 A&A 221 1
- [4] Fraix-Burnet, D., Golombek, D., Macchetto, F. D. 1991 AJ 102 562
- [5] Fraix-Burnet, D. 1997 MNRAS 284 911
- [6] Hardcastle, M. J., Alexander, P., Pooley, G. G., Riley, J. M. 1996 MNRAS 278 273
- [7] Hardcastle, M. J., Alexander, P., Pooley, G. G., Riley, J. M. 1997 288 L1
- [8] Jackson, N., Sparks, W. B., Miley, G. K., Macchetto, F. 1993 A&A 269 128
- [9] Kessler, M. F., Steinz, J. A., Anderegg, M. E., Clavel, J., Drechsel, G., Estaria, P., Faelker, J., Riedinger, J. R., Robson, A., Taylor, B. G., Ximinez de Ferran, S. 1996 A&A 315 L27
- [10] Killeen, N. E. B., Bicknell, G. V., Hyland, A. R., Jones, T. J. 1984 ApJ 280 126
- [11] Laing, R. A. 1996 in Hardee, P. E., Bridle, A. H., Zensus, J. A. eds, Energy Transport In Radio Galaxies and Quasars, ASP Conf. Ser. Vol. 100 p. 241
- [12] Leahy, J. P., Jägers, W. J., Pooley, G. G. 1986 A&A 156 234
- [13] Macchetto, F., Albrecht, R., Barbieri, C., Blades, J. C., Boksenberg, A., Crane, P., DeHarving, J. M., Disney, M. J., Jakobsen, P., Kamperman, T. M,, King, I. R., Mackay, C. D., Paresce, F., Weigelt, G., Baxter, D., Greenfield, P., Jedrzejewski, R., Nota, A., Sparks, W. B., Miley, G. K. 1991 ApJ 373 55
- [14] Martel, A. R., Sparks, W. B., Macchetto, D., Biretta, J. A., Baum, S. A., Golombek, D., McCarthy, P. J., De Koff, S., Niley, G. K. 1998 ApJ 406 203
- [15] O’Dea, C. P., Owen, F. N. 1987 ApJ 316 95
- [16] Ott, S. et al. 1997 ASP Conf. Ser. 125 34
- [17] Stull, M. A., Price, K. M., Daddario, L. R., Wernecke, S. J., Graf, W., Grebenkemper, C. J. 1975 AJ 80 559