Stellar indices and kinematics in Seyfert 1 nuclei
Abstract
We present spectra of 6 type 1 Seyfert galaxies, 2 Seyfert 2, a starburst galaxy and a compact narrow line radiogalaxy, taken in two spectral ranges centered around the near–IR Ca ii triplet ( 8600Å ), and the Mgb stellar feature at 5180Å. We measured the equivalent width (EWs) of these features and the Fe52 and Fe53 spectral indices.
We found that the strength of the IR Ca ii triplet (CaT) in type 1 Seyfert galaxies with prominent central point sources, is larger than what would be expected from the observed strength of the blue indices. This could be explained by the presence of red supergiants in the nuclei of Seyfert 1 galaxies. On the other hand, the blue indices of these galaxies could also be diluted by the strong Fe ii multiplets that can be seen in their spectra.
We have also measured the stellar and gas velocity dispersions of the galaxies in the sample. The stellar velocity dispersions were measured using both, the Mgb and CaT stellar features. The velocity dispersion of the gas in the narrow line region (NLR) was measured using the strong emission lines [O iii] 5007, 4959 and [S iii] 9069. We compare the gas and star velocity dispersions and find that both magnitudes are correlated in Seyfert galaxies.
Most of the Seyfert 1 we observe have stellar velocity dispersion somehow greater than that of the gas in the NLR.
keywords:
galaxies: active – galaxies: kinematics and dynamics – galaxies: nuclei – galaxies: Seyfert – galaxies: stellar content.1 Introduction
The presence of young massive stars in the nuclear regions of Seyfert galaxies was strongly suggested by the detection of the near–IR absorption Ca ii triplet ( 8600Å) (CaT) in a sample of active galactic nuclei by Terlevich, Díaz & Terlevich [1990] (hereafter TDT90). This stellar feature depends strongly on gravity and only weakly on metallicity, and is known to be specially strong in young red supergiants (Jones, Alloin & Jones 1984; Díaz, Terlevich & Terlevich 1989). The analysis of this feature led TDT90 to conclude that strong starbursts should be present in the nuclei of Seyferts 2, since, despite the weakness or dilution observed in the blue stellar absorption lines, the CaT was found to be very strong in the nuclear spectra of the twelve galaxies of this type that were observed. Moreover, the only three Seyfert 1 galaxies included in their sample also show CaT in absorption, suggesting at least some contribution by a young stellar population.
Subsequent IR spectroscopy (1.5 to 2.3 m) of normal and active galaxies performed by Oliva et al. (1995) allowed them to conclude that the Seyfert 2 nuclei of their sample were compatible with evolution from a pre-cursor starburst. They also find that the 1.6 to 2.3 m stellar continuum of Seyfert nuclei is too red to be accounted for by a non-thermal continuum but is compatible with reprocessed radiation from hot dust.
Cid Fernandes & Terlevich (1992;1993;1995), in a critical analysis of the simple unified scenario [1993], proposed that the observed strong CaT in Seyfert type 2 galaxies with strong and blue optical continuum plus the absence of broad lines combined with the low continuum polarization, were the result of the presence in the nuclear region of unpolarized starlight from very young stars, i.e. a nuclear/circumnuclear starburst or star forming toroid. This simple suggestion seems able to overcome most of the difficulties faced by the basic unified model for Seyfert 2, while preserving its attractive features.
Schmitt, Storchi–Bergmann & Cid Fernandes [1999] have recently found that the spectra of many Seyfert 2 can be modelled by the sum of the spectra of a young stellar cluster (age 100 Myr) and an old one (age 10 Gyr), and that these models reproduce the observations better than the traditional ones consisting of a blue featureless continuum (BFC) and an old stellar population, thus confirming Cid Fernandes & Terlevich suggestions.
The question about the origin of the nuclear continuum in Seyfert 2, has given rise to searches of young stars in their nuclei. Heckman et al. [1997] and Gónzalez Delgado et al. [1998] have presented high resolution UV images, taken with the HST, of 4 Seyfert 2 galaxies, finding compact nuclear starbursts in all of them. They have also found spectral features from young hot stars in the UV spectra of these 4 galaxies. Their main conclusion is that, in all the galaxies they have studied, the observed continuum is exclusively due to a nuclear/circumnuclear young starburst and the energy emitted by the nuclear starburst is, at least, of the same order as the one produced by the buried AGN. Powerful starbursts have also been found in the nuclei of several LINERS by Colina et al. [1997] and Maoz et al. [1998] and very recently in a QSO by Brotherton et al. [1999].
If the results presented above can be generalized to all type 2 Seyferts then, we could conclude that nuclear starbursts ought to play an important role in the total energy emitted in their nuclear regions. Furthermore, since in unified models Seyferts 1 and 2 are not physically different kinds of object, but the consequence of a different viewing angle, one can conclude that, if nuclear starbursts are found to be energetically important in Seyfert 2, so they should be in Seyfert 1.
However, the starbursts in Seyfert 1 nuclei, if present, may be somewhat different from those in Seyfert 2: the narrow H + [N ii] emission in Seyfert 2 galaxies is more extended than in Seyfert 1 hosts (Pogge 1989; González Delgado & Pérez 1993). Also, the galaxies with type 2 Seyfert nuclei have enhanced infrared emission from their disks compared to those with type 1 nuclei or with normal spiral galaxies [1995]. From their near–IR observations Oliva et al. [1995] found that the ratio in Seyfert 1 is similar to the one shown by normal early type spiral galaxies, whereas this ratio is found to be lower in Seyfert 2, pointing to younger stellar populations. Also, González Delgado et al. [1997] found that circumnuclear star-forming rings are more common in Seyfert 2 than in Seyfert 1. Moreover the few UV HST images that exist of type 1 Seyferts do not show compact starbursts in their nuclei but point sources.
In this paper we use the fact that the nuclear light output in Seyfert 1 galaxies has little contamination from the surrounding bulge to search for signatures of a nuclear starburst. If, for example, strong CaT absorptions were detected in the unresolved nuclear component, because of the limited surface brightness, they could not be due to bulge contamination. A starburst signature should be possible to detect, even in the presence of a dominant nuclear component. In other words, if the result from Heckman et al. [1997] and González Delgado et al. [1998] can be generalized – i. e. that the luminosity of the starburst is equal or larger than that of the AGN – then the surface brightness of the stellar population giving rise to the CaT feature should be much higher than that from the old bulge component in order to be detected on top of the dominant AGN spectrum and therefore detectable in the presence of the nuclear continuum.
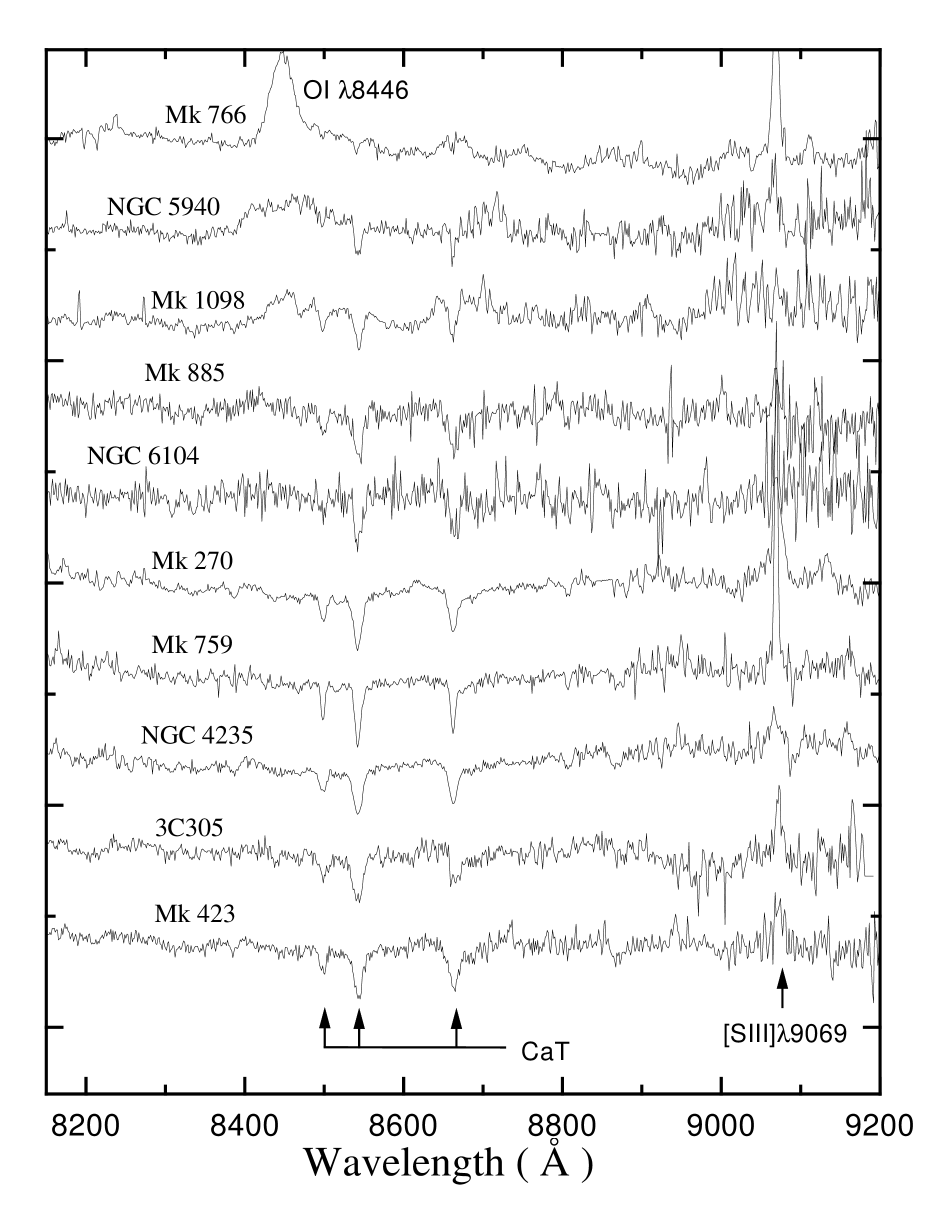
We have looked for signatures of young stars in the optical/NIR spectra of 6 type 1 Seyfert galaxies. Although, in principle, the UV would be the best spectral band to detect absorptions from young stars, the strong broad line region (BLR) contamination at the wavelengths of the stronger stellar features ([C iv] 1550 Å, [Si iv] 1400 Å) makes this method not viable. On the other hand, as discussed by TDT90, the region around the near–IR CaT is relatively free of strong emissions. 111The O i 8400 Å and the [Fe II] 8617 Å lines are exceptions to this. The first line is broad and prominent in luminous Seyfert 1 galaxies, while the second one is narrow and seems to be present in some starburst and Seyfert 2 galaxies.
It is known that the stellar kinematics in the nuclei of Seyfert galaxies is similar to that of normal spiral galaxies, since both kinds follow the same Faber–Jackson relation (TDT90; Nelson & Whittle 1996). It is also known that the gas motions in the narrow line region (NLR) of Seyfert galaxies seem to be dominated by the gravitational field of the bulge, since the width of the [O iii] 5007 emission line is correlated with the nuclear stellar velocity dispersion (Wilson & Heckman 1985; TDT90; Nelson & Whittle 1996). TDT90 found a small population of type 2 Seyfert galaxies with gas velocities much larger than the stellar ones. The existence of this population was confirmed by Nelson & Whittle [1996].
The kinematics of the stars and gas in the nuclei of our sample galaxies was also studied in this paper, improving previous results by adding 6 new Seyfert 1 galaxies to the above refered samples.
| 5100 Å | 8700 Å | |
|---|---|---|
| Dates | 3–4 May 1991 | 3–4 May 1991 |
| Telescope | WHT | WHT |
| Spectrograph | ISIS | ISIS |
| Grating | 600B | 316R |
| Detector | CCD TEK 1 | CCD TEK 2 |
| Filter | — | CG495 |
| Spectral range | 4706–5607 Å | 7983–9573 Å |
| Dispersion | 0.73 Å pixel-1 | 1.39 Å pixel-1 |
| Spatial scale | 0.3 arcsec pixel-1 | 0.3 arcsec pixel-1 |
| Slit width | 1.04 arcsec | 1.04 arcsec |
| Galaxy | Alternate | R.A. | Decl. | P.A. | Night | Exposure | |
|---|---|---|---|---|---|---|---|
| Designation | (1950) | (1950) | (∘) | (Å) | (s) | ||
| NGC 4235 | IC 3098 | 12 14 36 | + 07 28 09 | 70 | 2 | 5100 | 3600 |
| 8700 | 3600 | ||||||
| NGC 5940 | UGC 9876 | 15 28 51 | + 07 37 38 | 70 | 2 | 5100 | 3600 |
| 8700 | 3600 | ||||||
| NGC 6104 | UGC 10309 | 16 14 40 | + 35 49 50 | 83 | 1 | 5100 | 3600 |
| 8700 | 3600 | ||||||
| Mk 270 | NGC 5283 | 13 39 41 | + 67 55 28 | 70 | 2 | 5100 | 3600 |
| 8700 | 3600 | ||||||
| Mk 423 | MCG 6-25-72 | 11 24 07 | + 35 31 34 | 170 | 1 | 5100 | 5400 |
| 8700 | 5400 | ||||||
| Mk 759 | NGC 4152 | 12 08 05 | + 16 18 41 | 35 | 2 | 5100 | 3600 |
| 8700 | 3600 | ||||||
| Mk 766 | NGC 4253 | 12 15 55 | + 30 05 27 | 108 | 1 | 5100 | 5400 |
| 8700 | 5400 | ||||||
| Mk 885 | — | 16 29 43 | + 67 29 06 | 90 | 1 | 5100 | 3600 |
| 8700 | 3600 | ||||||
| Mk 1098 | — | 15 27 37 | + 30 39 24 | 70 | 2 | 5100 | 3600 |
| 8700 | 3600 | ||||||
| 3C305 | IC 1065 | 14 48 18 | + 63 28 36 | 57 | 1,2 | 5100 | 3600 |
| 8700 | 3600 |
2 Observations and data reductions
High resolution long-slit spectra from the galaxies of our sample were obtained in 1991 May during two observing nights with the WHT telescope at the Roque de los Muchachos Observatory, in the Spanish island of La Palma. Details concerning the set-up for the observations can be found in Table 1. We used the two arms of the ISIS spectrograph to take, simultaneously two spectra of each galaxy in different spectral ranges. We observed 11 galaxies. One of them (the radiogalaxy Hydra A) is not included in this work because of the poor quality of its spectra. Two different exposures of 30 min.(three in some objects, see Table 2) were taken on each galaxy. This allowed us to clean the spectra of cosmic ray events. Beside the galaxies of the sample, we also observed several stars for flux calibration, subtraction of water vapour bands, and velocity measurements.
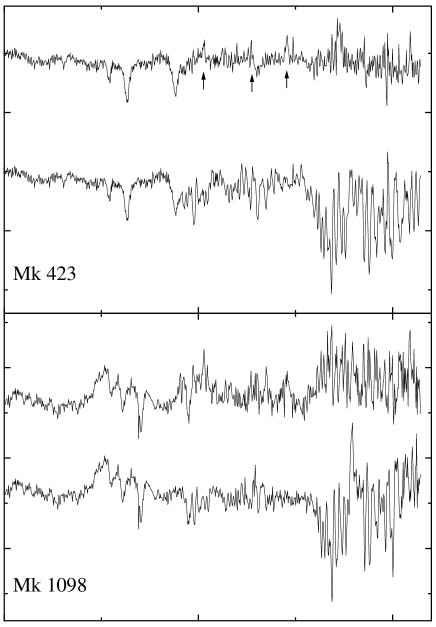
The reduction of the data was done using standard tools in the iraf package. The reduction process was performed fully in two dimensions and consisted of several steps: bias subtraction, flat-fielding, cosmic-rays cleaning, wavelength and flux calibration and, finally, sky subtraction. This last step was the most difficult one, at least for the near–IR spectra since, in the spectral range covered by these spectra, there are many atmospheric absorption and emission bands. The emission features were eliminated by subtracting spectra of the sky from those of the galaxies. The elimination of the OH and water absorption bands was achieved by dividing by the spectrum of a standard star. This procedure is not perfect. It has two main problems. The first one is that atmospheric conditions change during the night. The second one is that the absorption lines of the star cannot be eliminated when they coincide with the atmospheric absorption lines. For this reason, when dividing the galaxy spectra by the stellar one, there often appear weak pseudo-emission lines that have their origin on photospheric absorption lines in the stellar spectrum. In Fig. 1 we can see two examples of the results of the correction procedure. In Mk 1098, observed during the first night, we can see that the original strong absorption bands appear, after division, like weak “emission bands”. This can be due to changes in the atmospheric conditions during the night. In Mk 423, observed during the second night, weak narrow “emission lines” can be seen due to absorption lines in the spectrum of the star.
One dimensional spectra were extracted at the end of the reduction process by adding the ten central pixels. This corresponds to 3 arcsec. The average seeing was about 1 arcsec.
The spectra were not corrected for galactic reddening.
| Galaxy | Type | Resolved | Morph. | |||||
|---|---|---|---|---|---|---|---|---|
| (1) | (2) | (3) | (4) | (5) | (6) | (7) | (8) | (9) |
| NGC 4235 | Sy 1 | yes | SA(s)a | 1.0 0.3 | 2343 33 | 11.93 | -20.5 | -19.5 0.6 |
| NGC 5940 | Sy 1 | no | SBab | 2.0 0.9 | 10172 21 | 14.13 | -21.5 | -20.3 2.8 |
| NGC 6104 | Sy 1.5 | yes | S? | — | 8382 50 | 14.04 | -21.2 | — |
| Mk 270 | Sy 2 | yes | S0? | -2.0 1.7 | 3165 86 | 14.12 | -19.0 | -18.5 1.5 |
| Mk 423 | Sy 1.9 | yes | S0? | — | 9652 11 | 14.63 | -20.9 | — |
| Mk 759 | H ii | yes | SAB(rs)c | 5.0 0.3 | 2066 46 | 12.38 | -19.8 | -17.3 1.8 |
| Mk 766 | Sy 1.5 | no | SB(s)a | 1.0 0.6 | 3819 25 | 13.74 | -19.8 | -18.8 1.3 |
| Mk 885 | Sy 1.5 | yes | S? | — | 7593 30 | 14.86 | -20.2 | — |
| Mk 1098 | Sy 1.5 | — | S? | — | 10710 49 | — | — | — |
| 3C305 | NLRG | — | SB0 | -2.0 0.8 | 12423 53 | 14.43 | -21.7 | -21.1 0.7 |
3 Notes on individual objects
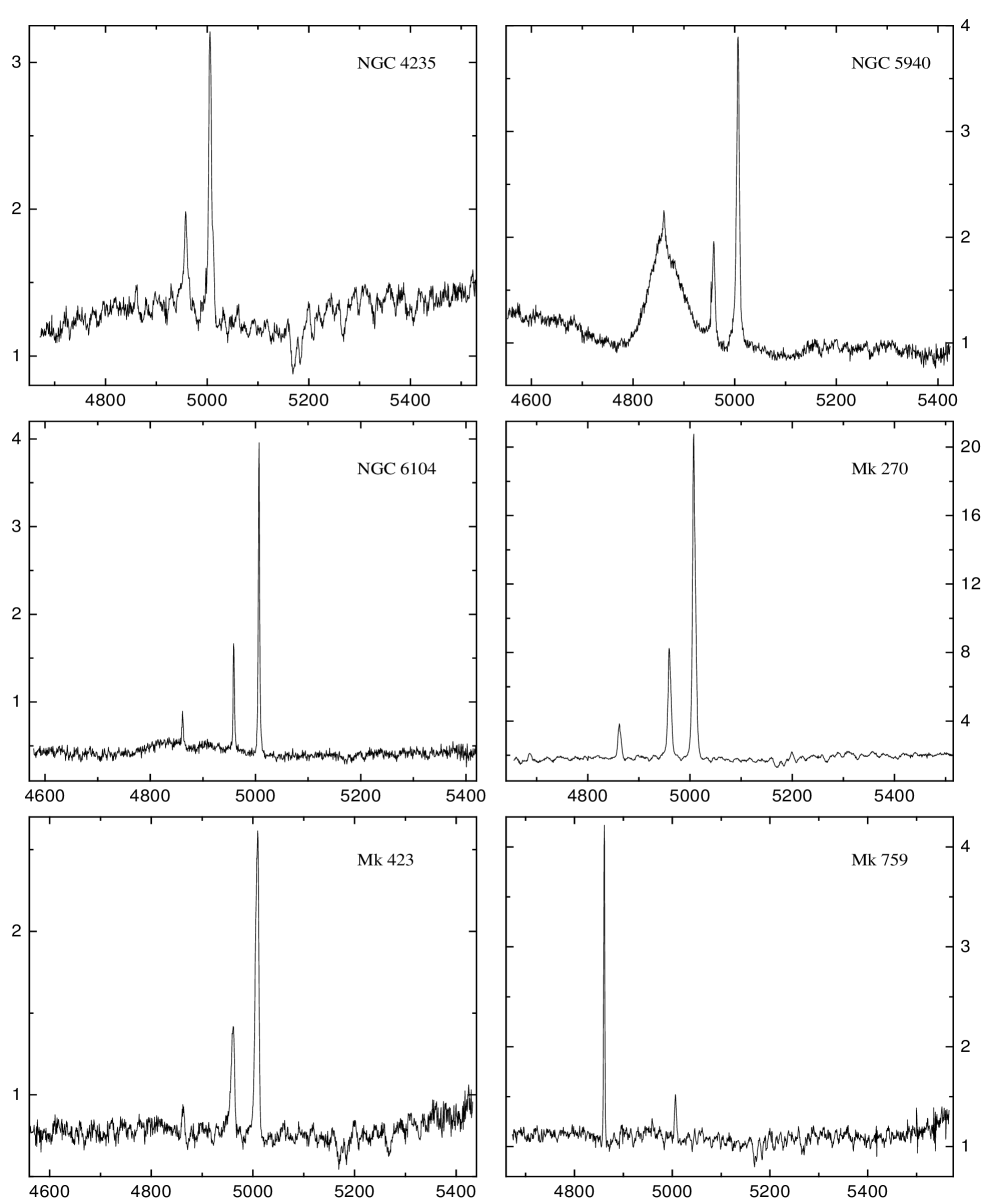
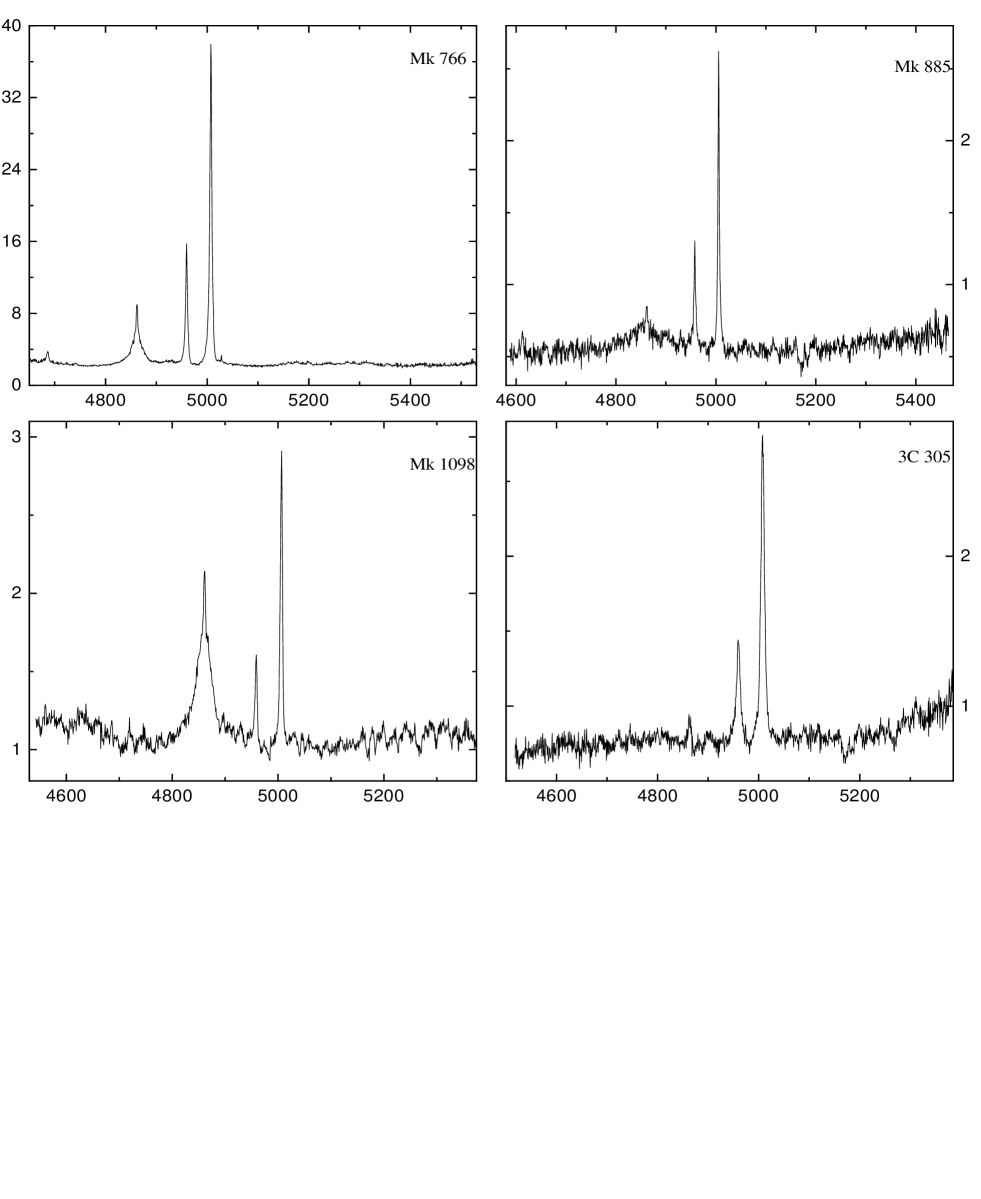
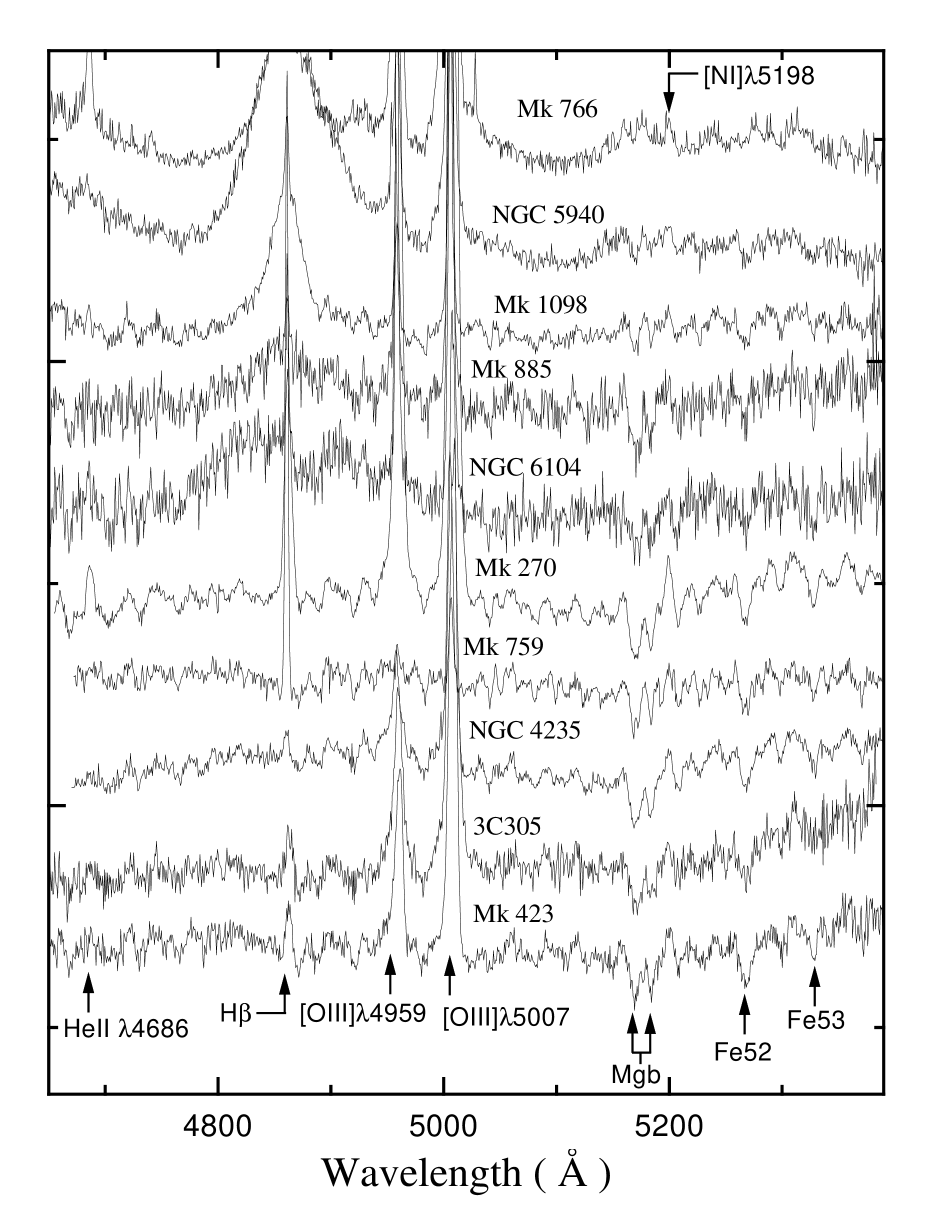
The main physical properties of the 10 galaxies of the sample are given in Table 3. The redshift of the sample covers a range 0.007 – 0.041 and therefore a factor of 4 in size. Their nuclear blue spectra can be seen in Figs. 2 and 3. In this last figure, the spectra are enlarged in order to show the stellar features in the nuclei of the galaxies. The near–IR spectra are shown in Fig. 4. The CaT is seen in absorption in all of the nuclei, even in that of Mk 766, where it is detected also in emission.
3.1 NGC 4235
NGC 4235 is classified as a Seyfert 1 galaxy in the literature (Abell, Eastmond & Jenner 1978; Morris & Ward 1988). This is a nearly edge-on spiral galaxy and its nuclear emission is strongly reddened by the dust in the spiral arms of the galaxy [1978]. It has a spatially resolved nucleus, bisected by a dust lane [1998] and extended radio-emission spread on both sides of the galaxy [1996a] with a compact radio core (Ulvestad & Wilson 1984b; Kukula et al. 1995). The galaxy presents optical emission lines extended along the major axis (Pogge 1989; Colbert et al. 1996b).
3.2 NGC 5940
NGC 5940 is a barred spiral galaxy with an unresolved point source in the nucleus [1998]. It is a prototypical Seyfert 1 galaxy with broad permitted emission lines like H and O i 8446 and it is also a strong Fe ii emitter. The multiplets of Fe ii form two big bumps in the spectrum of NGC 5940, one around 4600Å in the blue edge of the spectrum (see Fig. 3), and the other one between 5150Å and 5250Å. The first of these bumps is due to multiplets (37) and (38), while the second one is due to multiplets (42), (48) and (49) [1977]. Besides strong emission lines, many stellar absorption features can be seen in its spectra: the Mgb, Fe52 and Fe53 features are clearly visible. The near–IR spectrum of NGC 5940 is affected by problems with sky subtraction, and the third line of the CaT has been nearly lost. A comparison with older spectra [1988] indicates that the galaxy has not suffered violent changes in the last years.
3.3 NGC 6104
NGC 6104 shows a spatially resolved nucleus, a nuclear bar and a strongly disturbed spiral pattern that can appear like a ring in low resolution images [1998]. There are not good quality images of the external region; the image in the Digital Sky Survey presents a highly disturbed appearance.
Our spectrum shows that it could be classified as a Seyfert 1.5 to 1.8 galaxy. Most striking about this spectrum is the shape of the spectral lines. The broad component of H shows an asymmetrical double-peaked shape and the forbidden emission lines are very narrow, and are only marginally resolved.
3.4 Mk 270
This is a nearly face-on S0/E galaxy. It shows filaments, wisps and dust lanes in its inner regions [1998]. It has extended [O iii] and H emission elongated at P.A. = 58∘ (Haniff, Wilson & Ward 1988; Mulchaey, Wilson & Tsvetanov 1996). It has also two weak radio-components on both sides of the nucleus elongated in the same direction as the extended optical emission (Ulvestad & Wilson 1984a; Kukula et al. 1995).
3.5 Mk 423
Mk 423 is classified in the literature as a type 1.9 Seyfert galaxy [1981]. Our spectra confirm that H has no broad component.
This galaxy is interacting with a nearby companion [1998]. In the literature it is often included among Markarian galaxies with multiple nuclei (e.g. Nordgren et al. 1995). Mk 423 and its companion have both extended emission line regions seen in [O iii] and H [1985]. Our blue spectrum of the companion suggests an H ii galaxy classification. The radio core of Mk 423 is partially resolved [1986].
One interesting feature in the spectrum of this galaxy is the broad absorption wings of H, suggesting the presence of young main sequence stars. Rudy, Cohen & Puetter [1985] found a moderately strong UV continuum in the 1200–2000 Å spectrum but no signs of broad emission lines. This UV continuum emission could be produced by the same young stars that produce the broad absorption wings of H.
3.6 Mk 759
Mk 759 is the only starburst galaxy in our sample, included for comparison purposes. H has broad absorption wings, indicating the presence of young stars.
3.7 Mk 766
Mk 766 is a barred spiral galaxy. HST images [1998] show filaments, wisps and irregular dust lanes around an unresolved nucleus. It has a partially resolved radio-core with an extension to the north. The total size of the source is 200 pc [1984a]. The polarization angle of the light emitted by Mk 766 is approximately perpendicular to the radio axis [1989]. The optical emission is extended (González–Delgado & Pérez 1996; Mulchaey et al. 1996) through a region whose total size is greater than that of the radio-source. In X-rays, it is variable on a few hours time-scale, and presents a strong soft X-ray excess (Molendi, Maccacaro & Schaeidt 1993). Molendi & Maccacaro [1994] asserted that the soft X-rays excess and the hard X-ray emission are produced by two distinct mechanisms. Nandra et al. [1997] reported the detection of a Fe K line in the X-ray spectrum.
It is classified as a narrow line Seyfert 1 galaxy [1985]. Much work has been done on its emission spectrum (e.g. Veilleux 1991). The most thorough one is by González–Delgado & Pérez [1996]. Mk 766 is the only galaxy in the sample that shows CaT in emission [1988]. Interestingly, in our spectrum, as in the one by González Delgado & Pérez [1996], the CaT is also seen in absorption (see Fig 4).
3.8 Mk 885
Mk 885 is a barred spiral galaxy [1991], classified as a 1.5 Seyfert galaxy. Our spectra of this galaxy are not very good, but we can confirm the results from Osterbrock & Dahari [1983] that the nuclear spectrum has stellar absorption features. Its nucleus is spatially resolved [1998] at HST resolution.
3.9 Mk 1098
There are no good images from this galaxy available and its morphological parameters are not well known. The nuclear spectrum of Mk 1098 looks like that of NGC 5940, but with permitted emission lines weaker and narrower than those of the latter. It is a moderately strong Fe ii emitter. The most striking feature in the spectra of this galaxy is the strange shape of the feature that forms the O i 8446 emission line and the CaT. While part of this could be due to a poor sky subtraction (see Fig. 1), the CaT might also be in emission in the nucleus.
3.10 3C 305
This galaxy is the only radio galaxy in our sample. Its blue spectrum is very similar to the one of Mk 423. The results will be presented elsewhere.
4 Measurements
4.1 Line Strengths
4.1.1 Definitions
Our central interest is to measure the strength of optical and NIR stellar absorption features. For that we follow TDT90 approach and measure ‘pseudo-equivalent widths’.
The definition of the pseudo-equivalent width of a spectral index is:
where is the width of the central window and is the mean flux in that band-pass. is the value of the pseudo-continuum in the central wavelength . The pseudo-continuum is defined by interpolation of the flux in two continuum band-passes:
where and are the mean values of the flux in the continuum windows and and are their central wavelengths. Hereafter, pseudo-equivalent widths will be called equivalent widths (EWs) for simplicity.
Table 4 gives the definition of the relevant continuum and central band-passes. Those corresponding to the blue indices are taken from the Lick system (e.g. Gorgas et al. 1993), whereas those of the CaT are taken from TDT90.
The errors of the EWs were calculated using a simplified version of the photon statistic method. The measured r.m.s. of the spectra in the continuum band-passes, were taken as the errors of the mean values of the continuum in these bands. The errors of the EWs were then calculated by propagating errors from the above expressions [1997]. These errors are thus only lower limits.
| Index | Continuum blue band-pass | Central band-pass | Continuum red band-pass |
|---|---|---|---|
| (Å) | (Å) | (Å) | |
| Fe52 | 5235.50 – 5249.25 | 5248.00 – 5286.75 | 5288.00 – 5319.25 |
| Fe53 | 5307.25 – 5317.25 | 5314.75 – 5350.50 | 5356.00 – 5364.75 |
| Mgb | 5144.50 – 5162.00 | 5162.00 – 5193.25 | 5193.25 – 5207.00 |
| Mgb opt. 1 | 5144.50 – 5162.00 | 5162.00 – 5193.25 | 5207.00 – 5221.00 |
| Mgb opt. 2 | 5144.50 – 5162.00 | 5162.00 – 5193.25 | 5220.00 – 5234.00 |
| CaT 1 | 8447.50 – 8462.50 | 8483.00 – 8513.00 | 8842.50 – 8857.50 |
| CaT 2 | 8447.50 – 8462.50 | 8527.00 – 8557.00 | 8842.50 – 8857.50 |
| CaT 3 | 8447.50 – 8462.50 | 8647.00 – 8677.00 | 8842.50 – 8857.50 |
4.1.2 Broadening correction
The velocity dispersion of the stars broaden the absorption lines in the spectra of galaxies; therefore the central band-passes of the indices may not contain the complete feature. A correlation exists between the velocity dispersion of a given galaxy and the EWs of the absorption lines in the integrated spectrum and a correction for this effect is needed. For more details see TDT90.
4.1.3 Emission line effects
The Mg2 index is more affected than the Mgb by the presence of emisssion lines in AGNs, so we have measured Mgb.
The [N i] 5198 doublet inside the red continuum band-pass of the Mgb index still remains a problem. One method to solve it is to eliminate the line of [N i] [1996]; another one is to use optional band-passes. The correction factors for the optional definitions of the Mgb index are very close to unity.
To measure the EW of the Mgb two optional band-passes, defined in Palacios et al. [1997] were used. Whithout applying any correction, the two measurements were averaged to find the EW of the Mgb index. To test the validity of the method, the emission lines in the spectra of two of the galaxies: NGC 4235 and Mk 270 were eliminated. Of all of the galaxies in the sample, these are the ones that have the oldest stellar population. Their spectrum looks like that of a red giant star. Three spectra of K type stars, taken the same night as the spectra of the galaxies, were combined to form a template calibration star. Using an iterative procedure [1998] the ranges affected by emission lines in the spectrum of the galaxies were fitted and replaced. The measurements obtained with this method in Mk 270 and NGC 4235 are the same as those obtained by using our optional windows.
In the near–IR spectra, the problems are due to the presence of the broad emission line O i 8446 in the blue continuum band-pass of the CaT indices, and to residuals of the sky subtraction in the red band-passes.
Fortunately, the broad emission O i 8446 was a problem only in two galaxies: NGC 5940 and Mk 1098. For these, we fitted two gaussians to the broad component of H in both galaxies, and eliminated the O i line by taking these gaussians as an initial fit. The O i emission line in NGC 5940, could be properly subtracted with only small modifications to the original gaussians. Mk 1098 O i line could only be fitted by one of the gaussians.
The red band-passes of the CaT indices were manually cleaned in all of the spectra to eliminate the residuals of the sky subtraction.
Mk 766 is a special case. It shows many broad emission lines in the near–IR (O i 8446 and some lines of the Paschen series; even the CaT is in emission). The stellar features in the blue are also completely diluted. No stellar feature could therefore be measured in this galaxy.
4.1.4 Results
The EWs of the different lines for the galaxies in the sample are given in Table 5, both corrected and non-corrected for broadening. This correction is smaller than the error in all galaxies. In the analysis of the next section, the corrected values are used. For Mgb we use the results obtained with optional band-passes. For consistency with previous work (TDT90), hereafter we call CaT index the sum of the EWs of the second and third lines of the CaT: CaT (2+3). The EW of the third line of the CaT in NGC 5940 is only a lower limit due to the effect on this line of the atmospheric absorption bands (see Fig. 4).
4.2 Velocity Dispersions
4.2.1 Stellar velocity dispersions
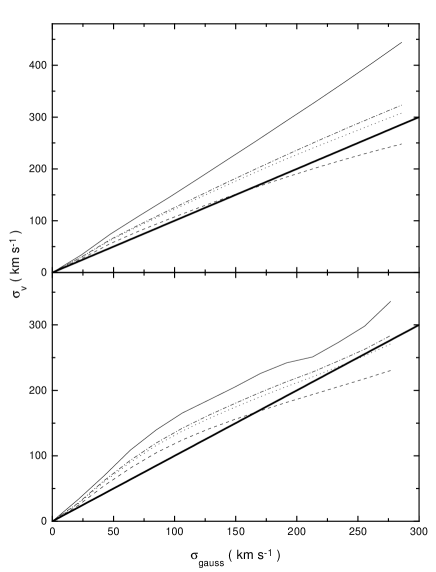
To measure stellar velocity dispersions, we used the cross-correlation method described by Tonry & Davis [1979]. This method gives small systematic errors when directly applied, as can be seen in Fig. 5. In this figure we represent the velocity dispersion computed for a broadened stellar spectrum applying the cross–correlation method, vs. the width of the gaussian used to broaden it. It is clear form the figure that, no matter how the correlation function is filtered, the method always gives small errors. To correct this effect, 6th order empirical correction curves were calculated (Nelson & Whittle 1995; Palacios et al. 1997).
Several correlation functions were calculated for every galaxy. We filtered each function in different ways, measured the width of the respective central peaks and applied the corresponding correction curve to each measurement. Finally, the velocity dispersion of the galaxy was obtained by averaging all the measurements.
Two independent measurements of the velocity dispersion of each galaxy were obtained, using the blue and the near–IR spectra respectively.
| NGC 4235 | NGC 5940 | NGC 6104 | Mk 270 | Mk 423 | Mk 759 | Mk 885 | Mk 1098 | 3C 305 | |
|---|---|---|---|---|---|---|---|---|---|
| Index | EW (Å) | EW (Å) | EW (Å) | EW (Å) | EW (Å) | EW (Å) | EW (Å) | EW (Å) | EW (Å) |
| H | -35 | -85 | -40 | — | — | — | -35 | -45 | — |
| [O iii] 5007 | -13.60.9 | -261 | -352 | -814 | -231 | -2.00.1 | -171 | -10.60.6 | -27.70.6 |
| Fe52 | 2.70.3 | 0.70.3 | 1.60.6 | 2.50.3 | 2.40.4 | 1.80.3 | 1.50.5 | 1.80.3 | 2.20.4 |
| Fe53 | 2.40.3 | 0.80.4 | 1.20.8 | 3.10.3 | 2.30.5 | 1.20.4 | 1.90.8 | 1.10.3 | 1.80.7 |
| Mgb | 4.60.3 | 0.90.3 | 2.70.6 | 5.30.5 | 4.10.4 | 2.60.4 | 3.80.5 | 0.70.3 | 3.50.3 |
| Mgb opt. 1 | 4.10.3 | 0.50.3 | 2.90.6 | 4.20.4 | 3.30.4 | 2.10.3 | 3.00.5 | 0.30.3 | 3.10.3 |
| Mgb opt. 2 | 4.20.2 | 0.30.3 | 3.00.5 | 4.20.3 | 3.20.3 | 2.20.3 | 3.20.5 | 0.20.3 | 3.10.3 |
| CaT (1) | 1.30.1 | 1.30.2 | 1.30.3 | 1.30.1 | 0.90.2 | 1.20.1 | 1.50.4 | 2.30.2 | 1.50.2 |
| CaT (2) | 3.30.1 | 1.70.2 | 2.90.3 | 3.70.1 | 3.30.2 | 3.30.1 | 3.70.4 | 2.00.2 | 3.60.2 |
| CaT (3) | 2.90.2 | 1.30.2 | 2.60.3 | 2.90.1 | 3.30.3 | 2.70.1 | 3.30.4 | 2.20.2 | 2.20.2 |
| CaT (2+3) | 6.30.3 | 3.00.4 | 5.50.6 | 6.60.2 | 6.60.5 | 6.00.2 | 7.00.7 | 4.20.3 | 5.80.4 |
| Fe52 () | 2.90.4 | 0.80.3 | 1.70.8 | 2.70.4 | 2.60.5 | 1.80.3 | 1.60.6 | 1.80.3 | 2.50.8 |
| Fe53 () | 2.60.3 | 0.80.4 | 1.30.9 | 3.30.4 | 2.50.5 | 1.20.5 | 2.00.8 | 1.10.3 | 2.00.8 |
| Mgb () | 5.00.4 | 1.00.4 | 3.00.6 | 5.80.5 | 4.50.5 | 2.70.4 | 4.10.5 | 0.70.4 | 4.00.5 |
| Mgb opt. 1 () | 4.40.4 | 0.50.3 | 3.10.6 | 4.40.4 | 3.60.4 | 2.10.3 | 3.20.6 | 0.30.3 | 3.40.4 |
| Mgb opt. 2 () | 4.50.3 | 0.40.3 | 3.20.6 | 4.40.4 | 3.40.4 | 2.20.3 | 3.40.5 | 0.20.3 | 3.40.4 |
| CaT (1) () | 1.30.2 | 1.30.2 | 1.30.4 | 1.30.1 | 0.90.2 | 1.20.1 | 1.50.4 | 2.20.2 | 1.50.2 |
| CaT (2) () | 3.40.2 | 1.70.2 | 3.00.4 | 3.80.1 | 3.50.3 | 2.80.1 | 3.80.4 | 2.00.2 | 3.80.3 |
| CaT (3) () | 3.10.2 | 1.30.2 | 2.70.4 | 3.10.1 | 3.50.4 | 2.80.1 | 3.50.4 | 2.30.2 | 2.50.3 |
| CaT (2+3) () | 6.50.3 | 3.00.4 | 5.70.7 | 6.80.2 | 7.00.6 | 6.10.2 | 7.30.8 | 4.30.4 | 6.20.5 |
| ———— [O iii] 5007 ———— | ———— [O iii] 4959 ———— | ——— H ——— | ||||||
|---|---|---|---|---|---|---|---|---|
| Galaxy | ||||||||
| (km s-1) | (km s-1) | (km s-1) | (km s-1) | (km s-1) | (km s-1) | (km s-1) | (km s-1) | |
| NGC 4235 | 1963 | 1858 | 15110 | 22625 | 14618 | 13124 | — | — |
| NGC 5940 | 1694 | 1676 | 1518 | 2135 | 22017 | 16919 | 260100 | 1960 |
| NGC 6104 | 644 | 606 | 577 | 616 | 5512 | 4916 | 9129 | 3940 |
| Mk 270 | 1782 | 1743 | 1553 | 1886 | 1724 | 1655 | 1853 | — |
| Mk 423 | 1983 | 2048 | 21013 | 22413 | 20021 | 19233 | 1597 | — |
| Mk 759 | 1076 | 10723 | 10331 | — | — | — | 496 | — |
| Mk 766 | 1428 | 1323 | 1064 | 1265 | 1224 | 906 | 12113 | 785 |
| Mk 885 | 974 | 838 | 6610 | 1198 | 9317 | 6822 | 21769 | 2565 |
| Mk 1098 | 1215 | 1237 | 11510 | 1288 | 13822 | 11421 | 16449 | 1210 |
| 3C305 | 2314 | 2248 | 20613 | 2719 | 24222 | 21033 | — | — |
4.2.2 Gas velocity dispersions
The width of the emission lines H, [O iii] 5007, 4959 and [S iii] 9069 were measured to determine the velocity dispersion of the gas in the NLR. Three different methods were used:
-
1.
Three times a suitable continuum was chosen by visual inspection and a gaussian fitted to the whole line. The average of the measurements was obtained and the error calculated as the dispersion of these measurements, thus it is associated to the continuum determination. The width so obtained, we called .
-
2.
A second value () was obtained by fitting a gaussian, using in the fitting only those points over (= total height of the line above the continuum).
-
3.
The third one () was obtained by fitting the core of the line, but using only the points over .
The line width was calculated as,
where is the dispersion of the gaussian fitted to each line and is the instrumental width obtained from measurements of sky emission lines.
The pure emission spectrum was extracted for NGC 4235 and Mk 270 (see Sec. 4.1.3), and the emission line widths were measured on them. In the Seyfert 1 and 1.5 of the sample, the widths of the broad () and narrow () components of H were measured.
4.2.3 Results
The measured emission line widths are shown in Tables 6 and 7. The widths of the line cores are used in the discussion (i.e. ).
The stellar velocity dispersions (from the Mgb and CaT stellar features) are given in Table 8. Column 4 shows the average value of both measurements (). Although it doesn’t have a clear physical meaning as the Mgb and CaT features can be produced by different stellar populations with different kinematical behaviour, the measurements obtained from the Mgb and from the CaT are consistent in all galaxies, except in Mk 1098, 3C 305 and, marginally, in Mk 423. In these three galaxies our measurements point to the presence of, at least, two distinct populations in their nuclei.
5 Discussion
5.1 Dilution of the nuclear spectral indices
In active galaxies, the EWs of the blue-optical stellar absorption features are smaller than those found in non-active galaxies of the same morphological type. This effect has been called “dilution” in the literature, assuming that it is caused by the BFC emitted by the AGN. Nevertheless, a nuclear featureless continuum is not necessary to explain why the EWs of the blue indices are small in active galaxies. According to stellar population models, the blue indices of a young or/and low metallicity stellar population are also much smaller than those of the high metallicity nuclei of early type galaxies without active star formation. In this case, of course, the word “dilution” is not suitable, since the indices are not diluted by any BFC but they are intrinsically weak.
Nevertheless, we can define the effective dilution of an absorption feature in a galactic spectrum as the ratio between the EW of the feature in that galaxy and the average EW of the index in normal galaxies of the same morphological type:
This effective dilution is not real, in the sense that it has not be caused by a power-law featureless continuum, but it is useful to quantify the different effects that reduce the EWs of the spectral indices of a galaxy.
In summary, the dilution of the optical stellar features in Seyfert galaxies is explained in different ways:
| ———— [S iii] 9069 ———— | |||
|---|---|---|---|
| Galaxy | |||
| (km s-1) | (km s-1) | (km s-1) | |
| NGC 4235 | 23213 | — | — |
| NGC 5940 | — | — | — |
| NGC 6104 | 716 | — | — |
| Mk 270 | 20211 | 20113 | 17815 |
| Mk 423 | 23824 | — | — |
| Mk 759 | 369 | 4211 | 3812 |
| Mk 766 | 1143 | 1138 | 9910 |
| Mk 885 | 12518 | 9860 | — |
| Mk 1098 | — | — | — |
| 3C 305 | 20133 | — | — |
| Galaxy | |||
|---|---|---|---|
| (km s-1) | (km s-1) | (km s-1) | |
| NGC 4235 | 16013 | 1538 | 15510 |
| NGC 5940 | 11226 | 9327 | 10327 |
| NGC 6104 | 14423 | 13515 | 13818 |
| Mk 270 | 13711 | 1398 | 13810 |
| Mk 423 | 16717 | 15111 | 15613 |
| Mk 759 | 6510 | 708 | 689 |
| Mk 766 | 10640 | — | 10640 |
| Mk 885 | 14516 | 14413 | 14415 |
| Mk 1098 | 7713 | 12215 | 9623 |
| 3C 305 | 21224 | 17013 | 18021 |
-
1.
In the standard model, the continuum emitted by the nucleus of a Seyfert galaxy, is dominated by the featureless continuum emission from the AGN that dilute the stellar spectral indices from the bulge stars.
-
2.
If there are luminous starbursts in the central region of a Seyfert galaxy the EWs of the blue absorption features like the Mgb or the Fe indices, will be weak like in the spectra of hot young stars. Therefore the observed optical continuum would be fairly featureless as it happens in starburst galaxies (TDT90; Cid Fernandes & Terlevich 1995). In the case of Seyfert 1 galaxies, the broad emission lines of the BLR represent an extra source of dilution that must be taken into account.
-
3.
In general, the lower the metallicity of a galaxy, the weaker its stellar features, the smaller the EWs. It is unlikely that the central regions of an early type galaxy, like the ones which commonly host Seyfert nuclei, are of low-metallicity so we are not going to consider this third possibility any further.
There are several methods to discriminate which of these effects causes the dilution in the blue–optical spectrum of a certain galaxy. We have followed TDT90 and compared the nuclear effective dilution of the Mgb index () with the observed effective dilution of the CaT (). If the light emitted by the AGN is responsible for the dilution, and would follow a simple relation, since the emission from the AGN follows a power-law: (with ). On the other hand, if the blue indices are weak because of the presence of young stars in the nucleus, the CaT could be strong, since the CaT feature is strong in young red supergiants.
To measure the effective dilution of the stellar features in the spectra of Seyfert galaxies a reference value for the EWs of these features in normal non-active galaxies is needed. Unfortunately, such a reference value is not well established. Galaxian spectral indices depend on the age and metallicity of the stellar populations in that galaxy; therefore the EWs of the indices in normal galaxies show a wide range of values. To limit that range we must choose template galaxies of the same type as the ones to study. Strictly speaking, templates should have the same red-shift and morphological properties (Hubble type, bulge magnitude, etc.) as the observed galaxies but this is not always possible. Since Seyfert galaxies are preferentially found among early type spirals [1997], we have searched the literature for samples of these galaxies with spectral indices measured. Reference values for the blue indices were obtained from Idiart, de Freitas Pacheco & Costa [1996] and Fisher, Franx & Illingworth [1996], chosen because their sample contain a substantial number of early type non-active spiral galaxies, and because the methods they used to measure the EWs are the same as ours. We have selected those galaxies with Hubble types between Sb () and E/S0 (). A total number of 62 galaxies were used. The reference values were calculated taking the median of the EWs of the lines in these galaxies and are shown in Table 9. Using the larger (more than 500 galaxies) –but also much more inhomogeneous– sample of Bica et al. [1991], we obtain a similar average value for Mgb (3.9 Å).
| Mgb | Fe52 | Fe53 | CaT (1+2) |
| EW(Å) | EW(Å) | EW(Å) | EW(Å) |
| 3.8 0.8 | 2.8 0.6 | 2.6 0.6 | 7.6 0.8 |
To find the average value of the EW of the CaT in normal spirals, we chose from TDT90 those galaxies with , and obtain, taking the median, a reference value of . This value is more uncertain than the one for Mgb, because we only used 8 galaxies to calculate it. Theoretical models (García–Vargas, Mollá & Bressan 1998) predict that the CaT of an old ( 2 Gyr) single stellar population of solar metallicity should have an EW between 7 Å and 9 Å depending on the model chosen, which agrees with our reference value.
Although we believe that these average values are reasonably good, there is a large scatter in the EWs of the indices in normal early type spirals. The EW of the Mgb index can be as low as 2 Å, or as high as 5 Å. Mgb EWs higher than 5 Å are not common in spirals but they are in ellipticals. The range of values covered by the EW(CaT) is not so wide, usually between 6 and 8.5 Å in spirals.
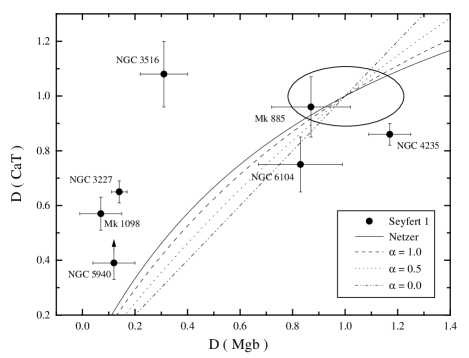
vs. are presented in Fig. 6. Five Seyfert 1 galaxies of the present sample and two Seyfert 1 from TDT90 sample have been included in this figure. While TDT90 measured the CaT for these two galaxies, the Mgb value is from Dahari & De Robertis [1989]. We can see the galaxies separating in two different groups: in the first one (group I: NGC 4235, NGC 6104 and Mk 885) the EWs fall into the range of values covered by the indices of normal spiral bulges. These galaxies also share other properties:
-
1.
The emission from the BLR is weak, with EW(H) Å.
-
2.
They are not Fe ii emitters.
-
3.
Their nuclei are spatially resolved [1998].
In summary the Seyfert activity in these galaxies appears to be weak. Our spectra, because of their poor spatial resolution, include, not only the nuclei of the galaxies, but also, at least partially, their bulges. For these reasons we believe that, in these galaxies, the emission from the old stellar population in the bulge is masking the continuum emission from the active nucleus.
The galaxies of the second group (group II: NGC 3516, NGC 3227, NGC 5940 and Mk 1098) are much more active: they have a prominent BLR with EW(H) Å, they are very strong Fe ii emitters and their nuclei are not spatially resolved. The spectral indices of these galaxies, both the blue ones and the CaT, are diluted showing the contribution of an additional continuum over that corresponding to a “normal” galaxy nucleus. However, the relation between the dilutions of the blue indices and the CaT does not conform to the predictions of the standard model, in which the continuum emitted by the AGN follows a power-law. In these four galaxies the dilution of the blue indices is relatively greater than that of the CaT. There are two possible explanations for this: the presence of a compact nuclear starburst in the nuclei of these galaxies and/or the dilution of their blue indices by Fe ii multiplet emission.
NGC 3516 seems to be the most extreme case: only the blue indices are diluted. The CaT is instead slightly enhanced with respect to the values found in normal galaxies. Nevertheless, other observations [1996] suggest that the CaT may be somewhat diluted in the nucleus of NGC 3516, at least if we take as reference value the EW of the CaT in the bulge of this galaxy.
The redshift range covered by our sample (0.007 – 0.041) implies different total areas for the fixed 10 pixel extraction in each galaxy, between 0.08 and 1.7 kpc2. The results presented here are nevertheless barely affected by this, since the Seyfert 1 nuclear luminosity dominates the spectra as evidenced by the fact that the BLR shows up prominently even in the outermost pixels of the extraction windows. In any case, contamination by bulge stars would tend to decrease the dilution of the Mgb and the CaT in the same proportion.
Circumnuclear star-forming regions cannot be ruled out in many Seyfert 1s since it is not possible to resolve the inner 200–500 pc with ground based telescopes due to their large distance.

5.1.1 Young starbursts in the nuclei of Seyfert 1 galaxies
All Seyfert 2 galaxies observed until now with good spatial resolution at UV wavelengths, show nuclear starbursts (Heckman et al. 1997; González Delgado et al. 1998). Thus, if unified models were correct, we should also see some starburst signatures in the spectra of Seyfert 1 nuclei. The presence of such starbursts in the nuclei of the group II galaxies, could explain our observations, since the CaT is strong in the spectra of young red supergiants. On the other hand, only our luminous Seyfert 1 galaxies have the CaT relatively less diluted than the Mgb. If similar starbursts were present in all Seyfert 1 nuclei, we should also see relatively strong CaT features in the nuclear spectra of the weaker Seyferts.
This can be explained by the data on Seyfert 2 galaxies. González Delgado et al. [1998] have found that the bolometric luminosities of the active nuclei and nuclear starbursts in Seyfert 2 galaxies are positively related. If starbursts in Seyfert 1 followed this same relation, the spectral features from young stars in the spectra of the weaker Seyfert 1 could be masked by the old stellar populations of the bulge. On the contrary, in more active Seyfert, the starburst could be strong enough as to increase the EW of the CaT so that it could be seen in spite of the strong continuum emitted by the AGN.
5.1.2 Blue indices diluted by Fe II multiplets
One of the common properties of all the galaxies in the group II is that they are strong Fe ii emitters. The lines of Fe ii, (more precisely the bump formed by multiplets (42), (48) and (49)) can mask the Mgb, Fe52 and Fe53 stellar features, making these features to appear diluted by the continuum emitted by the AGN. If this were true, the dilution of the three blue indices could be very different, since the emission of Fe ii is very irregular. This could explain why, in some of our galaxies, specially in Mk 1098, the dilution of the Mgb is much greater than the dilution of the Fe indices. On the other hand, the Fe ii emission, in Seyfert galaxies, seems to be correlated with CaT emission [1988] i.e., the galaxies that are strong Fe ii emitters also show the CaT in emission. This is what happens in Mk 766 and, perhaps, also in Mk 1098. In the other galaxies the CaT could also be in emission, at levels too low to be detected but high enough to dilute the EW of the absorption lines.
5.1.3 Compact SN remnants and evolutionary effects
The hypothesis discussed in sections 5.1.1 and 5.1.2 may actually be compatible with one another, since part of the Fe ii emission can be produced by compact supernova remnants (cSNRs) like SN1987F (Filippenko 1989; Wegner & Swanson 1996), SN1988Z (Stathakis & Sadler 1991; Turatto et al. 1993) or SN1997ab (Hagen, Engels & Reimers 1997; Salamanca et al. 1998). These objects are characterized by showing broad permitted emission lines of hydrogen, helium, Fe ii, IR CaT, superposed on a nearly featureless continuum. Their optical spectra are so similar to those of QSOs and type 1 Seyferts, that they have been called “Seyfert 1 imposters” by Filippenko. Several explanations have been proposed for the intriguing properties of cSNRs. The most promising are those based on the interaction of the SN ejecta with a dense circumstelar medium () (Terlevich et al. 1992a). In the starburst model for AGN of Terlevich et al. 1992a,b (see also the recent review of Cid Fernandes 1997), the broad permitted emission lines of type 1 Seyfert nuclei are generated by strongly radiative cSNRs, in compact nuclear starbursts. In this model, the differences between types 1 and 2 Seyferts are not only due to obscuration effects but also to the evolution of the central starburst, i.e. an AGN can only become of type 1 when the nuclear starburst has reached a phase at which their most massive stars begin to explode as type II SN [1987]. This happens when the burst has an age 8 Myr.
The starburts discovered by Heckman et al. [1997] and González Delgado et al. [1998] in four Seyfert 2 galaxies have ages between 3 and 6 Myr. When these massive starbursts reach an age of 8 Myr, they should yield a very high SNe rate. If, as expected from numerical simulations, some of these SN become cSNRs, then these galaxies will, with a high probability, be classified as type 1 AGN.
5.2 Gas and stellar kinematics in Seyfert galaxies
Gas in the NLR of Seyfert galaxies can be accelerated by the gravitational field of the galaxy or by violent processes, like shock waves or tidal forces. This question has been analyzed in several papers (Wilson & Heckman 1985; TDT90; Nelson & Whittle 1996), and all of them have arrived to the following conclusions:
-
1.
In the majority of Seyfert galaxies the motion of the gas in the NLR seemed to be controlled by the gravitational field of the bulge, since the gas and stars show similar velocity dispersions.
-
2.
In some Seyfert 2 galaxies the velocity dispersion of the gas is very high, rising to more than 400 km s-1. In these galaxies extra broadening mechanisms must exist. Such mechanisms could be shock-waves caused by jets emitted by the active nucleus or gravitational perturbations caused by tidal interactions with other galaxies.
Fig. 7 shows the stellar velocity dispersion vs. the width of the emission lines for our new data, together with those by TDT90. It can be seen in the figure that the majority of the galaxies groups around the slope 1 line. A least square fit gives a correlation coefficient of 0.9 for Seyfert 2 galaxies (after eliminating the points corresponding to NGC 1068 and Mk 78) and only 0.13 for Seyfert 1. The slopes of the lines fitted are 0.480.09 for Seyfert 2 and 0.110.32 for Seyfert 1. Thus, we cannot assert that the stellar and gas velocity dispersions are correlated in Seyfert galaxies.
The galaxies with emission lines much wider than their stellar absorption lines are all Seyfert 2. In these last galaxies, we also observe big differences between the widths of the lines of [O iii] and [S iii] 9069. This points to the existence of several gas clouds in the NLR of these galaxies, each one with different ionization states and moving in different ways. In fact, these clouds have been resolved in NGC 1068 (e.g. Dietrich & Wagner 1998; Kraemer et al. 1998).
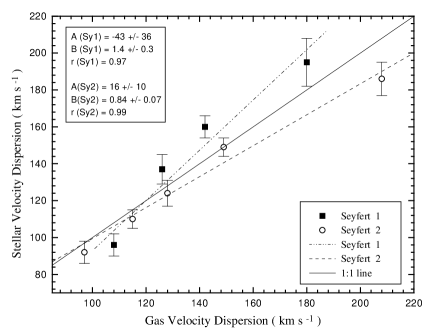
To improve the statistics, we added to our data that from Nelson & Whittle [1995]. If we represent the width of the [O iii] 5007 emission line vs. the stellar velocity dispersion, we would see again a cloud of points around the slope 1 line, but not a clear correlation between both magnitudes. Now, the correlation coefficient is 0.49 for Seyfert 2 and 0.44 for Seyfert 1. The slopes of the lines fitted are 0.310.09 for Seyfert 2 and 0.40.2 for Seyfert 1. To find out if the clustering of the data around the slope 1 line really means that the gas motions in Seyfert galaxies are related to the stellar mass of their bulges, we have binned the Seyferts 1 and 2 separatelly in stellar velocity dispersion in such a way that there were always more than 4 galaxies in each group. This results in 5 groups of type 2 Seyferts and 4 of type 1 The median of the stellar velocity dispersions of the galaxies in each group vs. the corresponding median of their emission line widths can be seen in Fig. 8. The correlation found between both medians is really surprising. A possible explanation is that the main mechanism that controls the gas motions in the NLR is the gravitational field of the bulge; nevertheless, several other mechanisms might also influence the gas kinematics, therefore the correlation between the gas and stellar velocity dispersion is not evident at first sight. Nelson & Whittle [1996] arrived to this same conclusion by using a more elaborate method of analysis.
Shock waves produced by jets (e.g. Falcke, Wilson & Simpson 1998; Axon et al. 1998) and tidal effects caused by close encounters with other galaxies can disturb and accelerate the gas in the NLR. This could explain why many Seyfert galaxies have emission lines wider than their stellar absorption lines. However, it is more difficult to explain why in many other Seyfert galaxies the emission lines are narrower than the stellar features. The reason could be that, in some galaxies, the gas has settled in a cold rotating disk. This become more intriguing if we realize that Seyfert 1 and 2 show different behaviours in Fig. 8. The medians of the gas velocity in type 2 Seyferts are always higher than the ones of the stellar velocity dispersions, while the contrary happens in Seyfert 1. Fig. 9 represents the ratio between the velocity dispersion of gas and stars in Seyferts, and we can see that, whereas there is a population of type 2 Seyferts with gas velocities much higher than the velocities of their stars, in Seyfert 1 there are signs of the existence of another population with inverse kinematical properties. This means that the differences between the kinematical behaviour of Seyfert 1 and 2 are not likely due to systematic differences between all the galaxies of both groups, but to the existence of these two populations.
There are several possibilities for explaining the different kinematical behaviours of Seyfert 1 and 2 galaxies. If shock-waves produced by jets were the main accelerating mechanism of the gas in Seyferts (aside of the gravitational field), the lack of Seyfert 1 galaxies with emission lines much broader than their absorption features, could be explained in the context of unified models. According to this model the active nucleus in a Seyfert galaxy is surrounded by a dense molecular torus. Therefore, if the AGN produced radio-jets, they would be emitted in a direction perpendicular to the torus plane. The gas in the NLR would also be accelerated in this same direction. Therefore, if the line of sight to the AGN is perpendicular to the torus plane ( as, according to unified models, is the case for Seyfert 1) we should not see a broadening in the emission lines of the galaxy, but a spectral shift between the stellar and gas emission features.

On the other hand, if the nuclear activity, in at least some Seyfert galaxies, is produced by gravitational encounters with close companions (e.g. Keel 1996; De Robertis, Yee & Hayhoe 1998), the younger of these Seyferts should also be those with broader emission lines. Tidal interactions can disturb and accelerate the gas in the nuclei of the involved galaxies, but, immediately after the encounter, the gas in both galaxies begins to settle again so that in a few Myr the kinematical signs of the interaction will have disappeared. Therefore, the observed differences between the gas velocity dispersions of Seyfert 1 and 2 could be explained if nuclear activity were older in Seyfert 1 than in Seyfert 2.
We could also appeal to morphological differences between Seyfert 1 and 2 to explain their kinematical behaviour. Seyfert 1 are frequently found in earlier galaxies than Seyfert 2 [1998]. The gas and stellar velocity dispersions in starbursts found in late type spirals are of the same order, whereas in early type starburst galaxies the stellar velocity dispersion seems to be higher than that of the gas [1998]. This difference between the gas and stellar kinematics in starburst galaxies could extend to Seyfert galaxies. To test this last possibility, we have compared the differences between the velocity dispersions of the gas and stars in Seyfert galaxies vs. their Hubble type and their stellar velocity dispersion (which is a measurement of the bulge mass) but we have not found any clear correlation between these magnitudes. Therefore, we must conclude that it is not likely that the kinematical differences between Seyfert 1 and 2 be due just to morphological differences between both types of galaxies.
6 Conclusions
We have studied the CaT and the Mgb stellar absorption indices and kinematics of the nuclei of a sample of ten active galaxies, centering our analysis on the study of the properties of Seyfert 1 galaxies.
In spite of problems related to contamination by emission lines, we find that the IR CaII triplet stellar indices of Seyfert 1 nuclei with EW(H) 45 Å, is stronger than what the standard model would predict from the observed strength of the Mgb index.
This result is naturally explained by the presence, in the nuclei of these type 1 Seyferts of young stellar clusters whose luminosity is somehow related to the luminosity of the active nucleus itself. This conclusion is weaker for those nuclei with strong Fe ii emission affecting the measurement of the Mgb index.
Our measurements of the velocity dispersions in Seyfert galaxies, support previous conclusions by TDT90 and Nelson & Whittle [1996] that the main factor that controls the gas motions in the NLR of Seyfert galaxies is the mass of the bulge. We also find that other factors may also be important, since the correlation between the gas and stellar velocity dispersions shows a large scatter. Among the factors that may broaden the emission lines in the NLR, induced motions by shocks are the most likely.
Some differences between the kinematics of Seyfert 1 and Seyfert 2 have been found. Seyfert galaxies with gas velocity dispersions much larger than that of the stars are preferentially found among type 2. Also we found some Seyfert 1 nuclei with emission lines narrower than the stellar absorption features. Although we have outlined some hypotheses, like orientation an evolutionary effects, a satisfactory explanation for this second aspect still needs to be found.
Acknowledgments
We would like to thank Itziar Aretxaga, Javier Gorgas, Enrique Pérez, Javier Palacios and Juan Carlos Vega for many helpful suggestions. We also thank the staffs at the WHT and the ING for their assistance and support. E.T. acknowledges an IBERDROLA Visiting Professorship to UAM. L.J.B. thanks the hospitality of INAOE and of the Guillermo Haro Programme for Advanced Astrophysics during the finalization of this paper. This research has made use of NASA’s Astrophysics Data System (ADS) and of the NASA/IPAC Extragalactic Database (NED).
References
- [1978] Abell G. O., Eastmond T. J., Jenner C., 1978, ApJ, 221, L1
- [1993] Antonucci R. R., 1993, ARA&A, 31, 473
- [1998] Axon D. J., Marconi A., Capetti A., Maccetto F. D., Schreier E., Robinson A., 1998, ApJ, 496, 75
- [1991] Bica E., Pastoriza M. G., Maia M., da Silva L. A. L., Dottori H., 1991, AJ, 102, 1702
- [1999] Brotherton M. S., van Breugel W., Stanford S. A., Smith R. J., Boyle B. J., Miller L., Shanks T., Croom S. M., Filippenko A. V., 1999, ApJ in press, astro-ph/9906052
- [1998] Cardiel N., Gorgas J., Aragón–Salamanca A., 1998, MNRAS, 298, 977
- [1997] Cid Fernandes R., 1997, RMxAC, 6, 201
- [1992] Cid Fernandes R., Terlevich R., 1992, in Filippenko, A. V., ed., ASP Conf. Ser. Vol. 31, Relationships between Active Galactic Nuclei and Starburst Galaxies. Astron. Soc. Pac., San Francisco, p. 241
- [1993] Cid Fernandes R., Terlevich R., 1993, in Beckman J., Netzer H., Colina L., eds, The Nearest Active Galaxies. Ap&SpSci 205, 91
- [1995] Cid Fernandes R., Terlevich R., 1995, MNRAS, 272, 423
- [1996a] Colbert E. J. M., Baum S. A., Gallimore J. F., O’Dea C. P., Lehnert M. D., Tsvetanov Z. I., Mulchaey J. S., Caganoff S., 1996a, ApJS, 105, 75
- [1996b] Colbert E. J. M., Baum S. A., Gallimore J. F., O’Dea C. P., Christensen J. A., 1996b, ApJ, 467, 551
- [1997] Colina L., García–Vargas M. L., Mas–Hesse J. M, Alberdi A., Krabbe A.,1997 ApJ, 484, L41
- [1989] Dahari D., De Robertis M. M., 1989, ApJ, 252, 102
- [1998] De Robertis M. M., Yee H. K. C., Hayhoe K., 1998, ApJ, 496, 93
- [1991] de Vaucouleurs G., de Vaucouleurs A., Corwin H. G. Jr., Buta R. J., Paturel G., Fouqué P., 1991, The Third Reference Catalogue of Bright Galaxies. Springer-Verlag, New York
- [1989] Díaz A. I., Terlevich E., Terlevich R., 1989, MNRAS, 239, 325
- [1998] Dietrich M., Wagner S. J., 1998, A&A, 338, 405
- [1998] Falcke H., Wilson A. S., Simpson C, 1998, ApJ, 502, 199
- [1989] Filippenko A. V., 1989, AJ, 97, 726
- [1996] Fisher D., Franx M., Illingworth G., 1996, ApJ, 459, 110
- [1998] García–Vargas M. L., Mollá M., Bressan A., 1998, A&AS, 130, 513
- [1993] González Delgado R. M., Pérez E., 1993, Ap&SS, 205, 127
- [1996] González Delgado R. M., Pérez E., 1996, MNRAS, 278, 737
- [1997] González Delgado R. M., Pérez E., Tadhunter C., Vílchez J. M., Rodríguez–Espinosa J. M., 1997, ApJS, 108, 155
- [1998] González Delgado R. M., Heckman T. M., Leitherer C., Meurer G., Krolik J., Wilson A. S., Kinney A., Koratkar A., 1998, ApJ, 505, 174
- [1989] Goodrich R. W., 1989, ApJ, 342, 224
- [1993] Gorgas J., Faber S. M.,Burstein D., González J., Courteau S., Prosser C., 1993, ApJS, 86, 153
- [1996] Goudfrooij P., Emsellem E., 1996, A&A, 306, L45
- [1997] Hagen H. J., Engels D., Reimers D., 1997, A&A, 324, L29
- [1988] Haniff C. A., Wilson A. S., Ward M. J., 1988, ApJ, 334, 104
- [1997] Heckman T. M., González–Delgado R. M., Leitherer C., Meurer G. R., Krolik J., Wilson A. S., Koratkar A., Kinney A., 1997, ApJ, 482, 114
- [1997] Ho L. C., Filippenko A. V., Sargent W. L. W., 1997, ApJ, 487, 568
- [1996] Idiart T. P., de Freitas Pacheco J. A., Costa R. D. D., 1996, AJ, 112, 2541
- [1984] Jones J. E., Alloin D. M., Jones B. J. T., 1984, ApJ, 283, 457
- [1996] Keel W. C., 1996, AJ, 111, 696
- [1998] Kraemer S. B., Ruiz J. R., Crenshaw D. M., 1998, ApJ, 508, 232
- [1995] Kukula M. J., Pedlar A., Baum S. A., O’Dea C. P., 1995, MNRAS, 276, 1262
- [1995] Maiolino R., Ruiz M., Rieke G. H., Keller L. D., 1995, ApJ, 446, 561
- [1998] Malkan M. A., Gorjian V., Tam R., 1998, ApJS, 117, 25
- [1998] Maoz D., Koratkar A., Shields J. C., Ho L. C., Filippenko A. V. Sternberg A., 1998, AJ, 116, 55
- [1994] Molendi S., Maccacaro T., 1994, A&A, 291, 420
- [1993] Molendi S., Maccacaro T., Schaeidt S., 1993, A&A, 271, 18
- [1988] Morris S. L., Ward M. J., 1988, MNRAS, 230, 639
- [1996] Mulchaey J. S., Wilson A. S., Tsvetanov Z., 1996, ApJS, 102, 309
- [1997] Nandra K., George I. M., Mushotzky R. F., Turner T. J., Yaqoob T., 1997, ApJ, 477, 602
- [1995] Nelson C. H., Whittle M., 1995, ApJS, 99, 67
- [1996] Nelson C. H., Whittle M., 1996, ApJ, 465, 96
- [1990] Netzer H., 1990, in Courvoisier T. J. L., Mayor M., eds, Active Galactic Nuclei. Springer–Verlag, Berlin, p. 57
- [1995] Nordgren T. E., Helou G., Chengalur J. N, Terzian Y., Khachikian E. D., 1995, ApJS, 99, 461
- [1995] Oliva E., Origlia L., Kotilainen J. K., Moorwood A. F. M., 1995, A&A, 301, 55
- [1977] Osterbrock D. E., 1977, ApJ, 215, 733
- [1981] Osterbrock D. E., 1981, ApJ, 249, 462
- [1983] Osterbrock D. E., Dahari O., 1983, ApJ, 273, 478
- [1985] Osterbrock D. E., Pogge R. W., 1985, ApJ, 297, 166
- [1997] Palacios J., García–Vargas M. L., Díaz A. I., Terlevich R., Terlevich E., 1997, A&A, 323, 749
- [1988] Persson S. E., 1988, ApJ, 330, 751
- [1989] Pogge R. W., 1989, ApJ, 345, 730
- [1985] Rudy R. J., Cohen R. D., Puetter R. C., 1985, ApJ, 288, L29
- [1998] Salamanca I., Cid Fernandes R., Tenorio–Tagle G., Telles E., Terlevich R., Muñoz–Tuñón, 1998, MNRAS, 300, L17
- [1999] Schmitt H. R., Storchi–Bergmann T., Cid Fernandes R., 1999, MNRAS, 303, 173
- [1996] Serote–Roos M., Boisson C., Joly M., Ward M. J., 1996, MNRAS, 278, 897
- [1986] Simien F., de Vaucouleurs G., 1986, ApJ, 302, 564
- [1991] Stathakis R. A., Sadler E. M., 1991, MNRAS, 250, 786
- [1990] Terlevich E., Díaz A. I., Terlevich R., 1990, MNRAS, 242, 271
- [1987] Terlevich R., Melnick J., Moles M., 1987, in Khachikian E., Fricke K., Melnick J., eds, Observational Evidence for Activity in Galaxies. Reidel, Dordrecht, p. 499
- [1992a] Terlevich R., Tenorio–Tagle G., Franco J., Melnick J., 1992a, MNRAS, 255, 713
- [1992b] Terlevich R., Tenorio–Tagle G., Rózyczka M., Franco J., Melnick J., 1992b, MNRAS, 272, 198
- [1979] Tonry J., Davis M., 1979, AJ, 84, 1511
- [1993] Turatto M., Cappellaro E., Danziger I. J., Benetti S., Gouiffes C., Della Valle M., 1993, MNRAS, 262, 128
- [1986] Ulvestad J. S., 1986, ApJ, 310, 136
- [1984a] Ulvestad J. S., Wilson A. S., 1984a, ApJ, 278, 544
- [1984b] Ulvestad J. S., Wilson A. S., 1984b, ApJ, 285, 439
- [1998] Vega Beltrán J. C., Pignatelli E., Zeilinger W., Bertola F, Beckman J.E., Pizzella A., Corsini E., 1998, in Merritt D. R., Valluri M., Sellwod J. A., eds, ASP Conf. Ser., Galaxy Dynamics. Astron. Soc. Pac., San Francisco, in press, astro-ph/9811235
- [1991] Veilleux S., 1991, ApJ, 369, 331
- [1996] Wegner G., Swanson S. R., 1996, MNRAS, 278, 22
- [1985] Wilson A. S., Heckman T. M., 1985, in Miller J. S., ed., Astrophysics of Active Galaxies and Quasi–Stellar Objects. University Science Books, Mill Valley, CA, p. 39
- [1991] Xanthopoulos E., de Robertis M. M., 1991, AJ, 102, 1980