Our Second Look at the Immature Universe:
The Infrared View
Abstract
The long-awaited promise of studying high-redshift galaxies at long wavelengths has been partially eclipsed by progress at optical wavelengths, mostly because of the number of available pixels. It is nonetheless essential to study optically selected high-redshift galaxies at wavelengths longward of 1 m, for several reasons. One of the indications from such studies to date is that interstellar dust (as an absorber of UV photons and re-emitter of IR photons) plays an energetically significant role at high redshifts, just as it does in present-day star-forming galaxies. This also provides a strong motivation for new searches which detect high-redshift galaxies based on IR observations. Some of these are already succeeding in clarifying our view of galaxy evolution in the Immature Universe.
1 Introduction
Optical observations jumped out to a rapid lead in studies of high-redshift (z1) galaxies, because of the sensitivity of large-format detectors, and the accessibility of very strong spectral features in the far-UV rest frame at z 2.5 (Ly, the trinity of deep interstellar absorptions due to Si II, O I, and Si II, at 1260, 1303, and 1334Å, respectively, and of course the dramatic Lyman continuum “break” which is robustly produced by both intrinsic and extrinsic absorption in (presumably) all normal galaxies at z2.5–3. (Steidel,et al. 1996) 111As long as the intrinsic depth of the Lyman limit break is “deep enough” (e.g. two magnitudes), it can be used as an excellent indicator of high-redshift galaxies in broad-band photometry which extends to short enough wavelengths. However, the full depth of the Lyman break has still not been actually measured in galaxies lacking active nuclei. HUT provided a few strong upper limits to the amount of Lyman continuum which manages to leak out of nearby galaxies, and a deep FUV imaging program with the STIS MAMA detector in HST’s Cycle 9 should be able to detect this emission in a sample of moderate-redshift () starburst galaxies (GO program 8561). In surprisingly short order, this lead to an impressive list of results e.g. luminosity functions and integrated star formation rates, morphologies, and even spatial clustering (Steidel, et al. 1998).
It is certainly exciting to be able to see much data on an evolutionary phase in normal galaxies that was hardly observed at all less than ten years ago. 222The last time I attended a meeting at this lovely conference center, in 1988, there were virtually no observational data on normal galaxies above redshifts of 1. However, as the initial euphoria of discovery has subsided, researchers have started to face the practical reality: all of this new information, as invaluable as it is, rests fundamentally on the strong stellar continuum escaping from these galaxies in the far-UV. It is well known that hardly any other region of the electromagnetic spectrum is more sensitive to absorption by interstellar dust grains. And this effect is especially strong when we are observing newly-formed stars, since they are too short-lived to escape from the interstellar matter out of which they are born. This leads immediately to the outstanding questions about these “Lyman Break” galaxies: 1) how can we estimate their properties, such as mass and metallicity, 2) which of their measured properties need to be corrected, 3) by how much, and 4) what galaxies are missing altogether from these searches? Thus the next task is to use observations at longer wavelengths to obtain some answers. This review is an attempt to see how long-wavelength observations are starting to catch up with the optical ones, and fill in key gaps.
2 Long-Wavelength Observations of Galaxies Selected at Short Wavelengths
The easiest way to build on optical studies of galaxies selected by their rest-frame far-UV 333Most of these considerations also apply to the smaller number of high-redshift galaxies which have been selected by their unusually strong Ly line emission. emission is to observe their rest-frame optical, infrared and radio emission.
The optical rest frame contains most of the strongest emission lines–our most powerful diagnostics of the composition and kinematics of the ionized gas associated with young stars. An excellent example is near-IR spectroscopy, which was first accomplished with UKIRT (Pettini et al. 1998), and more recently with Keck (Teplitz et al. 2000; Pettini et al. 2000). As an example of the new information available from strong, well-studied diagnostics in the rest-frame optical is shown in Figure 1. Such measurements of the [OIII] 5007 emission line in 5 LBGs indicate that the metallicities are mildly sub-solar (a half to a third–see Figure 2). In addition to being useful for abundance estimates, the rest-frame optical lines can measure galaxy dynamics and masses.
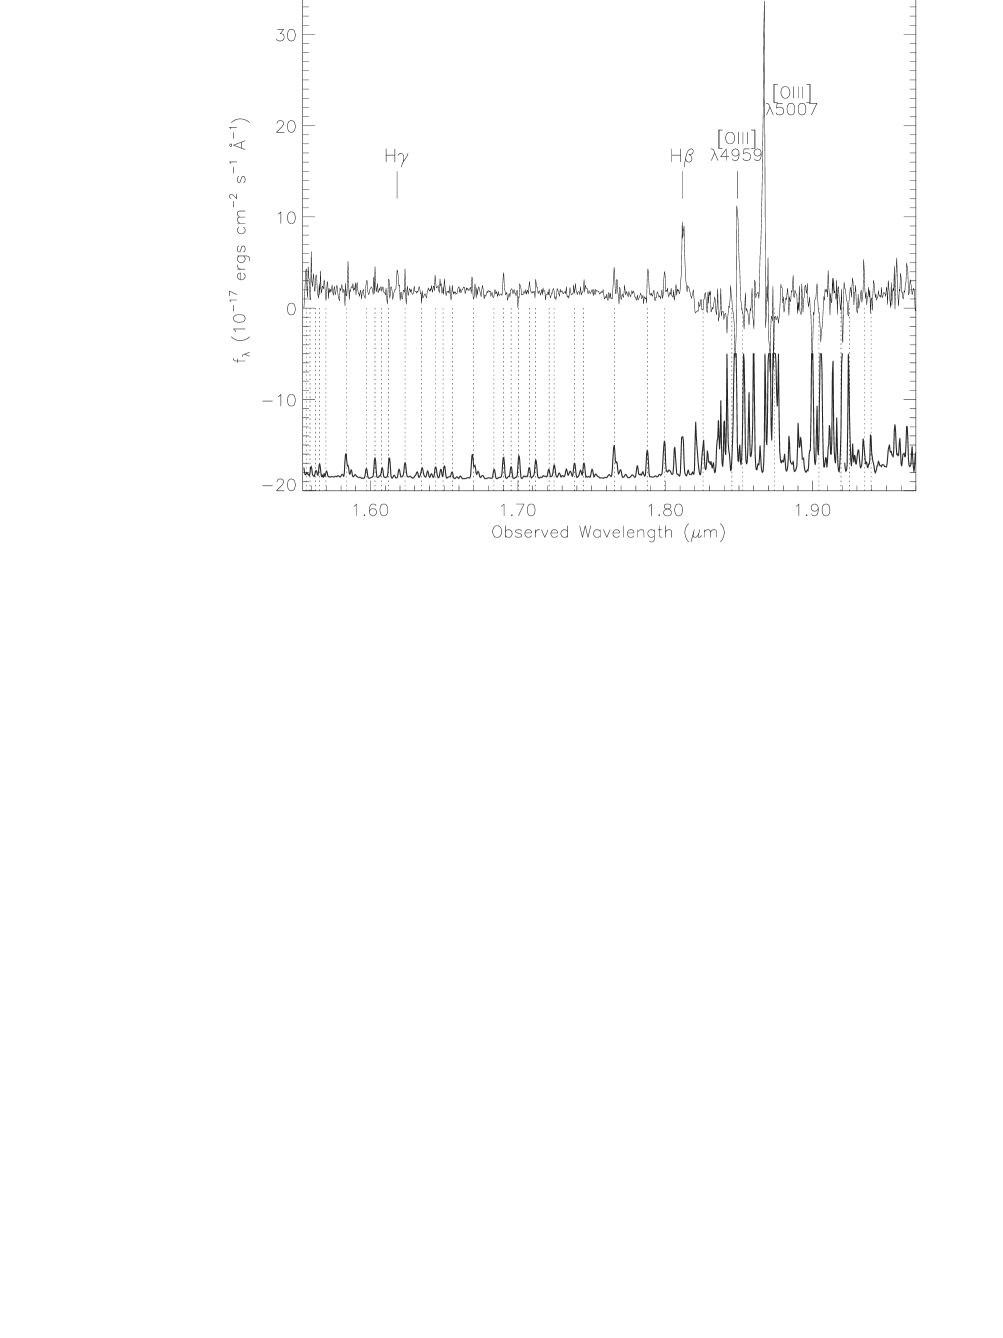
H-band spectrum of MS1512-cB58. 30 minutes of integration time on Keck. The 1 errors are truncated and shifted downward on the plot. The “break” in the continuum at 1.82 m is a residual from the atmospheric absorption correction, not a drop in the galaxy’s SED.

The datapoint is for a z=3.4 galaxy from Teplitz et al. (2000). The curves show the range of extreme plausible ratios for [OII]/[OIII]. The metallicity is robustly constrained to be a half to a third solar.
Longer wavelength continuum observations (at 3–15 m) constrain the old stellar population. In the lensed z=2.7 galaxy MS1512-cB58 (see its H-band spectrum in Figure 1), these ground-based and ISOCAM observations require that much of the star formation occurred relatively shortly before we actually are observing the galaxy (Bechtold et al. 2000; Malkan et al. 2000a).
Long-wavelength observations also provide estimates of the average extinction (through H recombination line ratios and, less directly, the optical emission line-to-far-UV continuum ratio) which are in rough accord with more uncertain estimates from the far-UV continuum colors. The tentative conclusion from these observations is that the far-UV emission from LBGs needs very large corrections for dust absorption. The average correction is “only” a factor of 3–5, while the total correction in integrated quantities such as global star formation rates is higher, perhaps 7 times, because the more luminous galaxies appear to be systematically redder and dustier (Pettini et al. , 1998).
The size of these corrections raises the concern that dustier galaxies are missing altogether from the UV-selected samples. When infrared observers attempt to estimate global star formation rates at redshifts of 1–2.5, these tend to be higher than those from the LBGs above z=2.5, even after large extinction corrections (e.g. Rowan-Robinson et al. 1997). Of course it is possible that the integrated star formation in the Universe really did peak at , but the lack of direct overlap between the optical and infrared search methods has always worried me. The best way to settle this question will be deep observations at longer wavelengths.
3 Selection and Discovery of High-Redshift Galaxies with Long-wavelength Observations
We can do even more if we do not rely exclusively on optical observations to select the galaxies. The most conservative improvement to the optical observations is to include near-infrared (e.g. J-, H- and possibly K-band) magnitudes in the photometric redshift methods, and this is absolutely essential for where the Lyman break feature is not accessible to ground-based observations, or even extremely long WFPC2 integrations in the 303W filter. Examples of this approach are the Hubble Deep Fields (HDF-North, Thompson et al. 1999; and HDF-3516, Colbert, et al. , 2000)
Nonetheless, these observations cannot answer the fourth and most haunting of the questions posed above. The second, more difficult approach needed to find out “What is Missing?”, is to develop search methods based on longer wavelengths.
Long-Wavelength Search Techniques
Several of these (which only utilize observations longward of 2 m) are now proving successful:
Rest-frame Optical Line Emission
From the ground, the only currently practical method is to use deep imaging in narrow-band filters (a 1% filter width, for example makes a typical high-z galaxy appear 0.5–1.5 magnitudes brighter than in a broad-band filter at the same wavelength). This method has been used successfully over the last 5 years (e.g., Malkan, Teplitz and McLean 1995). Figure 3 shows a “color-magnitude” diagram for the field around 0953+549. The 6 detected line-emitting galaxies (A through F) show significant excesses in the 2.30 m narrow-band filter relative to the broad one, identified as H emission at z=2.49–2.50 (Malkan, Teplitz and McLean 1996; Teplitz, Malkan and McLean 1998).

Vertical axis is magnitude excess brightness of each object in the narrow-band (2.30 m filter), with respect to the broad-band (K-short) filter. The diverging curved lines show the error ranges. There is a “proto-cluster” of six galaxies which are significantly detected in emission. If the line in the narrow filter is H as expected , it is at z=2.5. This has been confirmed for objects A and D, and is the same as the redshift of the CIV absorption complex seen in the bright quasar in the center of this field.
An extension of this method has been to search for the comparably strong [OIII] 5007 line emission from star-forming galaxies at higher redshifts (z=3–3.5, as opposed to 2–2.6 for redshifted H). This has also detected new galaxies (Teplitz, Malkan, McLean 1999).
When NICMOS was–and will once again be–operating on HST, a unique method–slitless spectroscopy (with the grisms, the G141 being most sensitive)–is available. HST parallel observations of blank fields detected 33 emission-line galaxies this way. The vast majority of these lines are believed to be H, at redshifts from 0.7 to 1.9 (Yan et al. 1999). The implied integrated star formation rates for galaxies at z=1.3 are 3 times higher than previous estimates based on near-UV continuum (McCarthy et al. 1999). This discrepancy again implies substantial dust absorption of the far-UV continuum.
Damped Ly Absorption
For decades, astronomers have searched for damped Ly absorption in the spectra of bright background quasars to reveal HI clouds that are, or may become, young galaxies. The big question about these DLA systems is how much star formation has actually taken place at the redshifts we observe them. In NICMOS coronographic imaging, Colbert and Malkan (2000) found that none of 21 DLA systems at is plausibly identified with a near-infrared galaxy. Figure 4 shows an example of a typical non-detection (the extra noise under the 0.3-′′-radius coronographic hole in the upper left should be ignored, since it is not real). The typical upper limits to the total galaxy magnitudes that could have been detected in these 750–1000 second exposures are H=21.5–22.5. These upper limits to the brightness at 1.6 m derived for the 21 absorbers, and are shown in Figure 5. The solid line shows the magnitude that a DLA galaxy would have at those redshifts, if it were going to evolve to a present-day galaxy. These limits require that several of the DLA systems are more than 1 magnitude fainter than an galaxy, while over half are fainter than . Hardly any of the 21 could be as bright as a half magnitude above .
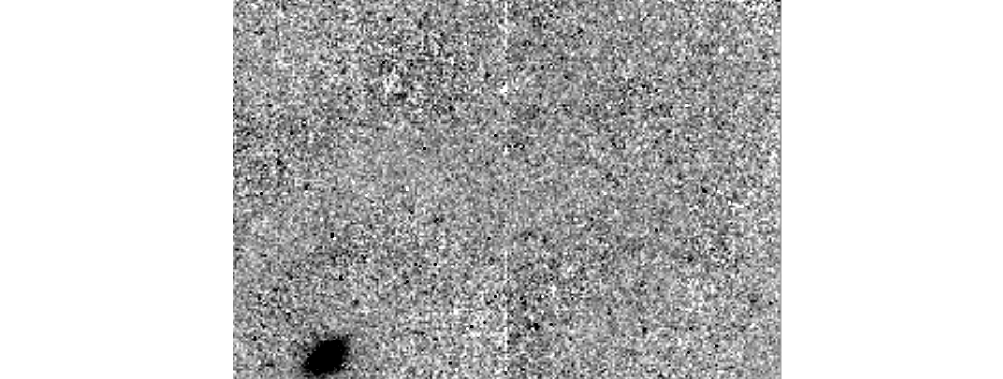
The coronographic spot is in the upper-left hand quadrant. This deep F160W image shows no plausible counterpart to the absorber, since the two galaxies in the field are either unreasonably far away or too bright.

Deep Mid- and Far-infrared Imaging
Another simple search method is to obtain ultra-deep imaging of blank fields at mid-IR (7–25 m), and far-IR (60–175 m) wavelengths, and look for sources with very large IR/optical flux ratios. This has great promise when many square degrees of sky can be covered at high sensitivity with cryogenic telescopes in space (such as SIRTF). Rowan-Robinson et al. (1997) has already used ISOCAM to find a significant number of 7 and 15 m emitters in the Hubble Deep Field which emit as much or more power in the infrared as in the optical. It is likely that these are part of a substantial population of dusty galaxies at redshifts of 1 or more. Deep blank-field surveys using ISOPHOT at 175 m, have found a large number of faint sources with similarly high IR/optical ratios (Kawara et al. 1998; Puget et al. 1999).
Deep 850 m Imaging with SCUBA
At 850 m, another breakthrough occurred when SCUBA provided the first (small) array at that wavelength, so that spatially multiplexed observations could be made down to flux levels of a few mJy (Smail, Ivison and Blain 1997). A surprisingly high surface density of faint red sources is being found, many of which are likely to have redshifts above 1 (Barger, Cowie and Richards 2000).
Many of the high-redshift galaxies detected in the ground-based infrared narrow-band imaging searches to date were found in targeted regions of the sky. Since they were found in regions selected to contain one or more high-redshift objects (quasars or absorption-line systems), they might not serve as typical blank fields for deriving global statistics (e.g. luminosity functions) for high-redshift galaxies. It is possible that the regions where some of these objects were found are biased to high density and are therefore not representative of the Universe as a whole. This issue will be settled as the new generation of large-field infrared array detectors comes to large telescopes.
The remaining searches have already covered enough un-targeted blank sky to indicate that long-wavelength observations are indeed picking up a substantial population of galaxies too red for the optical photometry method.
4 The Challenge of Spectroscopic and Far-IR Follow-up
Aside from the relatively slow pace at which all of these long-wavelength methods currently cover new sky, they also suffer from another difficulty: how can a positive spectroscopic redshift be confirmed for the candidate high-redshift galaxies? Note that some of these considerations also apply to galaxies which produce a significant fraction of their emission through an active nucleus (presumably powered by accretion rather than stars).
In some cases, optical spectroscopy still works. Several of the NICMOS Parallel Grism emission line galaxies have shown [OII] emission lines at the same redshift indicated by their H lines in the near-IR (Malkan et al. 2000b). A small number of the z=2.5 H-emitters have optical spectroscopic confirmations (Malkan, Teplitz, and McLean (1996); Malkan et al. (2000b), and one of them even turned out to be a background z=3.31 galaxy which had been detected in the 2.16 m filter by its redshifted [OIII] emission doublet. However optical spectroscopy is not a general solution, because it relies on the same rest-frame far-UV that we already suspect is being absorbed by dust.
Many of these objects will not be spectroscopically confirmed and studied in detail without near-IR spectroscopy. Fortunately, the new generation of NIR spectrographs on large telescopes is now capable of doing the job. For example, NIRSPEC has confirmed the MTM “Galaxy D” in the 0953+549 supercluster field, as it also shows the [OIII] doublet at z=2.49, the same as its H line in the infrared (Malkan et al. , 2000b).
Finally, if we do not require specific redshifts for individual galaxies, we can still learn a significant amount about the Immature Universe through the cruder measurements of ultradeep source counts and even diffuse background measurements at long wavelengths. As has often been noted, all the methods based on measurements at really long wavelengths (beyond 100 m) benefit from the added power of positive rather than negative K-corrections. Somewhat coincidentally, they also suffer from the problem that the brightnesses of galaxies at wavelengths longward of 100 m are not nearly so well known as at shorter wavelengths, because IRAS only observed out to 100 m. One approach has been to make theoretical calculations of the dust re-radiation spectrum for various distributions of stars and interstellar matter (Charlot and Fall 2000.) The other approach is to assume that high-redshift galaxies are just the same as low-redshift ultraluminous galaxies of the same given luminosity, and use new ISOPHOT observations of them which extend out to 200 m. The first empirical description of the systematic tendency for more luminous galaxies to have sharper sub-millimeter turnovers (since their strong star formation gives them hotter far-IR peaks) was presented in Spinoglio et al. (1995). An improved version of this correlation, based on new ISOPHOT photometry, has been made by Spinoglio & Malkan (2000).
Several investigators have predicted the Diffuse Infrared Background (DIRB) spectrum. The least theoretical (ie. most closely based on galaxy data) are the “backwards evolution” models. These start from a present-day luminosity function and galaxy spectra, and assume some simple evolutionary law. Figure 6 compares the Malkan & Stecker (1998) model predictions with DIRB measurements which were made subsequently. We found that the AGN contribution was only about a fifth that of the non-Seyfert galaxies.
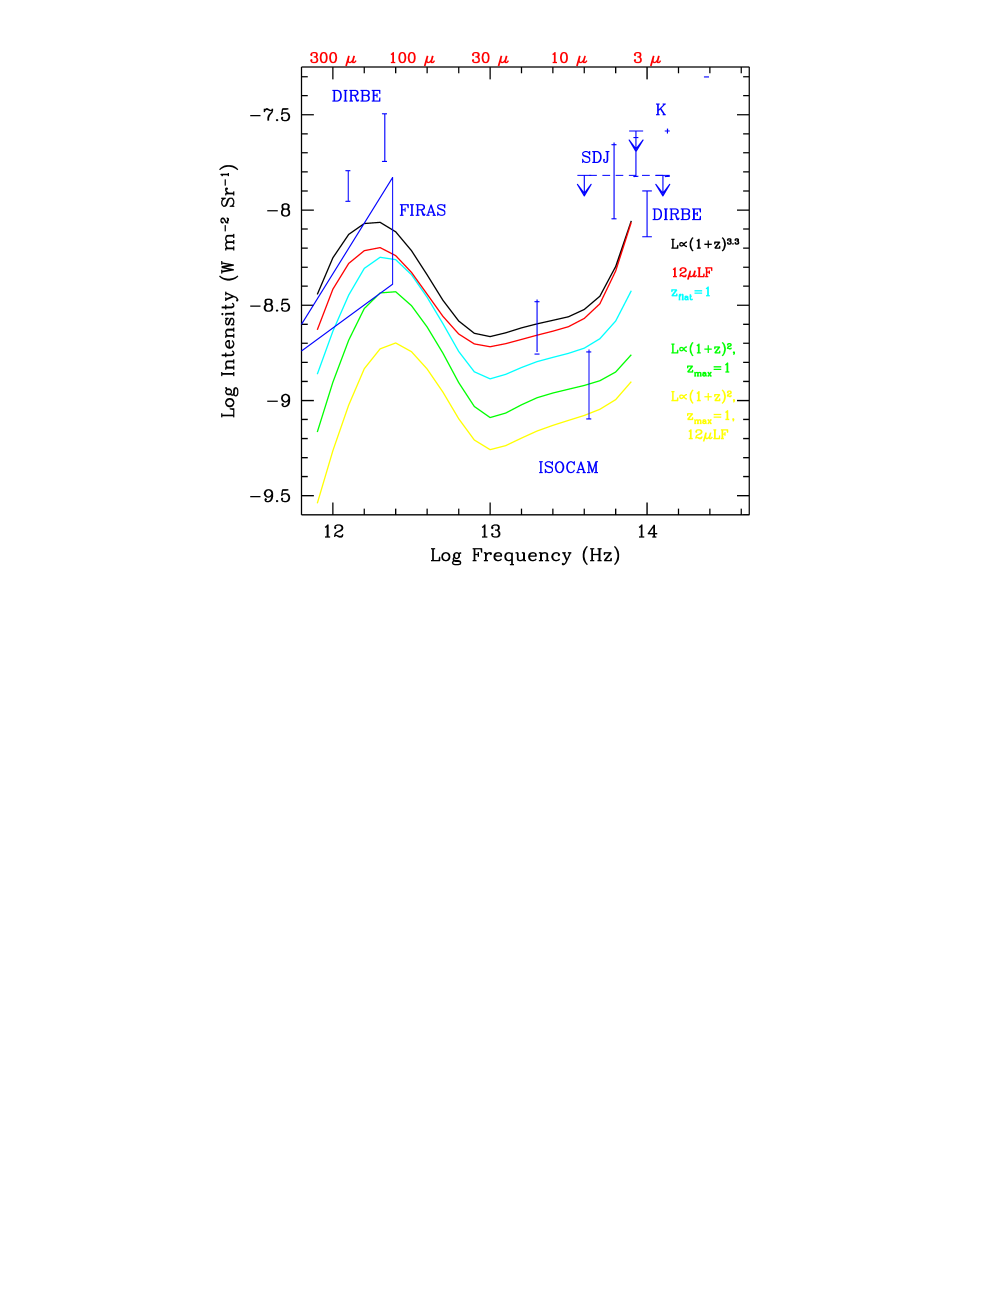
The error bars show ISOCAM lower limits, and COBE detections made after the predictions were published, which are in good agreement with the best model shown by the upper line. It assumed that galaxies–starting with the present-day luminosity function–evolved back in time with luminosity increasing proportional to , up to a redshift of . Very similar results are obtained when the local LF is determined from IRAS observations at either 60 or 12 m.
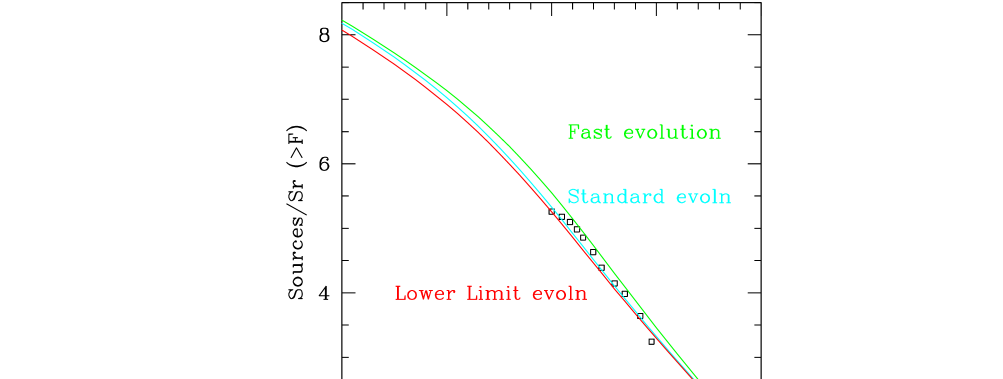
The standard model (which happens to fit the observations very well) assumes galaxy luminosity evolution going as back to a redshift of . The “fast evolution” model has luminosity evolving as , but only back to . The most conservative “lower limit” model assumes luminosity evolution as back to . All models then include galaxies with a constant luminosity function from back to z=5, but this contribution does not add much to the counts.
Figure 7 uses the MS98 model to predict deep source counts at 175 m. Again the agreement with later observations is excellent in both cases (Malkan and Stecker 2000). These successful predictions (not postdictions) suggest that the present day galaxy population has evolved its infrared properties (at least since z=1–2) in a simple way, with a much higher number of high-luminosity galaxies, whose bolometric power output is primarily at 25–100 m rest wavelengths. (For example, at z=1.5 in these models, the predecessor of a modern galaxy resembles a typical “Ultraluminous Infrared Galaxy” from the IRAS survey. These do not need to be considered a “new population”, but rather a strongly evolving population whose remnants are still around today.)
5 Conclusions
Observational cosmologists have realized for decades that long-wavelength data would eventually play a crucial role in studying representative regions of the high-redshift Universe. (The power of optical photometry and spectroscopy has turned out to be a less anticipated, pleasant surprise.) This is based on the rough guide that, for a given sensitivity and number of pixels, the longer the observing wavelength, the better we can study all high-redshift galaxies. We are now seeing this expectation realized across a wide front, from ground-based observations in the (sub-)millimeter and near-IR wavebands, to space-based observations in the mid- and far-IR wavebands in between. The central goal of the next several years of hard work will be obtaining better spectral information–from spectroscopy, or from clever choice of imaging filters. These observational advances (e.g. with SIRTF) will set the stage for the expected breakthroughs with NGST. Especially if NGST includes a mid- to far-IR capability, we should be able to understand the first stages in the lives of galaxies as well as we understand them in the present epoch.
It is a pleasure to thank Harry Teplitz for help in preparing some of the Figures, and editorial improvements.
References
- [1] Barger, et al. 2000, astro-ph 0001096
- [2] Bechtold, J.; Elston, R.; Yee, H. K. C.; Ellingson, E.; Cutri, R. M. 1998 in The Young Universe: Galaxy Formation and Evolution at Intermediate and High Redshift. Edited by S. D’Odorico, A. Fontana, and E. Giallongo. ASP Conference Series; Vol. 146; 1998, p.241
- [3] Charlot, S. & Fall, S.M. 2000, astro-ph 0003128
- [4] Colbert, J. et al. 2000, in preparation
- [5] Colbert, J. & Malkan, M.A. 2000, in preparation
- [6] Kawara, et al. 1998 A&A 336, L9
- [7] Malkan, M.A. et al. 2000a, in preparation
- [8] Malkan, M.A. et al. 2000b, in preparation
- [9] Malkan, M.A. & Stecker, F. S. 2000, in preparation
- [10] Malkan, M.A. & Stecker, F. S. 1998, ApJ, 496, 13
- [11] Malkan, M.A., Teplitz, H. I., & McLean, I.S. 1995 ApJL, 448, L5
- [12] Malkan, M.A., Teplitz, H. I., & McLean, I.S. 1996 ApJL, 468, L9
- [13] McCarthy, P. et al. 1999, ApJ 520, 548
- [14] Pettini, M., Kellogg, M., Steidel, C.C., Dickinson, M., Adelberger, K.L., & Giavalisco, M., 1998, ApJ 508, 539
- [15] Pettini, M. et al. 2000, in preparation
- [16] Puget, J. et al. 1999 A&A 345, 29
- [17] Rowan-Robinson, M. et al. 1997, MNRAS 289, 490.
- [18] Smail, I., Ivison, R.J., & Blain, A.W. 1997, ApJL, 490, L5
- [19] Spinoglio, L. et al. 1995 ApJ, 453, 616
- [20] Spinoglio, L. & Malkan, M. 2000, in preparation
- [21] Steidel, C. et al. 1996, AJ 112, 352
- [22] Steidel, C. et al. 1998, ApJ 492, 428
- [23] Teplitz,H.I, Malkan,M.A., & McLean,I.S., 1999, ApJ 514, 33
- [24] Teplitz,H.I, Malkan,M.A., & McLean,I.S., 1998, ApJ 506, 519
- [25] Thompson, R.I. et al. 1999 AJ, 117, 17
- [26] Yan, L. et al. 1999 ApJ Lett 519, 47.