Five High-Redshift Quasars Discovered in Commissioning Imaging Data of the Sloan Digital Sky Survey1
Abstract
We report the discovery of five quasars with redshifts of and -band magnitudes of (). All were originally selected as distant quasar candidates in optical/near-infrared photometry from the Sloan Digital Sky Survey (SDSS), and most were confirmed as probable high-redshift quasars by supplementing the SDSS data with and measurements. The quasars possess strong, broad Ly emission lines, with the characteristic sharp cutoff on the blue side produced by Ly forest absorption. Three quasars contain strong, broad absorption features, and one of them exhibits very strong Nv emission. The amount of absorption produced by the Ly forest increases toward higher redshift, and that in the = 5.27 object () is consistent with a smooth extrapolation of the absorption seen in lower redshift quasars. The high luminosity of these objects relative to most other known objects at makes them potentially valuable as probes of early quasar properties and of the intervening intergalactic medium.
keywords:
quasars: general – surveys1 Introduction
Since the identification of the first quasar redshift (3C 273, Schmidt (1963)), quasars have been at the forefront of modern cosmology. With luminosities tens or hundreds of times higher than those of galaxies, quasars are a powerful probe of the distant primordial universe. Over the past decade approximately two hundred objects above redshift four have been discovered, and there is a growing consensus that the number density of luminous quasars peaks between redshifts of two and three and steeply declines out to the limits of current measurements (; see Warren, Hewett, & Osmer 1994; Schmidt, Schneider, & Gunn (1995); Kennefick, Djorgovski & de Carvalho (1995)). Recent studies (Fan et al. (1999),2000) have dramatically increased the number of known quasars with redshifts larger than 4.5, opening the possibility of investigating the quasar luminosity function at redshift five and beyond; this information will determine whether the number density of quasars continues to decline with increasing redshift, or whether theoretical models ( Haiman & Loeb (1998)) that predict a significant number of quasars at are correct.
The majority of high-redshift quasars have been identified by optical color selection. As the result of intergalactic absorption, the flux in the spectral region shortward of Ly in distant objects is significantly attenuated. The onset of the Ly forest and the Lyman break can be detected with broad-band imaging. Multicolor optical surveys (Warren, Hewett, & Osmer (1991), Irwin, McMahon, and Hazard (1991), Djorgovski et al. (1999)) have proven effective in identifying quasars, but as most such surveys lack information redward of the band, they have difficulty distinguishing between quasars at redshifts larger than 4.8 and cool stars. Recently, the commissioning data of the Sloan Digital Sky Survey (SDSS, York et al. (2000)) have led to the identification of new high-redshift quasars at an unprecedented rate: approximately 45 quasars at (two at , Fan et al. (1999),2000; Schneider et al. (2000)), have been published in the past two years. These quasars, at , are at the luminous end of the quasar luminosity distribution. (Throughout this paper cosmological properties are calculated assuming = 50 km s-1 Mpc-1 and = 0.5.)
In addition to wide area surveys, color selection for high-redshift objects has been applied to small, deep fields. Three galaxies at have been spectroscopically confirmed (Hu, Cowie, & McMahon (1998); Weymann et al. (1998); Hu, McMahon, & Cowie (1999)), and recently Stern et al. (2000) found an AGN () at . The Hubble Deep Field has led to the discovery of high-redshift candidates ( 6-10, Lanzetta et al. (1999); Chen et al. (1999)); these objects, however, are orders of magnitude less luminous than quasars, and their spectral properties are difficult to study even with the world’s largest telescopes.
Although the barrier was broken more than two years ago, objects at these extreme redshifts are still rare enough that each new example is a potentially valuable probe of the very early universe. This is especially true in the case of the most luminous quasars, since follow-up spectroscopy of these relatively bright objects can reveal information about the physical conditions in early quasars and about the state of the intergalactic medium at very high redshifts. The SDSS collaboration has undertaken extensive efforts to search for high-redshift quasars. In this paper, we report the discovery of five quasars at , of which the most distant is at .
2 Selection of Quasar Candidates
The SDSS (York et al. 2000) utilizes a wide-field camera with 54 CCDs (Gunn et al. (1998)), mounted on a dedicated 2.5m telescope at the Apache Point Observatory (APO), New Mexico, to survey steradians of the sky around the Northern Galactic Cap. CCD images in five broad optical bands (, , , , , centered at 3540 Å, 4770 Å, 6230 Å, 7630 Å and 9130 Å ; Fukugita et al. (1996)) yield a nominal detection of point sources in AB magnitudes of 22.3, 23.3, 23.1, 22.3, and 20.8, respectively. The commissioning data have so far covered square degrees, mostly near the equatorial region, .
With five bands and a spectral resolution of , the SDSS imaging data can distinguish quasars from stars in a broad redshift range (Fan (1999)). At , quasars lie well away from the stellar locus in the color space, due to the large equivalent width of the Ly emission line and the significant absorption produced by the Ly forest and Lyman limit systems. At redshifts between 4.4 and 5, the color becomes large, and is near zero. At , the flux drop shortward of the redshifted Ly emission line affects the -band magnitude, and the color increases with redshift. At this point the quasar track quickly approaches the red end of the stellar locus in the color diagram; the rise in contamination by very cool stars requires that additional discriminators be added to aid the quasar selection. For quasars, the underlying continuum longward of Ly can be approximated with a power law (Francis et al. (1991); Schneider, Schmidt & Gunn (1991); Zheng et al. (1997)) of , leading to a small color differences in bands located redward of the Ly emission line ( blue band red band 0). This small color difference contrasts sharply with the colors of most cool stars (Leggett et al. (1996), 2000), whose flux rises rapidly towards longer wavelengths.
Our target selection is based on three regions in SDSS color space: (1) and ; (2) and ; or (3) -band detection only, i.e. and the detection in the other four bands is below . If an object’s or magnitude is below the respective detection level, we use the latter in calculating the color in case (1) and (2). (Note the ∗ superscript for the magnitudes; the measurements reported here are based on a preliminary calibrations of the SDSS photometric system.) In addition, an object must be classified as a point source by the SDSS processing software and have to be included as a quasar candidate. We applied these selection criteria to square degrees of SDSS imaging data acquired in 1999 March and 2000 February.
The selection criteria used here differ from those employed by Fan et al. (1999, 2000) to identify quasars. Whereas Fan et al. required , candidates in this paper can be undetected in the band. The flux measurements for this paper’s candidates often have lower signal-to-noise ratio, and a sample drawn from these selection criteria will naturally be more susceptible to contamination from non-quasars than those in Fan et al. The color cuts in this paper are closer to the stellar locus than the Fan et al. criteria; this will also resultin a reduction in the selection efficiency.
We obtained IR photometry of quasar candidates in the and bands at the NASA Infrared Telescope Facility (IRTF) at Mauna Kea, Hawaii. The observations were taken on 2000 March 9-12 using the NSFCam equipped with a 256256 InSb array. The plate scale was 030 pixel-1, and the seeing was 12 in the -band. Each selected target was imaged with standard dithering technique with total exposure times of 7 min and 5 min in and , respectively. Images of IR standard stars were taken throughout the observations to monitor the magnitude zero points. Typical photometric errors are in the 0.05-0.1 magnitude range, depending on the brightness of objects; see Tsvetanov et al. (2000) for details of the observations and data calibration. We observed known SDSS quasars with redshifts greater than 4 to empirically calibrate our selection technique. Our additional color constraints are and . Approximately ten such objects whose colors closely resembled those of known quasars were selected. Note that four of the five quasars are at redshift smaller than 5, and they can be selected by the SDSS data alone (Fan et al. (1999), 2000).
3 Spectroscopic Observations
Spectroscopic follow-up observations of SDSS high-redshift quasar candidates were carried out in 2000 February and March, with the Digital Imaging Spectrograph (DIS) of the APO 3.5m telescope. The DIS is a double spectrograph; for high-redshift quasars, only the red part of the low-resolution spectrum, covering the wavelength range 5400 Å to 10000 Å at 13 Å resolution, contained any useful signal. The exposure time for each object was 30 minutes; even with a limited signal-to-noise ratio in the spectra, the redshift identifications, based on the strong, asymmetric Ly emission line and absorption produced by the Ly forest, are unambiguous. The observations in February were made before the IRTF run. Of the six candidates, only one, SDSS 11290142, turned out to be a quasar. The J2000 coordinates are given in the object name (format hhmmss.ss+ddmmss.s; see Fan et al. (1999).) For brevity, we have shortened the names to SDSS hhmm+ddmm throughout the text.) In late March we observed five SDSS/IR candidates, and two, SDSS 10210309 and SDSS 1208+0010, are quasars.
After the initial identification with the APO data, additional spectroscopic observations of the three quasars were obtained in 2000 April with the Low Resolution Spectrograph (LRS; Hill et al. (2000), Schneider et al. (2000)) at the prime focus of the Hobby-Eberly Telescope (Ramsey et al. (1998)) at McDonald Observatory. The LRS configuration of a 2′′ slit, 300 line mm-1 grating, and OG515 blocking filter produced spectra with a wavelength coverage of 5150 Å to 10,150 Å at a resolution of 20 Å. The exposure times were typically 30 minutes.
Two additional SDSS/IR quasar candidates were observed with the Keck 10m telescope on April 5-6, and both of them, SDSS 14510104 and SDSS 11220229, are quasars. The spectra were taken with the Echellette spectrograph and imager (ESI, Epps & Miller (1998)) on the Keck Observatory 10-m telescope. The ESI was used in high dispersion mode which covers the wavelength range of 4000 to 11000 Å with 11 km s-1 resolution. The quasars were viewed through a 1′′ wide slit oriented at the parallactic angle. The exposure time is 20 minutes each. The quasar, SDSS 1208+0010, was also observed for 30 minutes. The spectra were flux calibrated relative to the standard star G191B2B. The spectra were extracted and reduced using standard IRAF programs, and binned to 3.85Å.
Only one of the five “non-infrared” candidates, observed in February, is a quasar. Of the seven SDSS/IR candidates observed, four are quasars, while the other are late-type stars. This result tentatively suggests that IR selection may significantly improve the selection efficiency, but clearly a larger sample is needed to confirm this conclusion. Table 1 lists the optical/IR photometric measurements.
The quasar spectra are displayed in Fig. 2, with prominent spectral features marked. All the spectra have been placed on an absolute flux scale by matching the magnitudes in Table 1 with the magnitudes synthesized from the spectrum. The Keck and HET spectra of SDSS 1208+0010 reveal the C iv emission at Å, which is not clear in the data taken at APO.
4 Discussion
Table 2 contains the redshift (see notes below for the specifics of the measurements for each object), AB1450 (the AB magnitude of the quasar at 1450 Å in the rest frame, corrected for Galactic absorption), the power law index of the continuum, the continuum depression due to absorption in the Ly and Ly regions ( and ; see Oke & Korycansky (1982)), and the absolute magnitude of the quasars. The Galactic extinction is calculated using the reddening map of Schlegel, Finkbeiner & Davis (1998). The luminosities for the quasars were calculated assuming that the continuum power law slope from the far ultraviolet to the optical was (Schneider, Schmidt & Gunn (1991)). The individual power law slopes, and hence the depression estimates, are quite uncertain given the limited baseline available in the spectra and the presence of BAL features. All are moderately luminous quasars, and the spectra of three contain BAL features. Each spectrum contains at least one excellent candidate for a damped Ly system, and there is no detected flux below the rest frame Lyman limit in any of the quasars.
As shown in Figure 2, the extent of intergalactic absorption shortward of the redshifted Ly emission increases from to . This is reflected in the continuum depression values in Table 2. However, the residual flux can be seen in all the spectra, particularly around the Ovi+Ly feature, suggesting that the intergalactic medium is not completely opaque. Our measurements are consistent with the known distributions of the Ly forest absorption as derived at lower redshifts (Press & Rybicki (1993)).
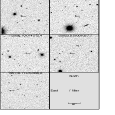
The emission features in these quasars are common among AGN at lower redshift. Three of the the quasars exhibit significant BAL features. Finding charts for the five quasars are given in Fig. 1.
Notes on the quasars:
SDSS 10210309 ( = 4.70): The sharp split of the Ly and Nv lines may suggest unusually strong Nv emission. A simple fit to a 300Å- region longward of the Ly cutoff yields a Nv/Ly ratio of 0.64 for the narrow features. If the split is a result of Nv absorption, the corresponding wavelength for the C iv absorption counterpart should be centered at Å. While a significant C iv BAL trough is present in the spectrum, it is centered at Å. The redshift determined by the Oi, Siiv+Oiv], and C iv emission lines are consistent with each other at the 0.005 level. The Ly and Nv emission shows redshifts that are consistent (with slightly larger errors) with the other lines.
SDSS 11220229 ( = 4.80): This object has the strongest emission lines among the five. The measurements of C iv, Oi, Nv and Ly emission yields a redshift of . The Ly absorption cutoff is not as sharp as the others, stretching Å with several narrow absorption troughs.
SDSS 11290142 ( = 4.85): This quasar is slightly more luminous than 3C 273, which in the adopted cosmology is . It displays a number of spectacular BAL features; because of this, many of the properties given in Table 2 contain large uncertainties. Strong, broad troughs of C iv and Siiv+Oiv] dominate the spectrum, and there is a suggestion of the presence of Oi and Nv absorption features. The redshift is based on assigning a rest wavelength of 1219 Å to the peak of the Ly emission line (see Schneider, Schmidt & Gunn (1991)). The observed values of the continuum depression are exceptionally large; this almost certainly arises from significant intrinsic absorption.
SDSS 1208+0010 ( = 5.27): Very strong, relatively narrow Ly and Nv emission dominate the spectrum; this spectrum bears an uncanny resemblance to that of the quasar PC 0910+5625 (Schmidt, Schneider, & Gunn (1987)). The Nv,Oi, and C iv lines yield a consistent redshift; the peak of the Ly feature occurs at 1218 Å, typical for quasars at redshifts above four (Schneider, Schmidt & Gunn (1991)). The depression due to the Ly forest (see Table 2) is quite large, but not unusual for this redshift, suggesting that there is not a dramatic change in the character in the Ly forest from lower redshifts to at least .
SDSS 14510104 ( = 4.67): The redshifts determined from the peaks of C iv and Siiv+Oiv] match that of the Ly edge within 0.005. A significant, broad absorption trough is present between Å.
The discovery of these quasars once again demonstrates the ability of the SDSS to effectively identify quasars, and extends the SDSS redshift range to well beyond five. By supplementing the SDSS measurements with and photometry, we have been able to efficiently identify (success rate of 50%) high-redshift quasars in magnitude/color space regions that are fainter and closer to the stellar locus than were presented in Fan et al. (1999,2000); it is likely that IR photometry will be a valuable tool in the search for faint, quasars. Our IR photometry is only a test, and the results do not constitute a complete sample. To date the SDSS has imaged but a few percent of the planned survey area; based on the results to date, the complete survey should contain well over a hundred quasars found with well-defined selection criteria.
Acknowledgements.
The Sloan Digital Sky Survey (SDSS) is a joint project of The University of Chicago, Fermilab, the Institute for Advanced Study, the Japan Participation Group, The Johns Hopkins University, the Max-Planck-Institut für Astronomie, Princeton University, the United States Naval Observatory, and the University of Washington. Apache Point Observatory, site of the SDSS, is operated by the Astrophysical Research Consortium. Funding for the project has been provided by the Alfred P. Sloan Foundation, the SDSS member institutions, the National Aeronautics and Space Administration, the National Science Foundation, the U.S. Department of Energy, and Monbusho, Japan. The SDSS Web site is http://www.sdss.org/. We would like to thank Russet McMillan (APO), William Golisch (IRTF), Bob Goodrich, Terry McDonald (Keck), Grant Hill and Matthew Shetrone (HET) for their assistance with the observations. David Weinberg provided a number of comments that improved the paper. This work is partially supported by NASA Long Term Space Astrophysics grant NAGW-4443 to the Johns Hopkins University (WZ and ZT), and by NSF grant AST99-00703 (DPS).References
- Chen et al. (1999) Chen, H-W., Lanzetta, K. M., & Pascarelle, S. 1999, Nature, 398, 586
- Djorgovski et al. (1999) Djorgovski, S.G., Odewahn, S.C., Gal, R.R., Brunner, R., de Carvalho, R. R., Longo, G., & Scaramella, R. 1999, BAAS, 31, 1235
- Epps & Miller (1998) Epps, H.W. & Miller, J.S. 1998, in Proc of SPIE 3355, Optical Astronomical Instrumentation, ed. Sandro D’Odorico, (Bellingham, WA:SPIE), 48
- Fan (1999) Fan, X. 1999, AJ, 117, 2528
- Fan et al. (1999) Fan, X., et al. 1999, AJ, 118, 1
- Fan et al. (2000) . 2000, AJ, 119, 1
- Francis et al. (1991) Francis, P. J., Hewett, P. C., Foltz, C. B., Chaffee, F. H., & Weymann, R. J. 1991, ApJ, 373, 465
- Fukugita et al. (1996) Fukugita, M., Ichikawa, T., Gunn, J.E., Doi, M., Shimasaku, K., & Schneider, D. P. 1996, AJ, 111, 1748
- Gunn et al. (1998) Gunn, J. E. et al. 1998, AJ, 116, 3040
- Haiman & Loeb (1998) Haiman, Z., & Loeb, A. 1998, ApJ, 503, 505
- Hill et al. (2000) Hill, G.J., et al. 2000, in preparation
- Hu, Cowie, & McMahon (1998) Hu, E. M., Cowie, L. L. & McMahon, R. G. 1998, ApJ, 502, L99
- Hu, McMahon, & Cowie (1999) Hu, E. M., McMahon, R. G. & Cowie, L. L. 1999, ApJ, 522, L9
- Irwin, McMahon, and Hazard (1991) Irwin, M.J., McMahon, R.G., and Hazard, C. 1991, in The Space Distribution of Quasars, edited by D. Crampton (ASP, San Francisco), p. 117
- Kennefick, Djorgovski & de Carvalho (1995) Kennefick, J.D., Djorgovski, S.G., & de Carvalho, R.R. 1995, AJ, 110 , 2553
- Lanzetta et al. (1999) Lanzetta, K. M., Chen, H-W., Fernández-Soto, A., Pascarelle, S., Puetter, R., Yahata, N., & Yahil, A. 1999, astro-ph/9907281
- Leggett et al. (1996) Leggett, S. K., Allard, F., Berriman, G., Dahn, C. C., Hauschildt, P. H. 1996, ApJS, 104, 117
- Leggett et al. (2000) Leggett, S. K., et al. 2000, ApJ, in press
- Lupton, Gunn, & Szalay (1999) Lupton, R.H., Gunn, J.E., & Szalay, A. 1999, AJ, 118, 1406
- Oke & Korycansky (1982) Oke, J.B., & Korycansky, D.G. 1982, ApJ, 255, 11
- Press & Rybicki (1993) Press, W. H., & Rybicki, G. B. 1993, ApJ, 418, 585
- Ramsey et al. (1998) Ramsey, L.W., et al. 1998, in Proc. SPIE, 3352, Advanced Technology Optical/IR Telescopes VI, Ed. L.M. Stepp, (Bellingham, WA:SPIE), 34
- Schlegel, Finkbeiner & Davis (1998) Schlegel, D.J., Finkbeiner, D.P., & Davis, M. 1998, ApJ, 500, 525
- Schmidt (1963) Schmidt, M. 1963, Nature, 197, 1040
- Schmidt, Schneider, & Gunn (1987) Schmidt, M., Schneider, D.P., and Gunn, J.E. 1987, ApJL, 321, 7
- Schmidt, Schneider, & Gunn (1995) Schmidt M., Schneider, D.P., & Gunn J.E. 1995, AJ, 110, 68
- Schneider, Schmidt & Gunn (1991) Schneider, D.P., Schmidt M., & Gunn J.E. 1991, AJ, 101, 2004
- Schneider et al. (2000) Schneider, D.P., et al. 2000, PASP, 112, 6
- Stern et al. (2000) Stern, D., Spinrad, H., Eisenhardt, P., Bunker, A. J., Dawson, S., Stanford, S. A., & Elston, R. 2000, ApJ, 533, L75
- Tsvetanov et al. (2000) Tsvetanov, Z., et al. 2000, in preparation
- Warren, Hewett, & Osmer (1991) Warren, S. J., Hewett, P. C., & Osmer, P. S. 1991, ApJS, 76, 23
- Warren, Hewett, & Osmer (1994) . 1994, ApJ, 421, 412
- Weymann et al. (1998) Weymann, R. J., Stern, D., Bunker, A., Spinrad, H., Chaffee, F. H., Thompson, R. I., & Storrie-Lombardi, L. 1998, ApJ, 505, L95
- York et al. (2000) York, D. et al. 2000, AJ, in press
- Zheng et al. (1997) Zheng, W., Kriss, G.A., Telfer, R.C., Grimes, J.P., & Davidsen, A.F. 1997, ApJ, 475, 469
Finding charts of the five quasars. All the charts are -band images from the SDSS. North is up, East to the left, and the individual charts are 240′′ on a side.
Spectra of the five quasars. The wavelengths of identified and expected major emission features are marked. The telescope names for individual spectra are marked at the upper-left corner of each panel. The fluxes have been normalized to the respective SDSS -band magnitudes. The spectral resolution is 13Å for the APO data, 20 Å for the HET data, and Keck spectra have been rebinned to 3.85 Å.
| ObjectccThe J2000 coordinates are given in the object name (hhmmss.ss+ddmmss.s). | E(B-V) | |||||||
|---|---|---|---|---|---|---|---|---|
| SDSSp J102119.16030937.2 | 23.72 | 25.82 | 21.76 | 20.09 | 20.02 | 18.77 | 17.08 | 0.042 |
| SDSSp J112242.98022905.1 | 23.73 | 24.77 | 22.22 | 20.38 | 20.47 | — | 0.055 | |
| — | ||||||||
| SDSSp J112956.10014212.4 | 24.06 | 25.26 | 22.02 | 19.64 | 19.51 | 17.51 | 16.09 | 0.072 |
| SDSSp J120823.82+001027.7 | 24.39 | 24.77 | 22.75 | 20.79 | 20.72 | 19.43 | 18.10 | 0.024 |
| SDSSp J145118.77010446.2 | 24.40 | 24.45 | 22.65 | 20.70 | 20.53 | 19.43 | 18.17 | 0.044 |
| Object | AB1450 | aa Spectral energy index (); typical uncertainties are several tenths. | bbCalculated assuming = 50, = 0.5, and a spectral energy index between the ultraviolet and blue band of . | |||
|---|---|---|---|---|---|---|
| SDSSp J102119.16030937.2 | 4.696 0.004 | 20.25 | 0.58 | 0.76 | ||
| SDSSp J112242.98022905.1 | 4.795 0.004 | 20.58 | 0.64 | 0.79 | ||
| SDSSp J112956.10014212.4 | 4.85 0.03 | 19.22 | 0.84 | 0.97 | ||
| SDSSp J120823.82+001027.7 | 5.273 0.004 | 20.47 | 0.71 | 0.81 | ||
| SDSSp J145118.77010446.2 | 4.672 0.004 | 20.42 | 0.71 | 0.86 |