First Structure Formation and the First Stars \toctitleFirst Structure Formation and the First Stars 11institutetext: University of Illinois, Urbana, IL 61801 22institutetext: Harvard University, Cambridge, MA 02138 33institutetext: MIT, Cambridge, MA 02138
*
Abstract
We discuss the results of recent 3D simulations of first structure formation in relationship to the formation of the first stars. On the basis of a new, high-resolution AMR simulation (spatial dynamic range = ), we conclude that the first stars are likely to be massive.
1 First Cosmological Objects
Hierarchical theories of structure formation such as Cold Dark Matter (CDM) and its variants have been very successful in accounting for the existence of galaxies, galaxy clusters and cosmological large scale structure in the low redshift universe (cf. Ostriker 1993, Bertschinger 1997). The cynic would say that this is what they were invented to do. However, the models also make definite predictions at earlier epochs and on different mass scales which can be checked observationally. Some proof that these models are essentially correct is the remarkable agreement achieved between the observed and predicted properties of the Lyman alpha forest at (e.g., Zhang et al. 1997, Rauch 1998)—something the models were not designed to do. Encouraged by this agreement, we may ask: what were the first objects to form in such models?
Assuming the CDM power spectrum extends to very small mass scales, the first cosmological objects to form are small dark matter halos collapsing from small scale density fluctuations at high redshift () (Couchman & Rees 1986, Tegmark et al. 1997). Halos whose mass is significantly less than the cosmological Jeans mass would not be able to trap the baryonic fluid, and hence not form astrophysical objects. Conversely, halos of approximately this mass or greater would be expected to form highly condensed objects (stars, black holes, etc.) provided the gas can cool and transport angular momentum. At the temperatures and densities prevailing in such halos, the primordial gas cools inefficiently by collisional excitation of H2 molecules which exist in low abundance. As described in more detail below, H2 forms via nonequilibrium gas phase reactions in which the tiny post-recombination electron abundance acts as a catalyst.
This chemistry, combined with the nonlinear dynamics of halo formation and mergers, makes this epoch of structure formation exceedingly complex and interesting. We have termed this epoch first structure formation, and have explored it numerically in recent papers (Abel et al. 1998a,b; Abel, Bryan & Norman 1998; 2000; Norman, Abel & Bryan 1999). Here we review our numerical methodologies and findings, and discuss their implications to the first stars.
2 Relevance to First Stars
First structure formation is relevant to the theme of this conference as it is likely that the first stars are formed as a byproduct. Note this is not a theoretical certainty since it has been variously argued that the first objects are not stars in the usual sense, but rather objects at both extremes of the mass spectrum, ranging from supermassive black holes (Silk 1998) to Jupiter sized “clumpuscules” (Combes & Pfenniger 1998). Since the mass function of the first objects is not known, much of the theoretical literature consists of making various assumptions about the primordial mass function (PMF) and working out the cosmological consequences. Carr, Bond & Arnett (1984) presented a comprehensive review of the prevailing ideas as of 1984, many of which are still relevant today. Couchman & Rees (1986) placed the matter in a modern cosmological framework. Both papers highlighted the impact of massive stars and possibly very massive objects (VMOs) on heating, ionizing and enriching the pregalactic medium with heavy elements.
A few authors have attempted to compute the PMF from first principles: Silk (1983) argued for a flat PMF between on the basis of a linear analysis of thermal instability in a primordial gas near the critical density for formation via three body reactions. Padoan, Jiminez & Jones (1997) applied the statistical model for star formation of Padoan (1995) to primordial globular cluster formation, and found a PMF slightly shallower than the Miller-Scalo (1979) IMF with a lower cutoff of .
Given the theoretical uncertainties, let us pose the following question: do stars form in the first nonlinear structures in hierarchical models? Indications from our recent numerical simulations is that they do. In this paper, we follow our historical developments which lead us toward this conclusion.
3 H2 Formation and the Minimum Mass to Cool
After recombination, the universe is filled with a neutral, metal-free gas of H and He and trace amounts of D and Li. How can such a gas cool to form stars? Long ago it was realized that small amounts of molecular hydrogen will form in a primordial gas via two reaction pathways: the H- channel (McDowell 1961):
and the channel (Saslaw & Zipoy 1967):
At high redshifts the fragile H- molecule is photodissociated by the CMB, and thus the H channel dominates the production of H2 . At lower redshifts, the situation is reversed and the H- channel dominates. We see from Eq. (1) that free electrons catalyze the formation of H2 via the H- channel. Where do they come from? Well, the post-recombination primordial gas is not totally neutral. This is because the recombination time is longer than the cooling time in such a diffuse gas, and the electron abundance is out of equilibrium at a given temperature. Detailed nonequilibrium calculations show that there is a residual ionization fraction of about at (Galli & Palla 1998). This is enough to form H2 with an abundance of .
As gas concentrates in the potential wells of dark matter halos, the H2 fraction increases according to a simple analytic result (Abel et al. 1998a). In the absence of an external UV background at gas temperatures below 6000 K, one can integrate the rate equations for the free electron and H2 fractions in a collapsing gas cloud to get:
| (2) | |||||
| (3) |
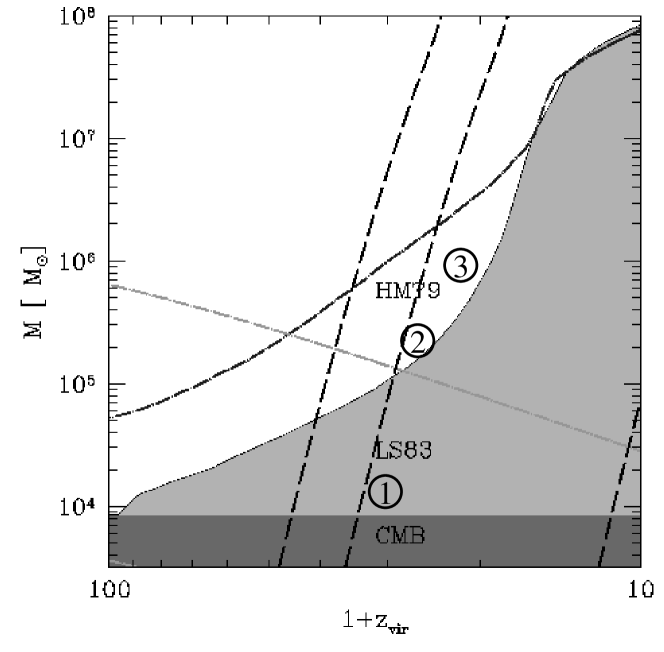
where , and are the rate coefficients of photo-attachment of H- and recombination to neutral hydrogen, the initial recombination timescale, ionized fraction, and neutral hydrogen number density, respectively. Given the H2 cooling function, one can ask at what concentration will the cooling time be less than the Hubble time for a spherical top hat perturbation of mass M collapsing at redshift z? This analysis was first carried out by Abel (1995) and later by Tegmark et al. (1997), who found a rather universal result: . Fig. (1) shows the locus of critical cloud masses as a function of redshift for two choices of the cooling function, which is still somewhat uncertain (for a recent discussion of the uncertainties, see Tiné, Lepp & Dalgarno 1998). As can bee seen, extremely rare peaks of mass will collapse and cool at , whereas more typical fluctuations of mass will collapse and cool at . The evolution of such a peak described in detail below is shown by the circled numbers in Fig. 1.
1 Simulating First Structure Formation
First structure formation is a well-posed problem both physically and computationally, since for a given cosmogony the thermodynamic properties, baryon content, and chemical composition are specified for the entire universe at high redshifts, at least in a statistical sense. Futhermore, the dominant physical laws are readily identified: the general theory of relativity describing the evolution of the background spacetime geometry and particle geodesics, the Euler equations governing the motion of the baryonic fluid in an expanding universe, and the primordial kinetic rate equations determining the chemical processes. Radiation backgrounds, save the CMB, are entirely absent prior to first structure formation in standard models. The complete set of equations governing first structure formation in a cosmological framework are given in Anninos et al. (1997).
Unlike traditional star formation calculations, which are plagued by a lack of knowledge of appropriate initial conditions, the initial conditions for first structure formation calculations are well defined—namely, a Gaussian random field of density fluctuations characterized by a power spectrum whose shape can be computed theoretically. The amplitude of the fluctuations is constrained by observations on a variety of scales and redshifts (Ostriker 1993, Croft et al. 1999, Nusser & Haehnelt 1999). In the calculations described here, we assume a cluster normalized standard cold dark matter (SCDM) model with the following parameters: km/s, .
As in all star formation calculations, resolving the relevant length scales is the principal technical challenge. A simple estimate of what is required is to compare the baryonic Jeans length at a typical collapse redshift of 25 to the solar radius:
| (4) |
Adding a couple more decades in scale to model the cosmological environment brings the total spatial dynamic range to around . This is easily achievable in 1D spherical symmetry with logarithmic or adaptive grids. However, the all-important effects of hierarchical mergers, tidal forces, and fragmentation all demand 3D simulations. Until recently, such dynamic ranges were impossible to achieve in 3D.
We have developed two high-resolution, 3D numerical codes for solving the first structure formatiion equations set forth in Anninos et al. (1997). The first, more primitive code HERCULES (Anninos et al. 1994), uses fixed nested Eulerian grids for an effective resolution of in regions of interest. This code was used to carry out the first self-consistent simulations of first structure formation (Abel et al. 1998) in which we verified the predictions of Tegmark et al. (1997) and quantified the cooled mass fraction in primordial halos. The second, more powerful code ENZO (Bryan & Norman 1997, Norman & Bryan 1999), utilizes an adaptive hierarchical mesh of arbitrary depth to achieve unprecedented resolution wherever it is needed.
Using adaptive mesh refinement (AMR), we have previously reported the results of a simulation of first structure formation which achieved a spatial dynamic range of 262,144 (Abel, Bryan & Norman 1998, 2000; Norman, Abel & Bryan 1999). Here we update that result with a new simulation which achieves an additional factor of 128 in resolution for a total spatial dynamic range of . While not , this is sufficient to characterize the properties of the collapsing protostellar cloud core. The calculation is done in a comoving box 128 kpc on a side. The starting redshift is z=100. At the stopping redshift z=19.1, the range of resolved scales is . The mass resolution in the initial conditions within the refined region are 0.53(8.96) M⊙in the gas (dark matter). The refinement criteria ensure that: (1) the local Jeans length is resolved by at least 4 grid zones, and (2) that no cell contain more than 4 times the initial mass element (0.53 M⊙).
2 Core Formation

To illustrate the physical mechanisms at work during the formation of the first cosmological object in our simulation, we show the evolution of various quantities in Fig. 2. The top panel of this plot shows the virial mass of the largest object in the simulation volume. We divide the evolution up into four intervals. In the first, before a redshift of about 33 (point 1 in Fig. 1), the Jeans mass in the baryonic component is larger than the mass of any non-linear perturbation. Therefore, the only collapsed objects are dark-matter dominated, and the baryonic field is quite smooth.
In the second epoch, , as the non-linear mass increases, gas becomes trapped in the gravitational potential wells of the dark matter halos. However, this gas is not sufficiently dense to cool and the primordial entropy of the gas prevents dense cores from forming. This is shown in the second frame of Fig. 2 by a large gap between the central baryonic and dark matter densities (note that while the central dark matter density is limited by resolution, the baryonic is not, so the true difference is even larger). As mergers continue and the mass of the largest clump increases, its temperature also grows, as shown in the third panel of this figure. The H2 fraction also increases (bottom panel).
By (point 2 in Fig. 1), enough H2 has formed (a few ) that cooling begins to be important. During this third phase, the central temperature decreases and the gas density increases. However, the collapse is quasistatic rather than a runaway freefall because around this point in the evolution, the central density reaches cm-2, and the excited states of H2 are in LTE. This results in a cooling time which is nearly independent of density rather than in the low–density limit where (e.g. Lepp & Shull 1983).
Finally, at (point 3 in Fig. 1), a very small dense core forms and reaches the highest resolution that we allowed the code to produce. We follow the collapse to a final central density of cm-3, well above the critical density for the formation of H2 via 3–body reactions (see Palla et al. 1983). These reactions are included, as well as an escape probability treatment of radiative transfer of the molecular line radiation (Abel et al. 2000) which becomes important at these densities. Finite word length and the lack of an appropriate equation of state forced the termination of the calculation at this point.
3 Core Structure

The structure of the cloud at the end of the calculation is shown in Fig. 4. The quantity plotted is the logarithm of the baryon overdensity on a slice passing through the densest cell at z=19.1. Proceeding from large scales to small scales we see: (6 kpc)–the filamentary cosmological density field, with a dense halo at the intersection of several filaments; (600 pc)–a virialized halo with M⊙ and pc; (60pc)–a dense baryonic core in the center of the cooling halo. From scales of a few pc on down, the core is self-gravitationally bound and collapsing.
Despite the non-spherical structure of the cloud, mass-weighted spherical averages of various quantities centered on the density maximum provide insight into the physical processes governing the formation and evolution of the core. A schematic based on a careful analysis of these radial profiles is shown in Fig. 4.

Jagged lines in Fig. 4 indicate approximate radii where the material makes a kinematic, thermodynamic, or other significant physical transition. Proceeding form large to small radii, we have the virialization shock ( pc); the cooling radius ( pc), defined where the gas temperature reaches its maximum value ; the radius where the gas reaches the minimum temperature allowed by H2 cooling 200K ( pc); the radius where the H2 level population enters LTE ( pc) defined where cm-3; and the radius where 3–body H2 formation reactions become important ( pc), defined where cm-3.
In the settling zone, the H2 number fraction rises from to near . Here H2 cooling is negligible. Inside , a cooling flow is established reducing the gas temperature to . At , the sound crossing time becomes substantially shorter than the cooling time. This suggests that inside this radius the core is contracting quasi–hydrostatically on the cooling time scale, which approaches its constant high–density value at small radii. This constant cooling time of sets the time scale of the evolution of the fragment until it can turn fully molecular via three body associations. Inside pc, the enclosed baryonic mass of exceeds the local Bonnor-Ebert mass, implying this material is gravitationally unstable. However, due to the inefficient cooling, its collapse is subsonic. The radius where defines our protostellar cloud core.
4 Fragmentation?
Inside atomic hydrogen is completely converted into H2 via the 3–body reaction. This increases the cooling rate sufficiently to initiate a freefall collapse in the central part of the core. What will be the fate of this collapsing cloud? Omukai & Nishi (1998) have simulated the evolution of a collapsing, spherically symmetric (1D) primordial cloud to stellar density including all relevant physical processes. Coincidentally, their initial conditions are very close to our final state. Our results agree with theirs where our solutions overlap. Based on their results, we can say that if the cloud does not fragment, a massive star will be formed. Adding a small amount of angular momentum to the core does not change this conclusion (Bate 1998), who found a dynamical bar mode instability efficiently transports angular momentum outward in a 3D simulation of galactic protostellar collapse. A third possibility is that the cloud breaks up into low mass stars via thermal instability in the quasi-hydrostatic phase. Silk (1983) has argued that, due to the enhanced cooling from the 3–body produced H2 , fragmentation of this core might ensue and continue until individual fragments are opacity limited (i.e. they become opaque to their cooling radiation). We do not see any evidence of this. Our code, which resolves the Jeans mass everywhere and at all times, would not suppress the growth of these instabilities if they exist.
Rather, inspection of the density distribution on the smallest resolvable scales shows a centrally concentrated, object of mass M⊙ collapsing supersonically with -4 km/s. The local free fall time is a few hundred years. The protostar is embedded in a flattened nebula with a pronounced one-arm spiral structure, suggesting an operative angular momentum transport mechanism.
5 Implications
The direct implications of our results are that the first stars, here defined to be those which form in a gas of zero metallicity, are massive. Here massive means of order the gravitationally unstable core which forms them M⊙. Where does this mass scale come from? We argue that it comes from the peculiar properties of a gas cooling solely through H2 line excitation, which sets a minimum temperature for the gas of a few hundred K. The other factor is that above cm-3, the cooling time becomes independent of density, meaning that gravitationally bound clouds will evolve quasi-statically until the onset of 3–body production of H2 at much higher densities.
The Bonnor-Ebert mass at and is 240 M⊙, close to our simulated core mass. We suggest that cold gas in the centers of primordial low mass halos fragments into cores of this mass, each of which forms a massive star (10-100 M⊙), or possibly a binary. These stars would be strong sources of UV radiation prior to supernova and/or black hole formation. Recent analyses (Haiman, Abel & Rees 1999; Omukai & Nishi 1999) show that the UV radiation from a single O star per halo will destroy H2 both locally and globally, quenching further star formation by this mechanism. Due to the low binding energy of the parent halo, metals ejected by the supernova explosion would be returned to the pre-galactic medium. Pockets of enriched gas collecting in the cores of more massive halos formed by subsequent mergers would form stars of various metallicities in the familiar but complicated way we have been studying for decades in Galactic molecular clouds. A key question, which must await further numerical investigations, is whether there is a pause in the star formation history of the universe, or rather a smooth transition from the formation of the first stars to the “next stars” as suggested by simulations of Ostriker & Gnedin (1996).
References
- [1] Abel, T. 1995, Thesis, University of Regensburg, Germany
- [2] Abel, T., Anninos, P., Zhang, Y., Norman, M.L. 1997, NewA, 2, 181
- [3] Abel, T., Anninos, P., Norman, M.L., Zhang, Y. 1998a (AANZ), ApJ, 508, 518.
- [4] Abel, T., Bryan, G.L., Norman, M.L. 1998, in Proc. of the MPA/ESO Conference “Evolution of LSS: from Recombination to Garching”, astro-ph/9810215
- [5] Abel, T., Bryan, G.L., Norman, M.L. 2000, ApJ, submitted.
- [6] Abel, T., Stebbins, A., Anninos, P., Norman, M.L. 1998b, ApJ, 508, 530.
- [7] Anninos, P., Norman, M.L., & Clarke, D. A. 1994, ApJ, 436, 11
- [8] Anninos, P., Zhang, Y., Abel, T., Norman, M.L. 1997, NewA, 2, 209
- [9] Bate, M. 1998. ApJL, 508, 95
- [10] Bertschinger, E. 1998. ARAA, 36, 599
- [11] Bryan, G.L., Norman, M.L. 1997, in Computational Astrophysics, eds. D.A. Clarke and M. Fall, ASP Conference #123
- [12] Carr, B.J., Bond, J.R., Arnett, W.D. 1984, ApJ, 277, 445
- [13] Croft, R. et al. 1999, ApJ, 520, 1
- [14] Combes, F. & Pfenniger, D. 1998, J. Ital. Astron. Soc., 69, 413
- [15] Couchman, H. M. P. & Rees, M. J. 1986. MNRAS, 221, 53
- [16] Galli, D. & Palla, F. 1998, J. Ital. Astron. Soc., 69, 337
- [17] Hollenbach, D. & McKee, C. F. 1979, ApJS, 342, 555
- [18] Lepp & Shull 1983
- [19] Haiman, Z., Abel, T. & Rees, M. J. 1999, ApJ, in press (astroph/9903336)
- [20] Miller, G. & Scalo, J. 1979, ApJS, 41, 413
- [21] Norman, M.L., Bryan, G.L. 1999, in Numerical Astrophysics 1998, eds. S. Miyama & K. Tomisaka, Kluwer, 19
- [22] Norman, M. L., Abel, T. & Bryan, G. L. 1999. in “After the Dark Ages: When Galaxies were Young”, Eds. S. Holt & E. Smith, AIP Conference Proceedings 470, AIP Press, 58
- [23] Nusser, A. & Haehnelt, M. 1999, MNRAS, 303, 179
- [24] Omukai, K. & Nishi, R. 1998. ApJ, 508, 1410
- [25] Omukai, K. & Nishi, R. 1999. ApJ, 518, 64
- [26] Ostriker, J. P. 1993. ARAA, 31, 689
- [27] Ostriker, J. P. & Gnedin, N. 1996. ApJ, 472, L63
- [28] Padoan, P. 1995, MNRAS, 277, 377
- [29] Padoan, P., Jiminez, R. & Jones, B. 1997, MNRAS, 285, 711
- [30] Palla, F., Salpeter, E.E., Stahler, S.W. 1983, ApJ, 271, 632
- [31] Rauch, M. 1998. ARAA, 36, 267
- [32] Saslaw, W. C. & Zipoy, D. 1967, Nature, 216, 967
- [33] Silk, J. 1983, MNRAS, 205, 705
- [34] Silk, J. 1998, J. Ital. Astron. Soc., 69, 363
- [35] Tegmark, M., Silk, J., Rees, M.J., Blanchard, A., Abel, T., Palla, F. 1997, ApJ, 474, 1
- [36] Tiné, S., Lepp, S. & Dalgarno, A. 1998, J. Ital. Astron. Soc., 69, 345
- [37] Zhang, Y., Anninos, P., Norman, M. & Meiksin, A. 1997. ApJ, 485, 496