Testing the photoionization models of powerful radio galaxies: Mixed line-emitting media in 3C 321
Abstract
The photoionization models for the narrow emission line regions of powerful radio galaxies have yet to be tested in depth. To this end, we present high-quality long-slit spectroscopy of the powerful double-nucleus radio galaxy 3C 321. The data have good enough spatial resolution to be able to trace the variation in emission-line properties on kpc scales. Continuum modelling and subtraction enables the faint emission line fluxes to be measured in several regions across the emission line nebula. We plot diagnostic line-ratio diagrams and compare them with the predictions of various photoionization models, finding that the data is best fit by models which assume a mixture of optically thin and thick clouds illuminated by a power-law continuum.
The emission line kinematics, line ratios and deduced physical conditions show remarkably little variation across the source. We deduce a mean electron density of and a mean temperature of K. Assuming a single population of optically thick line-emitting clouds, we calculate a mean photoionization parameter of and hence a photoionizing photon luminosity of . This indicates a central engine as luminous as that of the powerful quasar 3C 273, yet there is no evidence for such an energetically prolific central engine at either far-infrared or radio wavelengths. We therefore conclude that the mixed-media models, which give , represent a more likely scenario.
As a by-product of the continuum subtraction we infer that young stellar populations account for of the visible stellar mass in the galaxy, and that these populations are spatially extended.
1E-mail: t.g.robinson@shef.ac.uk
2Department of Physics and Astronomy, University of Sheffield, Sheffield, S7 3RH.
3Department of Physical Sciences, University of Hertfordshire, Hatfield, Hertfordshire, AL10 9AB
Key words: galaxies: active – galaxies: individual: 3C 321 – galaxies: stellar content – galaxies: quasars: emission lines – line: formation
1 Introduction
Emission lines are the most easily measured features of radio galaxies, and yet the physical mechanisms involved in their production are not well understood. Various suggestions have been made as to the method of ionization of the line-emitting gas, including shocks from interactions between the radio jets and the warm clouds [Clark et al. (1998)] and photoionization by a central source [Robinson et al. (1994)]. Central source photoionization is particularly attractive in light of unified schemes for powerful radio sources, which hold that radio galaxies and quasars are a single class of object viewed from different directions [Barthel (1989), Lawrence (1991)]. If these orientation-dependent unified schemes are true, and radio galaxies contain quasar nuclei obscured from direct observation by a dusty torus, we expect to see the effects of the powerful AGN illuminating the surrounding regions. Assuming that central source photoionization is the dominant mechanism, the emission line spectra may be used to infer the properties of the central engine, such as the shape of the photoionizing continuum and its power [Tadhunter et al. (1994), Morganti et al. (1991)]. Indeed, emission-line luminosity has been shown to correlate broadly with 178 MHz radio power [Tadhunter et al. (1998), Rawlings & Saunders (1991)], suggesting a link between the AGN continuum emission and the mechanism of radio-jet production.
One way of investigating the properties of the central engine is by modelling the emission line spectrum of the photoionized gas [Robinson et al. (1987), Binette et al. (1988)]. In general, these models depend on both the properties of the line-emitting medium and the ionizing spectrum, which in turn depends on the properties of the central AGN. The traditional approach has been to assume a power-law or hot black-body continuum ionizing optically thick, solar abundance clouds of gas. This approach has been successful up to a point, but there still remain several outstanding difficulties in explaining the observed spectra of radio galaxies in terms of pure photoionization:
-
•
Discrepant line ratios. Some line ratios are problematic in that they are not correctly predicted by photoionization models in some objects. These include [OIII]/ [Tadhunter et al. (1989a), Morganti et al. (1997b)], HeII/H [Binette et al. (1996)] and [NII]/[OII] [Tadhunter et al. (1994)]. At least some of these discrepancies can be explained in terms of departures from the assumptions of the simplest models. For example, the discrepant [OIII]/, HeII/H ratios can be modelled if the photoionized medium is a mixture of optically thin and thick components [Binette et al. (1996)], while the [NII]/[OII] can be explained in terms of non-solar abundances [Viegas & Prieto (1992)]. However, the mixed-medium model requires specific column depths in the optically thin and thick clouds and cannot explain some of the more extreme line ratios measured in some sources.
-
•
Spatial variations in line ratios. These are often difficult to explain in terms of a central ionizing source. For example, the [NII]/H and [SII]/H line ratios in Cygnus A show no variation in value across both core and extended regions, despite the fact that [OIII] line ratios vary dramatically across the same regions [Tadhunter et al. (1994)].
-
•
The effects of shocks. Line broadening and differences in the widths of lines of different ionization suggest shocks are also important, even in the narrow line region (NLR) where there is little direct morphological evidence for jet/cloud interaction [Clark et al. (1998), Villar-Martin et al. (1999), Capetti et al. (1999)].
To test the photoionization models, high quality spatially resolved spectra of a predominantly photoionized radio galaxy are required. We have obtained such data for the powerful radio galaxy 3C 321. The advantages of this dataset are that it has wide spectral coverage, accurate flux calibration, low airmass, subarcsecond seeing, S/N ratios high enough to measure electron density in several spatial bins (a feature not shared by any other radio galaxy with published spectra), and a high enough S/N in the continuum to allow accurate modelling and subtraction.
The double nucleus host galaxy of 3C 321 is an ideal object for an in-depth study of photoionization models. Its relatively low redshift () means that ground-based long-slit spectroscopy allows the study of the variation of its emission-line spectrum on kpc scales. 20cm VLA radio images in combination with emission line images [Baum et al. (1988)] show little sign of jet-cloud interaction, despite the overall complexity of the emission line structure, and there is little evidence for the extreme emission-line kinematics which would indicate the action of shocks, as observed, for example, in 3C 171 [Clark et al. (1998)]. Polarization studies also provide evidence of illumination by a central source, since scattered quasar features are detected in both polarized and direct light [Filippenko (1987), Draper et al. (1993), Young et al. (1996)]. Furthermore, the fact that 3C 321 is at the brighter end of the 60 m luminosity range of Narrow Line Radio Galaxies (NLRGs) [Hes et al. (1995), Heisler & Vader (1994)] also suggests that its central regions contain a powerful illuminating source. In addition to the quasar component, continuum modelling by [Tadhunter et al. (1996)] (TDS96) showed evidence for a significant starburst component.
2 Observations
2.1 Data acquisition and reduction
The observations were made in July 1996 using the ISIS spectrograph on the 4.2m William Herschel Telescope on La Palma. Two sets of 1500s exposures were taken simultaneously on the red and blue arms of ISIS giving a wavelength coverage of 3630–9820 Å. Not all of this range was useful, as the dichroic in ISIS attenuates the region above Å in the blue spectrum, and flux calibration errors dominate above Å. Gaussian fits to the night sky lines show that the mean spectral resolution of our data is Å in the blue spectra and Å in the red.
The seeing was measured to be 0.8 arcsec (FWHM), and the low airmass (1.008) ensured that the effects of differential atmospheric refraction were negligible — an important consideration given the large wavelength range covered by the data. The spatial scale of our spectra is kpc per pixel111Values of and km s-1Mpc-1 are assumed throughout. .
The slit was placed at a position angle of 130∘ on the sky, the direction of the axis defined by the two nuclei of the object. Figure 1 shows a diagram of the slit superimposed on an [OIII] HST image taken with WFPC2 using a linear ramp filter [Martel et al. (1999)]. A clear dust lane is visible in the SE blob, which is not resolved in our long slit images, although there is evidence for a significant increase in the E(B-V) reddening in this region (Region F in Figure 1 - see Table 4). Also marked are the 7 regions chosen for the detailed analysis described below.
The data were reduced using the Starlink figaro package and IRAF. Bias subtraction was carried out and cosmic rays removed. The spectra were then wavelength-calibrated, corrected for atmospheric extinction and flux calibrated, using the standard stars and arc exposures taken at the same time as the science images. The data were also corrected for both S-distortion and tilt, which may be caused by the slight misalignment of the slit with the grating and CCD, by using the spectra of standard stars taken at the same time as the observations. After correction, the residual offset in the spatial direction between the two ends of the spectra was estimated to be pixels. The two blue and two red spectra were co-added and the composite blue spectrum was then re-sampled to give the same spatial pixel scale as the red, and the region of the spectrum severely attenuated by the dichroic was removed. Finally, the two composite spectra were aligned and shifted back to the rest-frame using the mean redshift measured from the brighter emission lines.
The reduction process resulted in two spectra with useful rest wavelengths in the ranges – & – Å. We estimate a flux calibration error of across this range.
3 Results
Some analysis was made of the data prior to the continuum subtraction. In particular, kinematics of the [OIII] line were measured across the object on a pixel-by-pixel basis. The results of this line-fitting are presented in section 3.2.
Next, seven spatial bins were chosen for detailed analysis (see Figure 1). These were selected to have some morphological meaning and/or to give a high enough signal-to-noise in the density diagnostic [SII] lines to measure densities away from the low-density limit. The HST image was used to identify spatial bins which fall either side of the central dust-lane, and to sub-divide the emission line and continuum spatial peaks whilst maintaining a high signal-to-noise (see Figure 2). Note that Gaussian fits to the mean spatial profiles of the [OIII] and line-free continuum () show significant offsets between the continuum and emission line peaks in both nuclei, with the north-west emission line peak offset by ” ( kpc) to the north-west of the north-west continuum peak and the south-east emission line peak offset by ” ( kpc) to the SE of the SE continuum peak (Figure 2).
3.1 Continuum modelling
To enable the fainter emission lines to be measured more accurately, model continua were calculated and subtracted from the observed spectra. A nebular continuum was generated for each bin, comprising the blended higher (>H8) Balmer series together with a theoretical nebular recombination continuum (generated using dipso), both of which were normalized to the flux in H. This was then convolved with the H line width and subtracted from the data prior to the modelling (see [Dickson et al. (1995)]).
Initially, the continuum in regions A-G was modelled using 2 components chosen to represent AGN light (either direct or scattered) and the light of the host elliptical galaxy: a power law of the form (corresponding to a frequency power-law, ) and a 15 Gyr old elliptical galaxy template taken from [Bruzual & Charlot (1993)]. A more sophisticated model was then introduced, following TDS96, this time with an extra component corresponding to a contribution from a 0.1 Gyr starburst. The flux in 36 continuum bins, selected from both the red and blue spectra, was measured for the data and the model components, avoiding emission lines, atmospheric absorption bands and image defects. The models were then generated by choosing a normalizing continuum bin and scaling the different model components so that the total model flux in the normalizing bin was less than 125% of the observed flux. In this way, a series of models was created, filling the 3- and 4-d parameter space defined by the relative fractions of each of the components, and the value of . The best-fitting model was determined using a reduced -squared test, with the fitting being performed by IDL routines written for this purpose. The contributions of the different components were varied between 0 – 125% of the flux in the normalizing bin in increments of 2.5%, and the power law was varied over the range in 50 increments. The results of the modelling are shown in Tables 1 & 2. These were used to generate and then subtract the best-fit model continuum from the observational data. The best fitting models for the 3-component fits are plotted in Figure 3, together with the nebular-component-subtracted continua of the different spatial regions.
We exclude region A from the discussion which follows. As Tables 1 & 2 show, the value of is much higher for this region than for the other regions. This is due the fact that the continuum in region A is both weak and noisy, and the background subtraction more uncertain. We therefore refrain from drawing any conclusions regarding the contributions of individual continuum components in this region, although we do subtract the best-fit continuum from the spectrum for the purposes of studying the emission-line spectrum.
The 2-component fits are entirely adequate for the regions containing the two continuum peaks (C and F). For all other regions, however, the 2-component fits are poor, with the data exhibiting an excess of percent of the continuum flux relative to the best-fit model in the wavelength region – Å. A similar discrepancy was noted by TDS96 for the integrated light of the nuclear regions. Moreover, the 2-component models also give an over-prediction of the flux above Å. Note that the increased red-coverage in our spectra compared with those of TDS96 gives us a ‘longer lever’ in terms of constraining the fits to the data.
The 3-component models fit the data substantially better, giving much lower values of and also giving a more convincing overall spectral shape. As suggested by the 2-component models there is no strong evidence for a young stellar population in regions C & F, but the other four regions have of their continuum at Å contributed by a starburst component. Note that the negative slope of the continuum between Å and Å, as measured in regions B and E (see Figure 3), is exactly as predicted for a significant young stellar population but is not expected for an old (15 Gyr) stellar population.
These results are consistent with TDS96, whose 1-d data did not allow spatial resolution of the different regions presented here. Although they quote the contributions of the various components as a fraction of a bin centered at 3620 Å, it is possible to estimate the contribution this would give at the 5060 Å bin we used. The TDS96 data yield contributions of , and %, at Å, of the continuum remaining after subtraction of the nebular component for the 15 Gyr, 1 Gyr and power-law components respectively, using their value of . (Note that their young stellar population is older than the one used in this paper.) Taking a broad spatial aperture corresponding as closely as possible to the one used by TDS, containing regions D – G, the continuum fitting gives contributions of , , and % for the 15 Gyr, 0.1 Gyr and power-law, which is entirely consistent given that the young stellar components in the two sets of models used have different ages, and also that our data provide much better constraints in the red.
It is possible to calculate the total mass of stars present in each component from these results. The original [Bruzual & Charlot (1993)] models are all normalized to a total mass of , so it is easy to scale the fluxes so as to give the contribution to the normalizing bin indicated by the best fit results in Table 2. The masses thus derived are shown in Table 3. The young stellar population forms of the total stellar mass in all the spatial regions, and we believe this is the first published confirmation that the young stellar populations in radio galaxies are spatially extended. Note that for the older, 1 Gyr population used by TDS, we would expect the young stellar population to make a greater proportional contribution to the total mass.
Although we believe our models show strong evidence for a young stellar population that is spatially extended across the entire nebulosity, we emphasize that the models are not unique in terms of the age of the young stellar population. For example, TDS96 found that a 1 Gyr starburst provided a good fit to the data. More work is required to determine the age of the starburst accurately, although we stress that the emission line flux measurements are not significantly affected by the exact age of the starburst used in the continuum subtraction in the age range Gyr [Dickson (1997)].
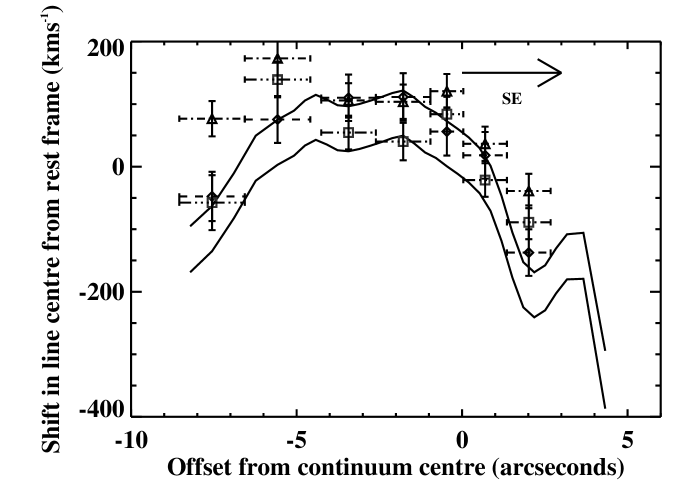
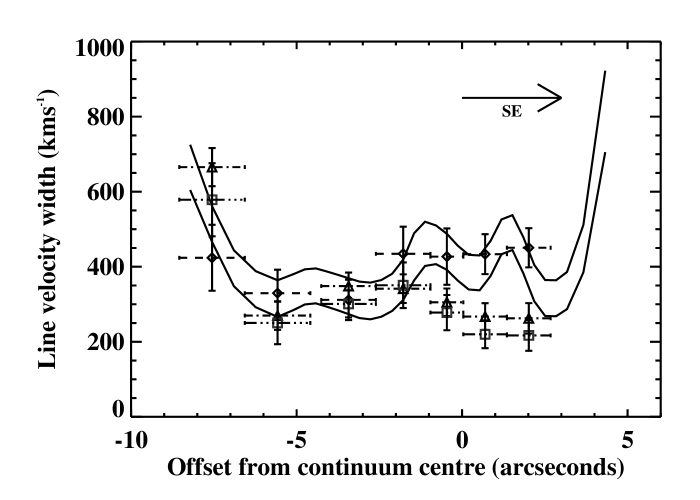
3.2 Emission line kinematics
Plots showing the emission-line kinematics are presented in Figure 4. The bright [OIII] line was measured in every spatial pixel, whereas the other lines were measured in the regions identified above. Both velocity shifts and velocity widths of the lines are plotted, with the widths quadratically corrected for instrumental broadening using the measured widths of night sky lines as close as possible in wavelength to the emission lines being studied. The ‘zero’ of velocity shift is defined as the wavelength of the line measured at the centre of the continuum emission of the brighter (SE) nucleus, as determined by fitting a Gaussian to its spatial profile.
The plots are encouraging in terms of using 3C 321 to test the photoionization models, since they suggest that, relative to other radio galaxies, 3C 321 is kinematically undisturbed. Not only are the lines relatively narrow (FWHM kms-1) across much of the nebula, but there are no significant differences in kinematics between lines of different ionization, as has been found in cases of jet-cloud interactions [Villar-Martin et al. (1999)]. It is only in the farthest spatial regions to the SE and NW that there is any sign of broadening in the emission lines. In particular, region A ( arcsec NW of the nucleus) shows evidence for significantly broader line profiles in all the measured lines (FWHM kms-1).
The spatial variation of radial velocities across the nebula is also small, with a spread of kms-1 in the range to arcsec. The variation which is observed may be due as much to the structure of the emission line nebula within the slit as to intrinsic velocity differences between different regions, since the seeing ( arcsec) was significantly less than the slit width.
Generally, the values presented here correspond to typical narrow-line widths in radio galaxies [Baum et al. (1990)], and are entirely compatible with purely gravitational motions [Tadhunter et al. (1989a)].
3.3 Reddening
The line fluxes were corrected for reddening using the [Seaton (1979)] re-normalization of the [Nandy et al. (1975)] extinction curve, with Case B recombination line values from [Gaskell & Ferland (1984)] for H/H and from [Osterbrock (1989)] for all other line ratios. The continuum-subtracted spectra allowed good fits to be made to H and H, as well as the other brighter members of the Balmer series, in all seven regions. The resulting E(B-V)values are shown in Table 4. These values suggest no intrinsic reddening in regions B & D, and a maximum in region F. The high values in regions E – G are consistent with the HST image (Figure 1), which shows a prominent dust lane across the SE edge of region F. These values of E(B-V) are also comparable with the extinction measured in the dust lane of Cygnus A of E(B-V) [Tadhunter et al. (1994)].
The estimated extinction values are smaller than the E(B-V) estimated by TDS96, but it should be noted that their measurement of H/H was made before any continuum subtraction, and that therefore no correction was made for underlying Balmer line absorption. Their measured value of H/H was therefore lower than ours, which accounts for the apparent discrepancy in E(B-V).
Despite their much larger value of E(B-V), TDS96 found that de-reddening the continuum had a negligible effect on the continuum fitting, in terms of the contributions of the different components. This suggests there is little to be gained in repeating the continuum fitting/subtraction for our spectra after correcting them for reddening. However, the emission line fluxes were themselves corrected for intrinsic reddening, using the values shown in Table 4.
3.4 Emission-line properties
After subtracting the best-fit model continuum from the observed spectrum in each region, the emission line fluxes in each spatial region were measured using the Starlink package dipso and corrected for the effects of intrinsic reddening. The corrected fluxes relative to H are shown in Table 5.
We can confirm the detection of a broad component to H reported by [Filippenko (1987)] in direct light. Whereas Filippenko only detected the broad H in the brighter nucleus (corresponding to apertures E & F), we also detect it in the fainter nucleus (aperture C), albeit at low signal-to-noise. The FWHM velocity-widths of this component, where measured, are shown in Table 4. These are consistent with the FWZI kms-1measured by [Filippenko (1987)]. The equivalent widths of the broad component, relative to the modelled power-law (i.e. quasar) component of the continuum in the regions C, E, F and G are also shown in Table 4. The fact that these are lower than the values found in typical quasars ( Å, [Espey et al. (1989)]) suggests that what we have modelled as the “power law” is not purely scattered quasar light, but may include a contribution from a non-quasar source, such as stellar populations with ages younger than those we have assumed in our fit.
Several features of these emission line data are worth highlighting:
-
•
Apart from region A which shows a significantly lower ionization state, there is a remarkable consistency of line ratios and ionization between every spatial aperture. This lack of variation was first noted by [Filippenko (1987)] who discussed the integrated spectra of the main NW and SE components and noted their general similarity.
- •
-
•
Despite the high ionization state, the temperature-sensitive [OIII] ratio is smaller than measured in the nuclear and extra-nuclear NLR of most other powerful radio galaxies [Tadhunter et al. (1989b), Binette et al. (1996)].
3.5 Physical conditions and ionization parameter
Assuming that the AGN is the dominant photoionizing source, and that the line-emitting clouds are optically thick to the photoionizing radiation, values for the ionization parameter, , (defined as the ratio of the number density of photoionizing photons to the number density of photoionized electrons) the electron density, , and the electron temperature, , may be derived from the [OII]/[OIII], [SII]/ and [OIII] line ratios, respectively.
The temperature and density were calculated using the Lick 5-level atom calculator, fivel, [De Robertis et al. (1987)] which, given a nominal density and value of the temperature diagnostic line ratio, can be used to give the temperature of the line-emitting region, and vice versa. The results of this process, using the de-reddened line ratios, are shown in Table 6.
[Penston et al. (1990)] give the following relationship between [OII], [OIII], and :
This relationship was calculated using a set of models in which optically thick clouds, with a constant gas density of 100 cm-3 and solar abundances, were photoionized by a central source. [OII]/[OIII] was chosen because it is known to be insensitive to the detailed continuum shape, while retaining sensitivity to over a wide range of values.
Values of were calculated for each region together with the density and projected distance — measured from the mean continuum centroid of the SE nucleus — and these results are shown in Table 6.
Again the results presented in Table 6 show a remarkable consistency in physical conditions and ionization between the various regions.
4 Testing the ionization models for 3C 321
The results presented so far emphasize the fact that it is reasonable to assume that the ionization of the emission line gas in 3C 321 is dominated by AGN photoionization, with no clear evidence for shock-ionization. The justifications for this are:
-
•
Kinematics. The kinematics of the line emission gas are consistent with purely gravitational motion, and imply that the gas is relatively undisturbed.
-
•
Physical conditions. Shock models which include a combination of cooling and precursor gas (e.g., [Dopita & Sutherland (1996)]), predict relatively high electron temperatures (T K), whereas the temperatures measured in several apertures across 3C 321 are much lower than this.
Although there is no evidence for shock ionization, shocks may nonetheless influence the physical conditions in 3C 321. Such influence may be indicated by the consistently high densities measured across the central regions of 3C 321 (see Table 6). Warm emission line clouds in pressure equilibrium with the hot X-ray haloes of isolated elliptical galaxies and groups of galaxies would have electron densities in the range cm-3 at a similar radius [Forman et al. (1985), Ponman et al. (1994)]222The X-ray luminosity of 3C 321 ( erg s-1) is in the range typical of isolated ellipticals or groups of galaxies [Fabbiano et al. (1984)]. . The larger densities measured in 3C 321 suggest a higher confining pressure, perhaps associated with the cocoon of the radio source. Indeed, the cocoons of radio sources are predicted to be substantially over-pressured with respect to the ambient ISM.
Alternatively, the warm photoionized clouds, initially over-pressured with respect to their surroundings due the large temperature increase caused by photoionization, may not yet have expanded to reach pressure equilibrium with the hot ISM.
4.1 Photoionization models
Initially, simple photoionization models comprising a power-law continuum, , photoionizing an optically thick, solar-abundance medium, were used to predict values of various emission line flux ratios, using the mappings photoionization code of [Binette et al. (1997)]. A selection of diagnostic diagrams is shown in Figure 5. Two power-law sequences are plotted, one with fixed at and , and the second with fixed at with . Note that an power-law continuum has been shown to give good fits to the stronger emission lines in low redshift radio galaxies [Ferland & Osterbrock (1986), Robinson et al. (1987)]. Also plotted for comparison are the emission line ratios for the nuclear NLR of various powerful radio galaxies from the literature. While these simple power-law photoionization models are in reasonable agreement with the line ratios measured in 3C 321 on some of the diagnostic diagrams, there are several problems. These include the following.
-
•
There is a general lack of consistency between the various diagnostic diagrams, in the sense that, even though the points may fall close to the power-law U sequence on some of the diagrams, the points move to different positions along the U sequence between the different diagrams.
-
•
[NII]/[OII] is under-predicted by the power-law models (Figure 5c). This problem has been noted before in the case of Cygnus A [Tadhunter et al. (1994)] where it was ascribed to an N/O abundance ratio which is enhanced relative to the solar value. On the basis of Figure 5c it seems safe to conclude that the N/O abundance ratio is also enhanced in 3C321 and several other powerful radio galaxies, given that the [NII]/[OII] ratio is relatively insensitive to the ionizing continuum shape, ionization parameter and cloud column density.
-
•
HeII/H is under-predicted by the power-law sequence (see Figures 5a, b & e). This is a particular problem, since the ratio is not sensitive to abundances, physical conditions or ionization parameter.
-
•
[OI]/[OIII] and [NeIII]/[NeV] are also not well-fitted by the power-law sequence (see Figures 5e, f & g), falling at or off the extreme high ionization end of the U sequence.
-
•
The locus of points formed by 3C321 and the other radio galaxies in HeII/H vs
[NeIII]/[NeV] diagram (Figure 5e) is almost orthogonal to the power-law U-sequence, with 3C321 at the extreme high ionization end of the sequence.
Next, in an attempt to get a better fit to the high ionization lines, photoionization models were constructed for optically thick clouds photoionized by a black body spectrum with a range of characteristic temperatures and ionization parameters. Again two different sets of models are shown in Figure 5. For one set, a black-body temperature of K was assumed, and the ionization parameter was varied over the range , while for the other set was fixed at and the temperature varied in the range . Although the K sequence gives better fits to the observed HeII/H and [OI]/[OIII] ratios, the [NeIII]/[NeV] ratio is still a problem and, as with the power law models, there is a general lack of consistency between diagrams in the position of the points along the sequence.
We conclude that the optically thick models cannot fit the ratios of all the emission lines in a consistent fashion between the different diagnostic diagrams, regardless of the shape of the ionizing continuum. In the light of this conclusion, we consider a third set of the models which include a mixture of optically thick and optically thin clouds. Developed by [Binette et al. (1996)] in order to explain the discrepant high ionization line ratios and high electron temperatures observed in many active galaxies, these models are shown in Figure 5 as sequences in , the ratio of the solid angle covered by the optically thin component relative to that covered by the optically thick component. Covering the range , they were generated using the tabulated values from [Binette et al. (1996)] for an illuminating power law with . As can be seen from Figure 5, the mixed medium models provide a remarkably good fit to the observed line ratios on most of the diagnostic diagrams, with a consistent position of the points along the sequence in all diagrams. Particularly notable is the fact that the sequences provide an excellent fit to the locus of radio galaxy points on the [NeIII]/[NeV] vs HeII/H plot (Figure 5e), which is problematic for the optically thick models. In terms of the diagnostic diagrams, the only significant problem with the mixed medium models is that they over-predict the temperature-sensitive [OIII] ratio. However, better agreement with this line ratio can be obtained with super-solar abundances (see Figs. 12 & 13 of [Binette et al. (1996)]).
A general problem for all photoionization models is the observed uniformity of the line ratios across the emission line nebula. In the case of the optically thick models, such uniformity would imply a small range in ionization parameter which in turn would require a dependence in the density, where is the distance from the illuminating source. However, such a density dependence seems unlikely, given that the density, where it can be measured, remains constant over a range of projected radii, and also given that one of the emission line regions (C) is associated with the secondary nucleus.
The uniformity may be even more of a problem for the mixed medium models, since it requires not only a small variation in between the different regions, but also consistent column depths for the optically thick and thin components and consistent properties for the photoionizing continuum. In the context of the mixed medium models, such uniformity may imply some as yet unrecognized physical mechanism which maintains a “natural” ratio over a range of radii.
4.2 Photoionizing photon luminosity, Q
Another way of testing the photoionization models is to calculate the value of , the flux of ionizing photons per unit solid angle and check for consistency with other measures of the AGN brightness. may be calculated from the various physical quantities estimated in Section 3.5 according to the formula , where is the (projected) distance of the line-emitting region from the source [Robinson et al. (1987)].
As in the previous section, we begin by considering results derived from photoionization models for optically thick clouds. Table 6 shows values of calculated for each region, under the assumption that the projected distance measured from our spectra correspond to the real AGN-cloud distances. The results reveal two problems associated with the values of calculated for these optically thick models:
-
1.
Absolute value. is much higher than in other low-redshift radio-loud objects – up to 2 orders of magnitude greater than the value measured for Cygnus A ( [Tadhunter et al. (1994)]), and times greater than the most powerful radio-loud quasar in the local universe, 3C 273 ( (based upon a linear interpolation across the EUV gap [Elvis et al. (1994)].) This is surprising in the context of the correlation between optical and radio properties found by [Rawlings & Saunders (1991)] since 3C 321 is not an unusually luminous radio source – is roughly times less than for Cygnus A [Spinrad et al. (1985)]. Note that the values of in Table 6 are lower limits, since the distances used in the calculation are projected rather than true distances. Region C gives the most reliable estimate of because it is the region with the least fractional uncertainty in distance from the putative illuminating source; it also gives the largest value of .
-
2.
Predicted far-infrared flux. Using the value of it is possible to predict the far-infrared luminosity, assuming that all the photoionizing photons incident on the dusty torus are reprocessed into the far infrared. If we assume a cone opening half-angle of , the solid angle subtended by the torus is . Assuming an isotropic illuminating continuum with the form of a K black body, as indicated by the photoionization models above, with a mean photon energy of eV, then the total bolometric luminosity expected in the far infrared from dust-reprocessing is . [Golombek et al. (1988)] measure the observed m and m fluxes of 3C 321 as and mJy respectively. Assuming that a power-law obtains between and m, the integrated rest-frame luminosity between these wavelengths is – a factor of less than that expected from the measured value of .
By contrast, if the mixed medium models are correct, [Binette et al. (1996)] estimate that the ‘true’ ionization parameter in the optically thick clouds, from which almost all of the [SII] density diagnostic emission originates, is . The last column of Table 6 shows for the different regions calculated using the value of appropriate for a mixed medium model. Repeating the above calculation for the expected re-processed far infrared with the values of calculated for a mixed medium gives , which is close to the value inferred from the observations of [Golombek et al. (1988)]. Although there is some uncertainty about the exact value of for the mixed medium model, the estimates of based on this model are clearly more realistic than those derived for the optically thick case, although region C, with the most reliable estimate of , still gives a value times greater than that estimated for Cygnus A [Tadhunter et al. (1994)]. This is perhaps not too surprising since it has been shown that there is a large degree of scatter in quasar power for a given extended radio power [Tadhunter et al. (1998)]. Also, it has been suggested that Cygnus A has enhanced radio emission in relation to its emission line luminosity, probably as a result of its occupying a dense cluster environment [Barthel & Arnaud (1996)]. By comparison, 3C 321 is an isolated galaxy.
The more realistic estimates of for the mixed medium models further strengthen the case of these models in comparison with the models which assume optically thick clouds.
4.3 The ‘Q effect’
Whether optically thick or mixed medium models are assumed for the calculation of , the resulting values show a prominent dip across the object, which coincides with the assumed position of the continuum source. As is the ionizing luminosity ‘seen’ by the clouds, it should be constant for all positions, since all clouds should ‘see’ the central source. This ‘Q effect’ has been reported before in the case of Seyfert galaxies [Metz (1997), Metz et al. (1997)]. These authors noted that the size of the region across which the dip in was most acute (corresponding with our region F) was on the same scale as the seeing disc. This led them to infer the presence of an unresolved dense core, or inner narrow line region (INLR), situated between the conventional broad and narrow line regions. The HST [OIII] image (Figure 1) provides some evidence that this may also be the case in 3C 321, with the brightest pixels bordering the dust-lane in the SE nucleus. However, the consistency of our emission line data across the object show no evidence for such a dense inner region, and the highest electron densities are found in the regions furthest from the centre.
A second, more plausible effect is suggested by our data – owing to the consistency of the emission lines across the nebula, most of the variation in is due to the increase in measured distance from the continuum centre (Table 6). These distances are clearly projected distances, and therefore represent lower limits to the true values. There may therefore be a projection effect at work, whereby the line-emitting clouds in regions E & F are in fact some distance away from the AGN along our line of sight. With respect to the unified schemes of radio galaxies and quasars [Barthel (1989), Lawrence (1991)], this would imply that we must be viewing the central regions of 3C 321 close to the edges of the photoionized cones (any further towards the centres of the cones would result in a direct view of the quasar nucleus). In this context, it interesting to note that infrared observations by [Tadhunter et al. (1999)] show that the emission cones in Cygnus A are hollowed out, with much of the line emission generated at the edges of the cones. This suggests that the the projection effects indicated by the dip in may plausibly occur without exposing the hidden quasar nucleus. The current best estimates of cone opening angles, derived from examination of the statistics of AGN [Lawrence (1991)], therefore imply inclinations of the radio axis with respect to the plane of the sky in the range if the edge of the cone in 3C 321 is close to the line of sight. In this case we would expect the core radio flux to be boosted with respect to that of the lobes, as is the case for broad line radio galaxies (BLRGs). [Morganti et al. (1997a)] derive median values of of and for broad- and narrow-line radio galaxies respectively, where . The fact that for 3C 321 [Nilsson (1998)] suggests that these projection effects may indeed be important, as this is clearly closer to the median BLRG value than that of NLRGs. This is also supported by the one-sided core-jet structure to the NW, visible in the maps of [Baum et al. (1988)].
In summary, it is likely that projection effects can account for the dip in at the SE nucleus and that the true value of is close to that measured in region C, the furthest spatial bin from the nucleus in which we can measure .
5 Conclusion
We have presented high quality, long-slit spectral data for 3C 321. The kinematics, emission-line ratios and physical properties show an unusually small variation across the spatial extent of the object, and provide good evidence that 3C 321 is mainly photoionized, with little or no contribution from shock ionization. 3C 321 is therefore an excellent source to use to test the photoionization models in depth.
We have carried out accurate continuum modelling and subtraction to allow the measurement of faint emission lines so as to better constrain the photoionization models, and allow calculation of physical conditions across the nebula. The continuum modelling requires the presence of a significant, spatially extended, young stellar population to give good fits to the data.
Comparison of emission-line flux ratios with the photoionization models shows that the mixed medium models – involving a combination of clouds which are optically thick and thin to the ionizing radiation – provide an excellent fit to the observed line ratios, especially if super-solar abundances are assumed. Conventional models, which assume a single population of optically thick clouds, do not provide a good fit to the observed line ratios, and require differing values for parameters such as to reproduce the line ratios in different diagnostic diagrams.
Our results also show that caution is required when using the emission line properties to calculate the ionizing luminosity of the illuminating AGN (). Under the assumption that the line emitting clouds are optically thick, we find that the estimated value of is unrealistically large, given the radio and far-infrared properties of the source. However, the lower value of ionization parameter appropriate for the mixed medium model leads to an estimate of which is more consistent with the estimated far-infrared luminosity of 3C 321.
The unusual degree of consistency of the emission line ratios across the nebula
presents difficulties for any ionization model due to the need for consistent
physical conditions and ionization over large range of distances from the illuminating
nucleus. This is a particular problem for the mixed medium model which provides
the best fit to the line ratios, since the uniformity requires the ratio of
covering factors of the optically thick and thin components to remain remarkably
constant across the nebula.
Acknowledgements. The authors acknowledge the data analysis facilities provided by the Starlink Project which is run by CCLRC on behalf of PPARC. In addition, the following Starlink software packages have been used: FIGARO, KAPPA, & DIPSO. Luc Binette provided useful discussions regarding the details of the mixed medium models. AR would like to thank the Royal Society for financial support, and TGR acknowledges a PPARC studentship.
The WHT is operated on the island of La Palma by the Isaac Newton Group in the Spanish Observatorio del Roque de los Muchachos of the Instituto de Astrofisica de Canarias. Figure 1 is based on observations made with the NASA/ESA Hubble Space Telescope, obtained from the data archive at the Space Telescope Science Institute. STScI is operated by the Association of Universities for Research in Astronomy, Inc. under NASA contract NAS 5-26555.
References
- Barthel (1989) Barthel P. D., 1989, ApJ, 336, 606
- Barthel & Arnaud (1996) Barthel P. D., Arnaud K. A., 1996, MNRAS, 283, L45
- Baum et al. (1988) Baum S. A., Heckman T., Bridle A., van Breugel W., Miley G., 1988, ApJS, 68, 643
- Baum et al. (1990) Baum S. A., Heckman T., Van Breugel W., 1990, ApJS, 74, 389
- Binette et al. (1988) Binette L., Robinson A., Courvoisier T. J. L., 1988, A&A, 194, 65
- Binette et al. (1997) Binette L., Wilson A. S., Raga A., Storchi-Bergmann T., 1997, A&A, 327, 909
- Binette et al. (1996) Binette L., Wilson A. S., Storchi-Bergmann T., 1996, A&A, 312, 365
- Bruzual & Charlot (1993) Bruzual A. G., Charlot S., 1993, ApJ, 405, 538
- Capetti et al. (1999) Capetti A., Axon D. J., Macchetto F. D., Marconi A., Winge C., 1999, ApJ, 516, 187, astro-ph/9811381
- Clark et al. (1998) Clark N. E., Axon D. J., Tadhunter C. N., Robinson A., O’Brien P., 1998, ApJ, 494, 546
- Cohen & Osterbrock (1981) Cohen R. D., Osterbrock D. E., 1981, ApJ, 243, 81
- Costero & Osterbrock (1977) Costero R., Osterbrock D. E., 1977, ApJ, 211, 675
- De Robertis et al. (1987) De Robertis M. M., Dufour R. J., Hunt R. W., 1987, Journal of the Royal Astronomical Society of Canada, 81, 195
- Dickson et al. (1995) Dickson R., Tadhunter C., Shaw M., Clark N., Morganti R., 1995, MNRAS, 273, L29
- Dickson (1997) Dickson R. C., 1997, PhD Thesis, Univ. Sheffield
- Dopita & Sutherland (1996) Dopita M. A., Sutherland R. S., 1996, ApJS, 102, 161
- Draper et al. (1993) Draper P. W., Scarrott S. M., Tadhunter C. N., 1993, MNRAS, 262, 1029
- Elvis et al. (1994) Elvis M., Wilkes B. J., MCDowell J. C., Green R. F., Bechtold J., Willner S. P., Oey M. S., Polomski E., Cutri R., 1994, ApJS, 95, 1
- Espey et al. (1989) Espey B. R., Carswell R. F., Bailey J. A., Smith M. G., Ward M. J., 1989, ApJ, 342, 666
- Fabbiano et al. (1984) Fabbiano G., Trinchieri G., Elvis M., Miller L., Longair M., 1984, ApJ, 277, 115
- Ferland & Osterbrock (1986) Ferland G. J., Osterbrock D. E., 1986, ApJ, 300, 658
- Filippenko (1987) Filippenko A. V., 1987, IAU Symposia, 124, 751
- Forman et al. (1985) Forman W., Jones C., Tucker W., 1985, ApJ, 293, 102
- Gaskell & Ferland (1984) Gaskell C. M., Ferland G. J., 1984, PASP, 96, 393
- Golombek et al. (1988) Golombek D., Miley G. K., Neugebauer G., 1988, AJ, 95, 26
- Grandi & Osterbrock (1978) Grandi S. A., Osterbrock D. E., 1978, ApJ, 220, 783
- Heisler & Vader (1994) Heisler C. A., Vader J. P., 1994, AJ, 107, 35
- Hes et al. (1995) Hes R., Barthel P. D., Hoekstra H., 1995, A&A, 303, 8
- Koski (1978) Koski A. T., 1978, ApJ, 223, 56
- Lawrence (1991) Lawrence A., 1991, MNRAS, 252, 586
- Martel et al. (1999) Martel A. R., Baum S. A., Sparks W. B., Wyckoff E., Biretta J. A., Golombek D., Macchetto F. D., de Koff S., McCarthy P. J., Miley G. K., 1999, ApJS, 122, 81
- Metz (1997) Metz S. K., 1997, Ph.D. thesis, Univ. Sheffield
- Metz et al. (1997) Metz S. K., Axon D. J., Robinson A., Tadhunter C. N., 1997, in American Astronomical Society Meeting. Vol. 190, p. 3901
- Morganti et al. (1997a) Morganti R., Oosterloo T. A., Reynolds J. E., Tadhunter C. N., Migenes V., 1997a, MNRAS, 284, 541
- Morganti et al. (1991) Morganti R., Robinson A., Fosbury R. A. E., Di Serego Alighieri S., Tadhunter C. N., Malin D. F., 1991, MNRAS, 249, 91
- Morganti et al. (1997b) Morganti R., Tadhunter C. N., Dickson R., Shaw M., 1997b, A&A, 326, 130
- Nandy et al. (1975) Nandy K., Thompson G. I., Jamar C., Monfils A., Wilson R., 1975, A&A, 44, 195
- Nilsson (1998) Nilsson K., 1998, A&AS, 132, 31
- Osterbrock (1989) Osterbrock D. E., 1989, Astrophysics of Gaseous Nebulae and Active Galactic Nuclei. Mill Valley, University Science Books
- Penston et al. (1990) Penston M. V., Robinson A., Alloin D., Appenzeller I., Aretxaga I., Axon D. J., Baribaud T., Barthel P., Baum S. A., Boisson C., De Bruyn A. G., Clavel J., Colina L., Dennefeld M., Diaz A., Dietrich M., Durret F., Dyson J. E., Gondhalekar P., Van Groningen E., Jablonka P., Jackson N., Kollatschny W., Laurikainen E., Lawrence A., Masegosa J., McHardy I., Meurs E. J. A., Miley G., Moles M., O’Brien P., O’Dea C., Del Olmo A., Pedlar A., Perea J., Perez E., Perez-Fournon I., Perry J., Pilbratt G., Rees M., Robson I., Rodriguez-Pascual P., Rodriguez Espinosa J. M., Santos-Lleo M., Schilizzi R., Stasinska G., Stirpe G. M., Tadhunter C., Terlevich E., Terlevich R., Unger S., Vila-Vilaro V., Vilchez J., Wagner S. J., Ward M. J., Yates G. J., 1990, A&A, 236, 53
- Ponman et al. (1994) Ponman T. J., Allan D. J., Jones L. R., Merrifield M., McHardy I. M., Lehto H. J., Luppino G. A., 1994, Nature, 369, 462+
- Press et al. (1992) Press W. H., Teukolsky S. A., T. V. W., Flannery B. P., 1992, Numerical Recipes in FORTRAN: the Art of Scientific Computing — 2nd edition. Cambridge University Press
- Rawlings & Saunders (1991) Rawlings S., Saunders R., 1991, Nature, 349, 138
- Robinson et al. (1987) Robinson A., Binette L., Fosbury R. A. E., Tadhunter C. N., 1987, MNRAS, 227, 97
- Robinson et al. (1994) Robinson A., Vila-Vilaro B., Axon D. J., Perez E., Wagner S. J., Baum S. A., Boisson C., Durret F., Gonzalez-Delgado R., Moles M., Masegosa J., O’Brien P. T., O’Dea C., Del Olmo A., Pedlar A., Penston M. V., Perea J., Perez-Fournon I., Rodriguez-Espinosa J. M., Tadhunter C., Terlevich R. J., Unger S. W., Ward M. J., 1994, A&A, 291, 351
- Seaton (1979) Seaton M. J., 1979, MNRAS, 187, 73P
- Spinrad et al. (1985) Spinrad H., Marr J., Aguilar L., Djorgovski S., 1985, PASP, 97, 932
- Tadhunter (1983) Tadhunter C. N., 1983, PhD Thesis, Univ. Sussex
- Tadhunter et al. (1996) Tadhunter C. N., Dickson R. C., Shaw M. A., 1996, MNRAS, 281, 591. (TDS96)
- Tadhunter et al. (1989a) Tadhunter C. N., Fosbury R. A. E., Quinn P. J., 1989a, MNRAS, 240, 225
- Tadhunter et al. (1994) Tadhunter C. N., Metz S., Robinson A., 1994, MNRAS, 268, 989
- Tadhunter et al. (1998) Tadhunter C. N., Morganti R., Robinson A., Dickson R., Villar-Martin M., Fosbury R. A. E., 1998, MNRAS, 298, 1035, astro-ph/9807238
- Tadhunter et al. (1999) Tadhunter C. N., Packham C., Axon D. J., Jackson N. J., Hough J. H., Robinson A., Young S., Sparks W., 1999, ApJL, 512, L91
- Tadhunter et al. (1989b) Tadhunter C. N., Robinson A., Morganti R., 1989b, in Meurs J., Fosbury R., eds, ESO Workshop, Extranuclear Activity in Galaxies. European Southern Observatory, Garching, p. 293
- Viegas & Prieto (1992) Viegas S. M., Prieto M. A., 1992, MNRAS, 258, 483
- Villar-Martin et al. (1999) Villar-Martin M., Tadhunter C., Morganti R., Axon D., Koekemoer A., 1999, MNRAS, 307, 24, astro-ph/9901201
- Young et al. (1996) Young S., Hough J. H., Efstathiou A., Wills B. J., Axon D. J., Bailey J. A., Ward M. J., 1996, MNRAS, 279, L72
| Region | 15 Gyr flux† | Power law flux† | Goodness-of-fit‡ | ||
|---|---|---|---|---|---|
| A | |||||
| B | |||||
| C | |||||
| D | |||||
| E | |||||
| F | |||||
| G |
†As a percentage of the measured continuum after subtraction of the nebular component in the rest wavelength region Å.
‡Defined as the formal statistical probability that this value of has not been arrived at by chance.
| Region | 15 Gyr flux† | 0.1 Gyr flux† | Power law flux† | Goodness-of-fit | ||
|---|---|---|---|---|---|---|
| A | ||||||
| B | ||||||
| C | ||||||
| D | n/a | |||||
| E | ||||||
| F | ||||||
| G |
†As a percentage of the measured continuum in the rest wavelength bin Å.
| Region | Mass in 15 Gyr component | Mass in 0.1 Gyr component | Percentage of young |
|---|---|---|---|
| stars by mass | |||
| A | — | — | |
| B | |||
| C | |||
| D | |||
| E | |||
| F | |||
| G | |||
| Total |
| Probable | Measured values relative to H | ||||||
|---|---|---|---|---|---|---|---|
| ID | A | B | C | D | E | F | G |
| [NeV] | — | ||||||
| [NeV] | |||||||
| [OII] | |||||||
| [NeIII] | |||||||
| [NeIII] | |||||||
| [SII] | — | — | |||||
| H | |||||||
| H | |||||||
| [OIII] | — | ||||||
| HeII | — | ||||||
| ([ArIV]) | — | — | — | ||||
| H | |||||||
| [OIII] | |||||||
| [OIII] | |||||||
| [NI] | — | — | — | ||||
| [FeVII] | — | — | — | — | — | ||
| [OI] | — | — | |||||
| [OI] | — | — | — | ||||
| [FeX] | — | — | — | — | |||
| [NII] | |||||||
| HN | |||||||
| HB | — | — | — | ||||
| [NII] | |||||||
| HeI | — | — | |||||
| [SII] | |||||||
| [SII] | |||||||
| [ArIII] | — | ||||||
| H flux ( | |||||||
| ergs-1cm-2Å-1) | |||||||
| H equivalent | |||||||
| width (Å) | |||||||
| Broad H | — | — | — | ||||
| FWHM (kms-1). | |||||||
| Broad H | |||||||
| equiv. width | — | — | — | ||||
| (Å). | |||||||
| E(B-V) c | |||||||
aValues for blends.
bIncludes contribution from H
cWeighted means deduced from H/H, H/H and H/H and assuming Case B.
| Probable | Reddening corrected values relative to H | ||||||
|---|---|---|---|---|---|---|---|
| ID | A | B | C | D | E | F | G |
| [NeV] | — | ||||||
| [NeV] | |||||||
| [OII] | |||||||
| [NeIII] | |||||||
| [NeIII] | |||||||
| [SII] | — | — | |||||
| H | |||||||
| H | |||||||
| [OIII] | — | ||||||
| HeII | — | ||||||
| ([ArIV]) | — | — | — | ||||
| H | |||||||
| [OIII] | |||||||
| [OIII] | |||||||
| [NI] | — | — | — | ||||
| [FeVII] | — | — | — | — | — | ||
| [OI] | — | — | |||||
| [OI] | — | — | — | ||||
| [FeX] | — | — | — | — | |||
| [NII] | |||||||
| HN | |||||||
| HB | — | — | — | ||||
| [NII] | |||||||
| HeI | — | — | |||||
| [SII] | |||||||
| [SII] | |||||||
| [ArIII] | — | ||||||
aValues for blends.
bIncludes contribution from H
| () | ||||||
|---|---|---|---|---|---|---|
| (K) | (m) | () | () | (phot ) | ||
| A | — | — | — | |||
| B | — | — | ||||
| C | ||||||
| D | ||||||
| E | ||||||
| F | ||||||
| G |
†Assumes H,


a)

b)

c)

d)

e)

f)

g)

h)

i)
