The Chandra X-ray Observatory Resolves the X-ray Morphology and Spectra of a Jet in PKS 0637-752
Abstract
The core-dominated radio-loud quasar PKS 0637-752 () was the first celestial object observed with the Chandra X-ray Observatory, offering the early surprise of the detection of a remarkable X-ray jet. Several observations with a variety of detector configurations contribute to a total exposure time with the Chandra Advanced CCD Imaging Spectrometer (ACIS; Garmire et al. 2000, in preparation) of about 100 ks. A spatial analysis of all the available X-ray data, making use of Chandra’s spatial resolving power of about 0.4 arcsec, reveals a jet that extends about 10 arcsec to the west of the nucleus. At least four X-ray knots are resolved along the jet, which contains about 5% of the overall X-ray luminosity of the source. Previous observations of PKS 0637-752 in the radio band (Tingay et al. 1998) had identified a kpc-scale radio jet extending to the West of the quasar. The X-ray and radio jets are similar in shape, intensity distribution, and angular structure out to about 9 arcsec, after which the X-ray brightness decreases more rapidly and the radio jet turns abruptly to the north. The X-ray luminosity of the total source is , 111We use = 50 km s-1 Mpc-1 and = 0 throughout and appears not to have changed since it was observed with ASCA in November 1996. We present the results of fitting a variety of emission models to the observed spectral distribution, comment on the non-existence of emission lines recently reported in the ASCA observations of PKS 0637-752, and briefly discuss plausible X-ray emission mechanisms.
1. INTRODUCTION
Until recently most of our knowledge regarding the spatial structure and spectral shape of extragalactic jets has relied on observations performed in the radio and optical bands. X-ray detections and upper limits have provided insights into the physical conditions responsible for the observed radiation from knots and hotspots in extragalactic radio jets. However, in most cases the poor spectral and spatial resolution available has made the interpretation of the X-ray data difficult. The spectral energy distributions (SED) seen from jets have been ascribed to combinations of synchrotron radiation, synchrotron self-Compton (SSC) radiation, and thermal bremsstrahlung from shock-heated gas near the jets. In particular, the synchrotron and SSC models have been successfully employed to explain the X-ray emission from hotspots and jets in M87 (Biretta, Stern, Harris 1991), Cygnus A (Harris, Carilli, & Perley 1994) and 3C 295 (Harris et al., 2000). In the cases of 3C 273 (Harris & Stern 1987) and Pictor A (Meisenheimer et al. 1989), none of the standard processes yield satisfactory results.
The Chandra X-ray Observatory (CXO), launched on 1999 July 23, provides a significant improvement over previous missions in combined spatial and spectral resolution (see Weisskopf and O’Dell 1997, van Speybroeck et al. 1997) which we expect will result in a significant increase in the number of detected and resolved X-ray jets. PKS 0637-752 is the first X-ray jet to have been discovered by Chandra. The quasar was originally detected in X-rays with the Einstein Observatory (Elvis & Fabbiano 1984). Since then a peculiar emission-line feature at keV was claimed in an ASCA SIS observation of the source (Yaqoob et al. 1998). One of two Ginga observations of PKS 0637-752 has been reported as showing a marginal detection of an Fe line with an equivalent width of ( errors; Lawson & Turner 1997).
In 2 we describe the spectral and spatial analysis of the core and jet, and our observations of the radio jet. The properties of sources in the vicinity of PKS 0637-752 are also briefly presented. Section 3 contains a brief description of our attempt to apply standard jet models to the observed SED of PKS 0637-752. We provide a thorough investigation of the underlying emission processes in a companion paper (Schwartz et al. 2000, in preparation) where more complex models are considered.
2. DATA REDUCTION AND ANALYSIS
Twenty-five observations of PKS 0637-752 were made between 1999 August 14 and August 24 with the Chandra ACIS-S during the orbital activation and checkout phase of the mission. Table 1 summarizes several ACIS configuration parameters, 50 encircled energy radii, exposure times and estimated net count rates over the entire ACIS band corresponding to each individual observation.
The primary purpose of these observations was to focus the ACIS-S detector (in ) and to determine the position of the Chandra mirror optical axis by pointing to PKS 0637-752 at different offsets. (Definitions for Srcy, Srcz and SIMx are presented in the notes of Table 1.)
The spectral and spatial analysis of the data is complicated by the numerous configurations used during the observation of PKS 0637-752. The point spread function (PSF) corresponding to each observation differs significantly because of the nature of the calibration being performed. In particular, the 50 encircled energy radii varied between 0.4′′ at best focus and about 1′′ at 3′ off-axis pointing or poor focus (see Figure 1 and Table 1). The jet ( 2.1) was spatially resolved from the core and made little impact on the determination of the best focus and best optical axis location.
A second important property of the data that we have accounted for in our analysis is pile-up (see 6.17 of the Chandra Observatory Guide). Whenever the separation of two or more X-ray photons incident on a CCD is less than a few CCD pixels, and their arrival time lies within the same CCD frame readout, the CCD electronics may regard them as a single event with an amplitude given by the sum of the electron charge in the 3x3 neighborhood of the pixel with the maximum detected charge. A detected CCD event is characterized by the total charge within the 3x3 island and the distribution of the charge (often referred to as the grade of the event) within that island. Pile-up may alter the grades and charges of events, thus affecting both their spatial and spectral distribution. A manifestation of pile-up in observed spectra may be a reduction of detected events, spectral hardening of the continuum component and the apparent distortion of the PSF of point-like objects.
The presence of pile-up is apparent in the observed spectra of the core of PKS 0637-752. In particular, we observed a significant change in count rate of the core component of PKS 0637-752 as a function of focus position () along the optical axis. As shown in figure 1, the apparent count rate is lowest at the best focus position and increases as the scientific instrument module (SIM) is moved away from this location. A parabolic function was used to fit the count rates and encircled energy radii as a function of focus position. We estimate a focus location of -0.7 mm corresponding to the minimum of both count rate and encircled energy radii.
Count rates for a similar test performed with a shorter CCD frame readout time showed a similar behavior, but with detected count rates systematically larger than those for the standard 3.24 s full-frame readout time. The observed count-rate variation is due to the pile-up effect and not intrinsic to the quasar. As the telescope approaches best focus most photons fall onto a single CCD pixel, and the enhanced pile-up leads to a decrease in detected count rate.
Correcting a CCD observation of an X-ray source for pile-up is quite complicated. The dependence of pile-up on several effects such as the incident X-ray flux, the spectral and spatial distribution of the events, the grade selection scheme used, and the detection cell size adopted make the problem of restoring to the unpiled up spectrum non-trivial.
Fortunately the jet of PKS 0637-752 is not affected by pile-up since the jet is a relatively low count rate extended source.
2.1. X-ray Morphology
To obtain a high signal-to-noise image of PKS 0637-752, we made use of all observations with observed half power radius (HPR) less than 1.2′′. For each observation, a PSF appropriate for the focus and aim-point position was created employing the simulation tool MARX v2.2 (Wise et al. 1997). The input spectrum assumed in the PSF simulations was that derived from the best-fit Chandra spectrum of the outer-jet of PKS 0637-752 (see section 2.3). Specifically, we used an absorbed power law with a column density of NH = 11.8 1020 cm-2 and a photon index of 1.83. We examined the sensitivity of the resulting deconvolved image to the spectral slope used in the PSF simulations and found no particular spectral dependence for photon indices ranging between 1.7 and 2.3.
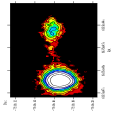
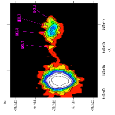
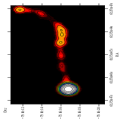
The simulated PSF’s were binned to a sub-pixel scale of 0.125′′. To avoid aliasing effects, the Chandra X-ray Center (CXC) processing incorporates a randomization of each position by 0.246 arcsec (1 ACIS pixel = 0.492′′). Residual errors in the aspect solution are expected to add a “blurring” to detected photon positions of 0.3′′ RMS in diameter. To simulate aspect errors and position randomization we convolved each generated PSF with a Gaussian with = 0.25′′. The X-ray photon event positions for each observation were also binned to 0.125′′, and the resulting X-ray image is shown in Fig. 2(Top panel). A maximum-likelihood deconvolution technique, using the appropriate simulated PSF, was applied to each individual observation. The resulting deconvolved images were aligned on the core centroid and combined to produce the total deconvolved image of PKS 0637-752 shown in Fig. 2(Middle panel). The effective resolution of the deconvolved X-ray image was estimated by deconvolving the simulated PSF’s of each observation, stacking the simulated PSF’s and determining the FWHM of the deconvolved stacked PSF. Our analysis yields an effective resolution for the stacked deconvolved image of 0.37′′. The PSF’s simulated for this analysis are not appropriate for the piled-up region of the core. This is why any deconvolved structure within 2′′ from the core should not be considered real. The jet region beyond 2′′ does not suffer from pile-up effects and the simulated PSF’s are appropriate for deconvolving the jet region. Several interesting structures have become more apparent in Fig. 2(Middle panel). A well collimated X-ray jet is seen to originate in the core and to extend approximately 10′′ to the west, and within the jet at least four knots are clearly resolved.
2.2. Radio Morphology
The radio jet was imaged at 4.8 and 8.6 GHz on 1999 August 19 and on 1999 September 21 using the Australia Telescope Compact Array which has a similar arcsecond resolution at 8.6 GHz as Chandra, and so provides a powerful structural comparison. The resulting 8.6 GHz radio image (Schwartz et al. 2000, in preparation; Lovell et al. 2000) is shown in Figure 2(Lower panel), where the coincidence with the X-ray knots is apparent. The three furthest X-ray knots, WK7.8, WK8.9 and WK9.7, appear to be embedded in extended and diffuse X-ray emission. The X-ray jet appears to bend SW after its encounter with the first X-ray knot, WK5.7, and then bend NW after the encounter with the fourth X-ray knot WK9.7. The radio image of the PKS 0637-752 jet (Figure 2, lower panel) indicates that the radio jet also bends in the NW direction after its encounter with WK9.7. The X-ray emission after knot WK9.7 drops substantially to become undetectable after several arcsec. A comparison between the X-ray and radio intensity profile along the jet (figure 3) shows close alignment of the X-ray and radio jets out to 10 arcseconds and relatively well matched X-ray and radio knots at 5.7, 7.8, 8.9 and 9.7 ′′ from the core. The radio profile in figure 3 was produced from the 8.6 GHz image (Schwartz et al. 2000, in preparation; Lovell et al. 2000). The position angles of the radio and X-ray jets appear to be similar, as shown in figure 4 where we have used the deconvolved X-ray image and the same 8.6 GHz radio map as before to plot the position angle of the ridges of peak radio and X-ray brightness along the jet with respect to the core of PKS 0637-752.
2.3. Spectral Analysis of Core Component
To determine the continuum spectral shape of the core component of PKS 0637-752, we considered only the two least piled-up on-axis observations corresponding to obsid’s 472 and 476. The expected percent loss of counts due to pile-up, based on our simulations, is 12. X-ray events were extracted within a circle centered on the core of PKS 0637-752 with a radius of 5′′, and events with standard ASCA grades 0,2,3,4,6 only were selected. The background was determined by extracting events within annuli centered on the core with inner and outer radii of 15′′ and 20′′ respectively. Spectra were binned to have a minimum of 20 counts per bin such that statistics can be used without low count corrections.
Spectral fits were performed using the standard software tool XSPEC (Arnaud 1996), and we compared these results to those provided by the simulator-based spectral fitting tool LYNX (Chartas et al. 2000, in preparation). A brief description of the LYNX fitting tool is provided in appendix A. The telescope pointings are intentionally dithered for the observations of PKS 0637-752 in a Lissajous pattern with an amplitude of about 16 arcsec such that small-scale non-uniformities in the CCD quantum efficiency are averaged out. The selected aim-point of the telescope for most of the PKS 0637-752 observations was set within 10′′ from the boundary between amplifier nodes 0 and 1 of the S3 CCD of ACIS, resulting in the source being dithered across the two nodes. To account for the difference in amplifier gains between nodes 0 and 1, events detected from the core component of PKS 0637-752 were separated into two spectra containing events detected from a single node, either 0 or 1. For fitting the spectra with XSPEC we used the appropriate response and ancillary files provided by the CXC. All errors on best-fit spectral parameters quoted in this paper are at the 90 confidence level unless mentioned otherwise.
Specifically we used the Chandra Interactive Analysis of Observations (CIAO) v1.1 tools mkrmf and mkarf to generate response and ancillary files. The focal plane temperature was C for these observations. The exposure times of each observation are listed in Table 1. A simple power-law plus cold, neutral absorber model was used to fit the core spectrum of PKS 0637-752. The best-fit parameters of the spectral fits are shown in Table 2.
Fit 2 of Table 2 was performed in the energy range 0.2-6.0 keV. The reduced of 1.1 for 235 degrees of freedom is acceptable in a statistical sense. However, the best-fit value of 3.5 0.5 1020 cm-2 for the column density is significantly below the previously observed ASCA value of 9 3 1020 cm-2 and the Galactic column density of 9.1 1020 cm-2 (Dickey & Lockman 1990). In fit 3 of Table 2 we fixed the neutral column density to the Galactic value and obtained a reduced of 1.7 for 236 degrees of freedom.
We searched for systematic errors in the spectral fits of the core by repeating fit 3 of Table 2 allowing for the lower-bound of the fitted energy range to vary between 0.2 and 1.5keV. We find that the best-fit XSPEC value for the spectral slope varies between 2.00 0.04 and 1.8 0.05 for the lower-bounds of the fit ranging between 0.2 and 0.8keV respectively, and remains constant at about 1.8 for the lower-bounds of the fit ranging between 0.8 and 1.5keV. Plausible explanations for the variation of the spectral slope with the lower-bound of the fit include pile-up effects of the spectrum of the core and/or uncertainties in the available response and ancillary files at energies below 0.5keV. We therefore restricted the XSPEC fits of the core component to energies above 1keV with the neutral column density parameter held fixed at the Galactic value of NH = 9 1020 cm-2. The fit within the keV range yields a photon index of 1.76 0.1 (fit 4 in Table 2).
Best-fit parameters to the core component were also obtained utilizing the simulator based tool, LYNX, (fit 1 in Table 2) and restricting the energy range of the fit between 0.2 and 6.0 keV. This fit yields a column density of 11 2 1020 cm-2 that is consistent with the Galactic value, and a photon index of 1.77 0.1 that is consistent with Ginga and ASCA results (Williams et al. 1992; Lawson & Turner 1997 and Yaqoob et al. 1998). All X-ray photon indices, , and energy indices, , follow the convention of flux density , where flux density is in units of erg cm-2 s-1 Hz-1and = + 1.
The difference between the LYNX and XSPEC fit results for the spectrum of the core of PKS 0637-752 can be partially attributed to the presence of pile-up in the spectrum of the core which is not modeled in the XSPEC fits.
In figure 5 we present the spectrum of the core component of PKS 0637-752 corresponding to obsid 476, together with the best-fit model (fit 1 from Table 2) and the ratio of observed spectrum to model. The estimated 2-10 keV flux of 2.2 10-12 erg s-1 cm-2 (from fit 1 of Table 2) indicates that the core flux has not varied, within the quoted error bars, since the 1996 November ASCA observations, especially when one considers that the ASCA observed flux corresponds to all emission within a 3′ radius of the core. X-ray fluxes quoted in this paper are not corrected for Galactic absorption.
We chose to improve the signal to noise for the detection of faint emission lines in the spectrum of PKS 0637-752 by stacking all the available spectra. In the summed spectrum, we expect that pileup will distort the continuum shape and cause emission lines to appear with overtone “ghosts” at higher energies. We initially produced a model that best fit the continuum component of the stacked spectrum. The region in the vicinity of the mirror Ir-edges (see Table 3) was excluded from the fit. In figure 6 we plot the stacked spectrum of the core component of PKS 0637-752 with the best-fit continuum component. We also show the ratio of the observed to best-fit continuum model. The best-fit model yields a reduced of 0.99 for 147 degrees of freedom (dof). This ratio suggests that no significant emission-line features are present. In particular, we do not detect an emission line in the vicinity of 1 keV and at an equivalent width (EW) 60 eV as suggested by a recent ASCA observation of PKS 0637-752 (Yaqoob et al. 1998). An upper limit of 15 eV on EW, at the 90 confidence level, can be placed on any line with energies 0.8 - 1.2 keV (observed frame) and width of 0-0.2 keV.
There are several spectral features in observed ACIS spectra that do not originate from astrophysical sources but are produced from various sites within the Chandra/ACIS instrument. In Table 3 we list all known instrumental spectral features and their origin. The significant instrumental features are the Al-L, C-K, N-K, O-K, and Al-K UV/Optical blocking filter absorption edges, the N-K, O-K, and Si-K CCD absorption edges, and the Ir-M HRMA absorption edges. In the spectra of the core of PKS 0637-752 (see Figures 5 and 6) the main instrumental spectral features that can be seen are the Ir-M HRMA absorption edge at 2.085 keV and the O-K ACIS absorption edge at 0.536 keV.
2.4. Spectral Analysis of Inner-Jet Component
For the purposes of this spectral analysis we have extracted the spectrum of the jet in a region 4′′ to 6.5′′ away from the core, and define this as the inner-jet region. Pile-up effects are negligible for the inner-jet component due to the extended nature of the emission combined with the relatively low count rate of 4 10-3 counts s-1. The X-ray image of PKS 0637-752 shown in figure 2 indicates a degree of curvature in the jet that appears to follow the spatial morphology observed in the radio (Schwartz et al. 2000, in preparation; Lovell et al. 2000). The X-ray spectrum of the inner-jet component was produced by extracting events from all the observations listed in Table 1. The spatial extraction filter chosen was a rectangle with the left lower corner set at (xc + 4′′,yc-1.5′′) and the right upper corner set at (xc + 6.5′′,yc+1.5′′), where xc, yc are the centroid locations of the core for each observation. In figure 7 we show the observed spectrum of the inner-jet component with the best-fit model assuming a power-law emission process (fit 3 Table 4).
Because of the present uncertainties with response matrices below 0.5 keV for the S3 CCD, the spectral fits utilizing XSPEC were performed in the 0.6 to 4 keV range, and fits utilizing the tool LYNX (which appears to be more reliable at energies below 1 keV) were performed in the 0.2 to 4 keV range. Model 1 incorporates a simple absorbed power-law model and yields a photon index of = 2.0 0.2(LYNX, fit 1 in Table 4) or = 2.27 0.3(XSPEC, fit 3 in Table 4). Model 2 incorporates a Raymond-Smith thermal plasma model and a best-fit column density consistent with the Galactic value, and yields a best-fit temperature of 2.7 0.2 keV(LYNX, fit 2 in Table 4) or 2.29keV(XSPEC, fit 4 in Table 4) . Abundances were fixed at 0.3 of the cosmic value.
An F-test between fits 1 and 2 indicates that neither model is significantly preferred over the other. The 2-10 keV X-ray luminosity of the inner-jet region, assuming an absorbed power-law model (model 1 in Table 4), is 0.27 1044 erg s-1.
2.5. Spectral Analysis of Outer-Jet Component
The X-ray spectra for the outer-jet component were extracted from circles centered on knot WK8.9 with radii of 2.5′′. Only standard ASCA grades 0,2,3,4,6 were included, and the background was determined by extracting events within annuli centered on the core with inner and outer radii of 15′′ and 25′′, respectively. Pile-up effects are negligible for the outer-jet component due to the extended nature of the emission combined with the relatively low count rate of 0.025 counts s-1. We combined a subset of the observations of PKS 0637-752 listed in Table 1 to produce spectra of total exposure 32,931s for node 0 of S3 and 70,700s for node 1 of S3. The XSPEC and LYNX spectral fits were performed in the 0.6-6 keV range and 0.2-6 keV range, respectively. Plausible emission mechanisms for the production of the observed X-rays from the knots are synchrotron self Compton, and thermal bremsstrahlung emission from a compressed shocked medium. To distinguish between possible emission mechanisms we fit the composite knot spectrum with absorbed power-law and thermal-plasma models. More complex models were not pursued due to the relatively low counts in the composite spectrum (see Table 1) and the present uncertainties in the low-energy instrumental response. Our results are presented in Table 5. Spectral fits with thermal and power-law models provide similar reduced . The 2-10 keV luminosity of the outer-jet region, assuming an absorbed power-law model (Fit 1 in table 5), is 2.2 1044 erg s-1. No significant emission lines are detected in the outer-jet spectrum. The composite spectrum for the outer jet of PKS 0637-752 with best-fit model (Fit 3 in table 5) is shown in figure 7.
2.6. Properties of Sources in the Near Vicinity of PKS 0637-752
Several relatively X-ray bright sources (count rates above
2 10-3 cnts s-1) were detected on CCD S3 in the vicinity of PKS 0637-752.
In Table 6 we list their coordinates, count rates and distances
from the core of PKS 0637-752. We searched the USNO
catalog and found optical counterparts within 1 arcsec in only
five out of the 12 sources. No counterparts were found in the
NED and SIMBAD catalogs.
3. DISCUSSION
In figure 8 we present the SED of the WK7.8 knot of PKS 0637-752. The radio observations of PKS 0637-752 were performed at ATCA at 4.8 and 8.6 GHz. The 4.8 and 8.6 GHz beam width is 2 and 1 arcsec FWHM, respectively. The spectral indices and flux densities of the resolved components of the core, jet, and knots are presented in Table 7. Values for the optical flux density were obtained from the recent Hubble Space Telescope WFPC2 observations (Schwartz et al. 2000, in preparation and references therein).
The SED shows that a single-component power-law synchrotron model cannot explain the combined radio, optical and X-ray flux densities, since the optical lies far below a power-law interpolation between the radio and X-ray measurements. We also tested whether SSC emission or inverse Compton scattering of cosmic microwave background (CMB) photons could explain the observed X-ray emission. The model components in Figure 8 are for the case of equipartition between the magnetic-field and electron energy densities, and assume a sphere of radius 0.15 arcsec and a power-law electron number spectrum of slope 2.4 between 100 MeV and 230 GeV, steepening by unity at 30 GeV due to energy losses. A detailed description of the SSC and inverse Compton calculations and the assumptions made for the model parameters are presented in a companion paper (Schwartz et al. 2000, in preparation). We estimate an equipartition field, Beq, of about 2 10-4 Gauss. Based on this Beq value both SSC and IC on the CMB under-predict the X-ray flux by several orders of magnitude. Thermal models were also considered. Assuming a plasma temperature of 10 keV, an emission volume of 4 10-3 arcsec3 and a 2-10 keV luminosity of 1 1042 erg s-1, we estimate a plasma density of about 1 cm-3. The derived rotation measures (RM) for radio waves propagating through such a dense plasma are quite large, inconsistent with the recent radio ATCA observations at 4.8 and 8.6 GHz (Schwartz et al. 2000, in preparation; Lovell et al. 2000). These observations show a RM 80 rad m-2 in the core, but no Faraday rotation in the jet, with an upper limit of 10 rad m-2. A contrived geometry where the jet collides with a giant molecular cloud in a companion galaxy producing thermal X-rays but, from our line-of-sight, the cloud is located behind the jet, may explain the non-detection of Faraday rotation in the jet.
An examination of the radio and X-ray brightnesses of different parts of the main emission region in the jet suggests that the X-ray brightness to radio brightness ratio is remarkably constant out to the last knot (WK9.7), where the X-rays are relatively fainter. The interpretation of the change of X-ray brightness between WK8.9 and WK9.7 depends, however, on the emission process: if the X-radiation has a synchrotron origin, then the emitting electrons must be locally accelerated, and the change in X-ray brightness of WK9.7 would be telling us about changes in particle acceleration at different points in the jet. If the X-rays have an inverse Compton origin, then it is possible that the brightness change is entirely due to aging of an electron population accelerated in WK8.9, but then other difficulties in understanding the energetics of the source must be faced (see Schwartz 2000 for further discussion).
4. CONCLUSIONS
Chandra’s unique resolving-power capabilities opens a new era in X-ray astronomy.
We anticipate many more radio jets and knots will be resolved
in future observations with Chandra. The simultaneous
spatial and spectral information provided
with the Chandra/ACIS combination allows for accurate
estimates of the size and spectral densities of the knots
in extragalactic radio jets,
which leads to tighter constraints on models
that attempt to explain the X-ray emission.
The standard emission processes usually invoked to
explain X-ray emission from jets cannot explain the
X-ray observations of PKS 0637-752. In particular, simple synchrotron models
and equipartition SSC models under-predict the X-ray flux of the knots by many orders of magnitude.
Thermal models predict shocked plasma
densities and rotation measures that are too large.
Particular contrived geometries of the jet and interacting molecular cloud
may, however, explain the non-detection of Faraday rotation in the radio observations.
More complex models that invoke inhomogeneities and/or non equipartition and/or an extra photon
source to explain the X-ray emission as inverse Compton are presented in the paper
Schwartz et al. (2000), in preparation.
A careful spatial analysis combining most of the available observations of PKS 0637-752 has resolved the jet and at least four knots along the jet. The X-ray knots are 5.7, 7.8, 8.9 and 9.7 ′′ from the core of PKS 0637-752, in good agreement with the locations seen in the radio image. The X-ray knots are not individually resolved and the upper limit on their diameter is 0.4′′. The radio knots from the ATCA image are unresolved with an upper limit on their diameter also of 0.4′′. However, our VLBI observations (Schwartz et al. 2000, in preparation; Lovell et al. 2000) have been reanalyzed to search for compact components close to the radio knots, and we find that the knots are indeed resolved at 0.05′′ resolution at 5 GHz, with less than 5 mJy remaining at this resolution. This suggests that they are low surface brightness “hot-spots”.
The spectral analysis of the core, jet and knot components
has been quite complex due to the different non-optimal configurations
used for each observation and the present uncertainty
in several of the Chandra/ACIS calibration data sets.
Having quoted the above caveat we summarize
the spectral analysis of the core and jet as follows:
(1) The core flux and spectral shape are consistent with those measured
with ASCA. However, we do not detect the emission line near 1 keV claimed
in a recent ASCA observation of PKS 0637-752.
The HPR for ASCA is about 3 arcmin, so one possible explanation
for this discrepancy is that the emission line claimed to be
detected with ASCA may originate from a nearby unresolved source.
We have detected three relatively weak X-ray sources within 3 arcmin of PKS 0637-752. However, the
spectra of these sources do not show any prominent
1 keV emission lines which could explain
the ASCA results.
(2) The X-ray spectrum of the inner-jet component appears
to be slightly steeper than that of the outer-jet region (see Tables 4 and 5).
A difference in spectral slopes may be explained as follows:
A population of synchrotron-emitting relativistic electrons
in the inner-jet region are undergoing radiation losses and producing the observed
steeper spectra (X-ray and radio spectral indices -1.0).
As these electrons enter the outer-jet region (6.5′′ - 11.5′′ away from core)
they are re-accelerated in a shock or some other structure to
produce a flatter spectrum (X-ray and radio spectral indices -0.8).
As they age past 11.5′′ the radio spectrum steepens again (radio spectral index -1.0).
Also, in the region 11.5′′ away from the core where the highest-energy
electrons may plausibly have lost all their energy, the X-rays turn off as expected.
(3) Spectral fits to the outer-jet spectrum assuming thermal and power-law
models yield similar ’s. The outer-jet region is relatively bright in X-rays
with a 2-10 keV luminosity of 2.2 1044 erg s-1 (fit 1 in Table 5).
The best-fit value of the X-ray luminosity of the outer-jet is not sensitive to the
assumed emission process. The good agreement in X-ray and radio spectral slopes in the inner and
outer jet regions strongly suggests that there is substantial electron
acceleration in the knot complexes WK7.8 and WK8.9.
We would like to thank Eric Feigelson for helpful comments, Martin Hardcastle
for software used to generate figure 8 and Kenneth Lanzetta for providing
the optical flux density of knot WK7.8 used in figure 8.
This work was supported by NASA grant NAS 8-38252.
APPENDIX A
LYNX; A Simulated Based
Spectral Fitting Tool
Astrophysical X-ray spectra are commonly analyzed by creating parameterized models for the incident spectra, folding these models through the telescope and instrument responses, and then adjusting the parameters by minimizing a metric such as formed between the observed and modeled spectra. A tool that uses this approach and is widely used to fit astrophysical X-ray spectra observed from a variety of X-ray satellites is XSPEC. The telescope’s effective-area dependence with off-axis angle combined with the detector’s quantum-efficiency dependence with energy are usually incorporated into an auxiliary response file while the response of a detector to mono-energetic photons of energy E are incorporated into a spectral redistribution matrix. The spectral redistribution matrix is usually created from parameterizing the output of CCD simulations of input mono-energetic spectra. One approximation of forward fitting CCD spectra using telescope and detector response matrices is that the simulated CCD spectra are uniquely defined for a given model and set of input model parameters. In reality, however, several physical processes within CCD’s are non-deterministic such as fluorescent yields, absorption depths and photon escape probabilities, and detected spectra for identical incident spectra will in general be slightly different. This effect becomes more noticeable for spectra containing a low number of counts.
We have developed the tool LYNX that employs the forward fitting approach to infer incident astrophysical spectra. However, it differs from the conventional deterministic tools, such as XSPEC, in that the mirror and detector characteristics are determined by incorporating Monte-Carlo simulators.
In particular LYNX links to the raytrace tool MARX (Wise et al. 1997)
to simulate the mirror response and to the PSU ACIS simulator
(Townsley at al. 2000, in preparation)
to provide the CCD response.
Astrophysical spectra obtained with ACIS are initially fit
with the standard X-ray spectral fitting package XSPEC
to provide an initial guess for LYNX.
The modeled incident spectrum is propagated through the
Chandra mirrors and ACIS components with the MARX and the PSU ACIS simulators
respectively. A merit function that incorporates the differences between the
observed and simulated spectra spectrum is minimized
using a Downhill Simplex Method to yield the best-fit model parameters.
LYNX simulates the propagation of individual photons through the HRMA/ACIS
configuration and also takes into account the possible overlap of the
resulting charge clouds within each exposure. The
spectra produced through LYNX therefore will simulate pile-up.
The present version of LYNX also allows fitting spectra
of any grade selection, corrects for vignetting and
accounts for the dither motion of the source across the CCD.
| TABLE 1 | |||||||||||
| CHANDRA Observations of PKS 0637-752 | |||||||||||
| Observation | Obsid | Exposure | Frame | SIMXa | SrcYb | SrcZc | HPRd | NCoree | NInf | NOutg | NBkgh |
| Date | Time | ||||||||||
| s | s | mm | arcmin | arcmin | arcsec | cnts | cnts | cnts | cnts arcsec-2 | ||
| 1999-08-14T10:49:39 | 1051 | 1034. | 3.24 | 0.0 | 2.0 | 1.0 | 1.05 | 408 | 5 | 28 | 0.028 |
| 1999-08-14T11:36:00 | 1052 | 1041. | 3.24 | 0.0 | 2.0 | 1.0 | 0.95 | 391 | 2 | 28 | 0.045 |
| 1999-08-14T13:53:09 | 62558 | 19116. | 3.24 | 1.0 | 0.0 | 0.0 | 1.00 | 7196 | 63 | 502 | 0.498 |
| 1999-08-14T19:15:24 | 62556 | 5068. | 3.24 | 0.9 | 0.0 | 0.0 | 0.95 | 1799 | 18 | 119 | 0.111 |
| 1999-08-14T20:51:39 | 62555 | 5138. | 3.24 | 0.65 | 0.0 | 0.0 | 0.80 | 1554 | 18 | 155 | 0.108 |
| 1999-08-14T22:24:18 | 62554 | 11367. | 3.24 | 0.25 | 0.0 | 0.0 | 0.55 | 2664 | 40 | 281 | 0.267 |
| 1999-08-15T02:49:29 | 62553 | 5232. | 1.541 | 0.0 | 0.0 | 0.0 | 0.40 | 2098 | 16 | 188 | 0.110 |
| 1999-08-15T04:18:30 | 62552 | 5213. | 1.541 | -0.5 | 0.0 | 0.0 | 0.70 | 2373 | 20 | 148 | 0.100 |
| 1999-08-15T05:55:56 | 62551 | 5343. | 1.541 | -0.25 | 0.0 | 0.0 | 0.40 | 2108 | 18 | 148 | 0.108 |
| 1999-08-15T07:36:04 | 62550 | 5469. | 1.541 | 0.2 | 0.0 | 0.0 | 0.50 | 2266 | 33 | 128 | 0.099 |
| 1999-08-15T09:12:04 | 62549 | 6426. | 1.541 | 0.5 | 0.0 | 0.0 | 0.55 | 2777 | 22 | 152 | 0.133 |
| 1999-08-16T06:05:37 | 1055 | 2036. | 3.24 | 0.0 | 0.0 | 0.0 | 0.85 | 659 | 8 | 50 | 0.057 |
| 1999-08-16T06:56:36 | 1056 | 1757. | 3.24 | 0.0 | 1.4 | 1.4 | 1.10 | 744 | 5 | 42 | 0.061 |
| 1999-08-16T17:43:28 | 1058 | 1757. | 3.24 | 0.0 | -1.4 | 1.4 | 1.00 | 710 | 7 | 41 | 0.044 |
| 1999-08-16T18:29:48 | 1059 | 1760. | 3.24 | 0.0 | -3.0 | -2.8 | 1.00 | 555 | 5 | 22 | 0.250 |
| 1999-08-16T19:16:07 | 1060 | 1760. | 3.24 | 0.0 | -1.4 | -1.4 | 1.20 | 781 | 6 | 51 | 0.155 |
| 1999-08-16T20:53:19 | 1062 | 1760. | 3.24 | 0.0 | 1.4 | 1.4 | 1.10 | 758 | 9 | 54 | 0.097 |
| 1999-08-16T21:35:07 | 1063 | 1760. | 3.24 | 0.0 | 2.8 | -2.8 | 2.00 | 1019 | 15 | 40 | 0.115 |
| 1999-08-20T02:26:38 | 472 | 5809. | 0.941 | 1.0 | 0.0 | 0.0 | 1.05 | 3417 | 20 | 140 | 0.095 |
| 1999-08-20T04:54:34 | 473 | 4678. | 0.941 | 0.11 | 0.0 | 0.0 | 0.4 | 2206 | 21 | 117 | 0.085 |
| 1999-08-20T06:17:37 | 474 | 4856. | 0.941 | -0.09 | 0.0 | 0.0 | 0.4 | 2255 | 21 | 112 | 0.088 |
| 1999-08-20T07:54:18 | 475 | 4856. | 3.24 | -0.19 | 0.0 | 0.0 | 0.45 | 2386 | 22 | 100 | 0.088 |
| 1999-08-20T09:30:57 | 476 | 4856. | 0.941 | -0.98 | 0.0 | 0.0 | 1.10 | 2967 | 10 | 113 | 0.167 |
NOTES:
a SIMX Is the distance along the optical axis of the scientific instrument module
from the best focus location.
b SrcY is the distance along the Y direction from the nominal aim-point.
Y is the direction of grating dispersion. The ACIS-S array nominal aim-point falls on chip S3, 2.0arcmin to
the right (+Y) of the edge of the chip.
c SrcZ is the distance along the Z direction from the nominal aim-point.
Z is the direction normal to the grating dispersion.
d HPR is the half power radius.
e are the detected events from the core component
extracted from circles centered on the core with radii of 5′′
f are the detected events from the inner-jet component
extracted from rectangular regions having the
left lower corners set at (xc + 4′′,yc-1.5′′)
and the right upper corners set at (xc + 6.5′′,yc+1.5′′),
where xc, yc are the centroid locations of the core
for each observation.
g are the detected events from the outer-jet component
extracted from circles centered on the X-ray knot WK8.9 with radii of 2.5′′
h are the detected background events per arcsec2 extracted
from annuli centered on the core with inner and outer radii of 45′′ and 55′′ respectively.
Only events with standard ASCA grades 0,2,3,4,6 were extracted.
| TABLE 2 | |||||||
|---|---|---|---|---|---|---|---|
| Model Parameters Determined from Spectral Fits to the | |||||||
| Chandra ACIS-S Spectra of the Core Component of PKS 0637-752 | |||||||
| Fit a | Range | Flux b | Flux Density at 1 keV | c | |||
| keV | 10-12 erg s-1 cm-2 | 10-13 erg s-1 cm-2 keV-1 | 1045 erg s-1 | ||||
| 1 | 0.2-6.0 | 1.77 | 11 | 1.1(2.2) | 7.4 | 5.9(6.4) | 1.4(86) |
| 2 | 0.2-6.0 | 1.69 | 3.5 | 1.3(2.2) | 7.8 | 4.8(6.0) | 1.1(235) |
| 3 | 0.2-6.0 | 2.00 | 9.0(fixed) | 1.3(1.7) | 8.5 | 7.8(5.5) | 1.7(236) |
| 4 | 1.0-6.0 | 9.0(fixed) | 1.1(2.2) | 7.5 | 5.6(6.1) | 1.1(128) | |
NOTES-
a All fits incorporate a power-law plus absorption due to cold material at
solar abundances. Spectral fit 1
was performed with the LYNX spectral fitting tool
with events extracted from node 1 only.
Spectral fits 2, 3, and 4 were performed with the XSPEC tool
with events extracted from nodes 0 and 1.
b Fluxes calculated in the ranges 0.2-2 keV and 2-10 keV (quoted in parentheses).
X-ray fluxes are not corrected for Galactic absorption.
c Luminosities calculated in the ranges 0.2-2 keV and 2-10 keV (quoted in parentheses).
Luminosities are in the rest frame and are corrected for Galactic absorption.
| TABLE 3 | ||
|---|---|---|
| Chandra ACIS Instrumental Spectral Features | ||
| Energy | Spectral Featurea | Origin |
| keV | ||
| 0.076 | Al-L Absorption Edge | ACIS-OBF |
| 0.105 | Si L3 Absorption Edge | ACIS-CCD |
| 0.107 | Si L2 Absorption Edge | ACIS-CCD |
| 0.158 | Si L1 Absorption Edge | ACIS-CCD |
| 0.285 | C K Absorption Edge | ACIS-OBF |
| 0.402 | N K Absorption Edge | ACIS-OBF, ACIS-CCD |
| 0.535 | O K Absorption Edge | ACIS-OBF, ACIS-CCD |
| 1.486 | Al Kα Fluorescence Line | ACIS-CCD |
| 1.559 | Al Kα Absorption Edge | ACIS-OBF |
| 1.739 | Si K Flourescence Line | ACIS-CCD |
| E0-Efb | Si K Escape Peak | ACIS-CCD |
| 1.841 | Si K Absorption Edge of Polysilicon | ACIS-CCD |
| 1.8473 | Si K Absorption Edge of SiO2 | ACIS-CCD |
| 1.8447 | Si K Absorption Edge of Si3N4 | ACIS-CCD |
| 2.085c | Ir M-V Edge | HRMA |
| 2.112 | Au M Fluorescence Line | ACIS-CCD |
| 2.156c | Ir M-IV Edge | HRMA |
| 2.20 | Au M Fluorescence Line | ACIS-CCD |
| 2.410 | Au M Fluorescence Line | ACIS-CCD |
| 2.549c | Ir M-III Edge | HRMA |
| 2.906c | Ir M-II Edge | HRMA |
| 3.183c | Ir M-I Edge | HRMA |
| 7.469 | Ni Kα Fluorescence Line | ACIS-CCD |
| 9.71 | Au L Fluorescence Line | ACIS-CCD |
| 11.44 | Au L Fluorescence Line | ACIS-CCD |
| 11.52 | Au L Fluorescence Line | ACIS-CCD |
| 15.2-Ebiasd | 4096 ADU - bias level | ACIS-CCD |
| 15.2 | 4096 ADU | |
NOTES-
aAdditional instrumental spectral features arise
due to X-ray absorption fine structure (XAF)
produced in the CCD’s and UV/Optical blocking filter. These features
extend for about a few hundred eV above each of
absorption edges of Al-L, C-K, N-K, O-K, Al-K.
b E0 is the energy of the incident photon and Ef = 1.739
is the energy of the silicon flourescence photons.
c Mirror absorption energies from Graessle et al. 1992, Proc. SPIE, 1742.
d These energies are dependent on the gain and bias levels and will vary from
chip to chip.
| TABLE 4 | |||||||
| Model Parameters Determined from Spectral Fits to the | |||||||
| Chandra ACIS-S Spectra of the Inner-Jet Component of PKS 0637-752 | |||||||
| Model a | or Te | Te | Flux b | Flux Density at 1 keV | c | ||
| keV | cm-2 | 10-15 erg s-1 cm-2 | 10-15 erg s-1 cm-2 keV-1 | 1044 erg s-1 | |||
| 1 | 2.0 | 12.6 | 5.9(8.6) | 4.1 | 0.42(0.29) | 1.5(14) | |
| 2 | 2.7keV | 12.0 | 5.6(3.3) | 3.8 | 0.29(0.19) | 1.3(14) | |
| 3 | 2.27 | 9.0(fixed) | 7.8(6.8) | 5.1 | 0.63(0.25) | 1.9(8) | |
| 4 | 2.29keV | 9.0(fixed) | 7.3(3.0) | 4.7 | 0.34(0.20) | 2.0(8) | |
NOTES-
a Fits 1 and 3 incorporate a power-law spectrum plus absorption due to cold material at
solar abundances fixed to the Galactic value. Spectral fits 2 and 4
incorporate a Raymond-Smith thermal plasma model with the
abundance set at 0.3 of the cosmic value.
Fits 1 and 2 were performed in the observed energy range of 0.2 to 4 keV
using LYNX. Fits 3 and 4 were performed in the observed energy range of 0.6 to 4 keV
using XSPEC.
b Fluxes calculated in the ranges 0.2-2 keV and 2-10 keV (quoted in parentheses).
X-ray fluxes are not corrected for Galactic absorption.
c Luminosities calculated in the ranges 0.2-2 keV and 2-10 keV (quoted in parentheses).
Luminosities are in the rest frame and are corrected for Galactic absorption.
| TABLE 5 | |||||||
| Model Parameters Determined from Spectral Fits to the | |||||||
| Chandra ACIS-S Spectra of the Outer-Jet Component of PKS 0637-752 | |||||||
| Fit a | T | Flux b | Flux Density at 1 keV | c | |||
| keV | cm-2 | 10-13 erg s-1 cm-2 | 10-14 erg s-1 cm-2 keV-1 | 1044 erg s-1 | |||
| 1 | 1.83 | 11.8 | 0.40(0.75) | 2.8 | 2.3(2.3) | 2.0(49) | |
| 2 | 3.8 | 11.8 | 0.43(0.41) | 3.0 | 2.0(1.9) | 1.9(49) | |
| 3 | 1.85 | 9.0(fixed) | 0.50(0.82) | 3.3 | 2.7(2.5) | 1.3(85) | |
| 4 | 5.6 | 9.0(fixed) | 0.48(0.61) | 3.2 | 1.9(2.4) | 1.4(85) | |
NOTES-
a Fits 1 and 3 incorporate a power-law plus absorption due to cold material at
solar abundances fixed to the Galactic value. Fits 2 and 4 incorporate a
Raymond-Smith thermal plasma model plus absorption due to cold material.
Metal abundances were held fixed at 0.3 for fits 2 and 4.
Spectral fits 3 and 4 were performed with XSPEC in the observed energy range of 0.6 keV to 7 keV
with simultaneous fits to spectra extracted from nodes 0 and 1.
Fits 1 and 2 were performed with LYNX in the observed energy range 0.2 keV to 7 keV
with events extracted from node 1 only.
b Fluxes calculated in the ranges 0.2-2 keV and 2-10 keV (quoted in parentheses).
X-ray fluxes are not corrected for Galactic absorption.
c Luminosities calculated in the ranges 0.2-2 keV and 2-10 keV (quoted in parentheses).
Luminosities are in the rest frame and are corrected for Galactic absorption.
| TABLE 6 | ||||||
| Sources in the Near Vicinity of PKS 0637-752 | ||||||
| Object | X | Y | RA (J2000) | DEC (J2000) | Distance | Count Rate |
| pixel | pixel | arcmin | 10-2 cnts s-1 | |||
| CXO J063551.5-751528 | 4149 | 4209 | 6h35m51.5s | -75d15m28s | 0.89 | 0.71 0.06 |
| CXO J063538.3-751510 | 3655 | 4007 | 6h35m38.3s | -75d15m10s | 1.25 | 1.19 0.08 |
| CXO J063630.3-751522 | 3705 | 3987 | 6h36m30.3s | -75d15m22s | 2.98 | 0.37 0.04 |
| CXO J063607.2-751906 | 3897 | 3257 | 6h36m07.2s | -75d19m06s | 3.16 | 0.27 0.04 |
| CXO J063635.5-751659 | 4667 | 4053 | 6h36m35.5s | -75d16m59s | 3.25 | 0.56 0.05 |
| CXO J063551.2-751929 | 4047 | 4173 | 6h35m51.2s | -75d19m29s | 3.26 | 0.26 0.04 |
| CXO J063642.1-751649 | 3019 | 4185 | 6h36m42.1s | -75d16m49s | 3.63 | 1.24 0.08 |
| CXO J063446.7-751517 | 4051 | 3683 | 6h34m46.7s | -75d15m17s | 4.01 | 0.30 0.04 |
| CXO J063431.6-751627 | 3925 | 3729 | 6h34m31.6s | -75d16m27s | 4.85 | 0.64 0.06 |
| CXO J063500.3-752006 | 3745 | 4185 | 6h35m00.3s | -75d20m06s | 4.90 | 0.29 0.04 |
| CXO J063522.0-752107 | 4275 | 3483 | 6h35m22.0s | -75d21m07s | 5.17 | 0.36 0.04 |
| CXO J063438.0-751921 | 4441 | 3605 | 6h34m38.0 s | -75d19m21s | 5.40 | 0.23 0.03 |
NOTES-
a Distance from core of PKS 0637-752.
| TABLE 7 | |||
| Radio Spectral Indices and Flux Densities of PKS 0637-752 Components | |||
| Component | 4.8 GHz Flux Density | 8.6 GHz Flux Density | |
| Jy | Jy | ||
| Core | 6.373 | 6.343 | -0.01 |
| Inner West Jet | 0.321 | 0.200 | 0.81 |
| Outer West Jet | 0.167 | 0.095 | 0.97 |
| East Jet | 0.206 | 0.110 | 1.08 |
| Total Cleaned Flux | 7.03 0.02 | 6.72 0.02 | |
NOTES-
a All radio spectral energy indices follow the convention of
flux density
where = ( - 1).
Note that the inner and outer West radio jet are defined as the components
of the jet before and after the bend at WK9.7. 1 Jy is equivalent to
10-29 erg cm-2 s-1 Hz-1.
References
Arnaud, K. A., ASP Conf. Ser. 101: Astronomical Data Analysis Software and Systems V, 1996, 5, 17
Biretta, J. A., Stern, C. P., & Harris, D. E., 1991, AJ, 101, 1632
Dickey, J. M., and Lockman, F. J., 1990, ARA&A, 28, 215
Elvis, M. and Fabbiano, G., 1984, ApJ, 280, 91
Harris, D. E., Nulsen, P. E. J., Ponman, T. J., Bautz, M., Cameron, R. A., David, L. P., Donnelly, R. H., Forman, W. R., Grego, L., Hardcastle, M. J., Henry, J. P., Jones, C., Leahy, J. P., Markevitch, M., Martel, A. R., McNamara, B. R., Mazzotta, P., Tucker, W., Virani, S. N., & Vrtilek, J., 2000, ApJ, 530, L81
Harris, D. E., Carilli, C. L., and Perley, R. A., 1994, Nature, 367, 713
Harris, D. E., and Stern, C. P., 1987, ApJ, 313, 136
Lawson, A. J., & Turner, M. J. L., 1997, MNRAS, 288, 920
Lovell, J. E. J., Tingay, S. J., Piner, B. G., Jauncey, D. L., Preston, R. A., Murphy, D. W., McCulloch, P. M., Costa, M. E., Nicolson, G., Hirabayashi, H., Reynolds, J. E., Tzioumis, A. K., Jones, D. L., Lister, M. L., Meier, D. L., Birkinshaw, M., Chartas, G., Feigelson, E. D., Garmire, G. P., Ghosh, K. K., Marshall, H. L., Mathur, S., Sambruna, R. M., Schwartz, D. A., Tucker, W. H., Wilkes, B., & Worrall, D. M., 2000, Proc. VSOP Symbosium.
Meisenheimer, K., Roser, H. -J., Hiltner, P. R., Yates, M. G., Longair, M. S., Chini, R. and Perley, R. A., 1989, A&A, 219, 63
Schwartz, D. A., Birkinshaw, M., Chartas, G., Feigelson, E. D., Ghosh, K. K., Harris, D. E., Hooper, E. J., Jauncey, D. L., Lanzetta, K. M., Lowell, J., Marshall, H. L., Mathur, S., Piner, G., Preston, R. A., Tingay, S. J., Tucker, W. H., Virani, S., Wilkes, B., and Worrall, D., 2000 submitted to ApJ.
Siebert, J., Kawai, N., Brinkmann, W., 1999, A & A, 350, 25
Tingay, S. J., Murphy, D. W., Lovell, J. E. J., Costa, M. E., McCulloch, P., Edwards, P. G., Jauncey, D. L., Reynolds, J. E., Tzioumis, A. K., King, E. A., Jones, D. L., Preston, R. A., Meier, D. L., van Ommen, T. D., Nicolson, G. D. and Quick, J. F. H., 1998, ApJ, 497, 594
van Speybroeck, L. P., Jerius, D., Edgar, R. J., Gaetz, T. J., Zhao, P., and Reid, P. B., 1997, Proc. SPIE, 3113, 89
Wise, M. W., Davis, J. E., Huenemoerder, Houck, J. C., Dewey, D. Flanagan, K. A., and Baluta, C. 1997, The MARX 2.0 User Guide, CXC Internal Document available at http://space.mit.edu/ASC/MARX/
Weisskopf, M. C. and O’Dell, S. L., Proc. SPIE, 1997, 3113, 2
Yaqoob, T, George, I. M., Turner, T.J., Nandra, K., Ptak, A., & Serlemitsos, P. J., 1998, ApJ, 505, L90