ALFA & 3D: integral field spectroscopy with adaptive optics
Abstract
One of the most important techniques for astrophysics with adaptive optics is the ability to do spectroscopy at diffraction limited scales. The extreme difficulty of positioning a faint target accurately on a very narrow slit can be avoided by using an integral field unit, which provides the added benefit of full spatial coverage. During 1998, working with ALFA and the 3D integral field spectrometer, we demonstrated the validity of this technique by extracting and distinguishing spectra from binary stars separated by only 0.26′′. The combination of ALFA & 3D is also ideally suited to imaging distant galaxies or the nuclei of nearby ones, as its field of view can be changed between 1.2′′1.2′′ and 4′′4′′, depending on the pixel scale chosen. In this contribution we present new results both on galactic targets, namely young stellar objects, as well as extra-galactic objects including a Seyfert and a starburst nucleus.
Keywords: laser guide star, adaptive optics, spectroscopy, Seyfert galaxy, starburst, young stellar object
1 INTRODUCTION
The effort currently being directed at the development of adaptive optics (AO) systems by the astronomical community is driven ultimately by the science results they can bring. To this end it is a requirement that spectroscopy can be done in conjunction with AO. Hitherto most results published have been pure broad-band imaging. The reason is that classical spectroscopy imposes a number of limitations, the most important of which concerns the slit width. Either the slit is extremely narrow (0.1′′) in which case it is difficult to align on faint targets, or it is wider leading to loss of spatial resolution along that axis. As a consequence mapping of sources on arcsec scales becomes a very slow process. Integral field spectroscopy overcomes both of these by obtaining spectra of every pixel in a field that is large compared to the diffraction limited PSF. Thus there is a reasonable degree of error permissible in positioning faint targets, and the inner arcseconds of a source can be simultaneously mapped in emission and absorption lines.
3D is an integral field spectrometer built by MPE (Weitzel et al. 1996), which obtains H- or K- band spectra of an entire 1616 pixel field at resolutions of or . An Aperture Interchange Module (AIM, Anders et al. 1998) allows it to be used with ALFA. AIM provides 2 pixel scales: 0.07′′ giving a 1.2′′1.2′′ field of view for the diffraction limited mode, and 0.25′′ giving a ‘wide’ 4′′4′′ field of view for partial correction (as might occur in poorer seeing conditions). Additionally AIM can switch between on-axis and off-axis fields so that sky frames can be observed without opening the AO loop, a necessary step in normal ALFA operation. Serendipitously, although ALFA can only lock on a reference star that is 20′′ off-axis, AIM allows stars much further off-axis to be used. In this mode, which was used for 2 of the objects presented here, the telescope is pointed to a ‘sky’ patch close to the reference star and AIM’s off-axis field is used to observe the target.
In this contribution we present a brief summary of some results we have obtained using ALFA & 3D to observe both galactic and extragalactic sources. In Sections 2 and 3 discuss the young stellar objects V 1318 Cygni and T Tau. We turn to the nucleus of the LINER galaxy NGC 1161 in Section 4, and finish in Section 5 with the archetypal Seyfert 2 nucleus of NGC 1068.
2 V 1318 Cygni
2.1 Introduction
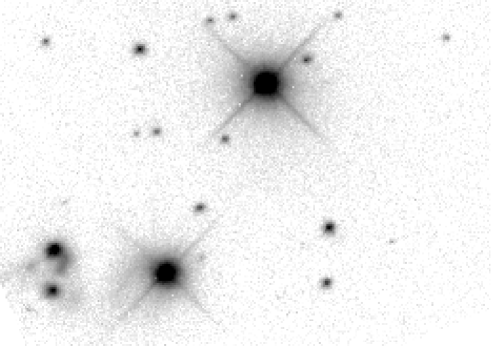
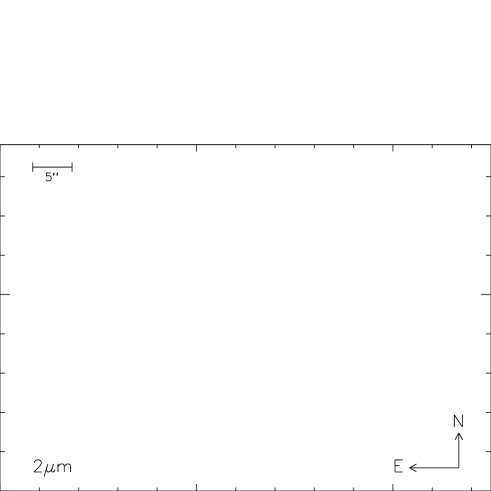
The small stellar group around the two Herbig Ae/Be stars BD +40∘ 4124 and V 1686 Cyg is a relatively isolated molecular core containing a number of partially embedded low-mass stars (Hillenbrand et al. 1995). A K-band image of the field, observed using ALFA & Omega-Cass in 1998 (Davies et al. 1999) with a fwhm resolution of 0.25′′, is shown in Fig. 1. In this Section we consider data obtained on the pair of stars which constitute V 1318 Cyg (also known as Lk H 225), observed with ALFA & 3D during Oct 1999 using a pixel scale of 0.25′′. They are separated by 5.2′′ (so 2 overlapping fields were required) equivalent to 5000 AU at the distance of the cluster (980 pc, Hillenbrand et al. 1995). While this is rather large, nearly 5% of known YSOs do have such wide separations (Mathieu 1994), although clearly they are not likely to have a combined circumstellar envelope. The wavefront reference, BD +40∘ 4124 (mV=10.6,mK=5.6), lies 34′′ away and is the only star in the group brighter than mV=12. The pixel scale, ambient seeing conditions, and distance to the reference star limited the final resolution to 0.6′′.
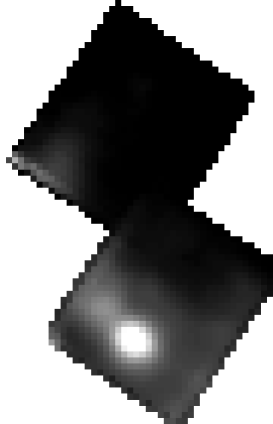
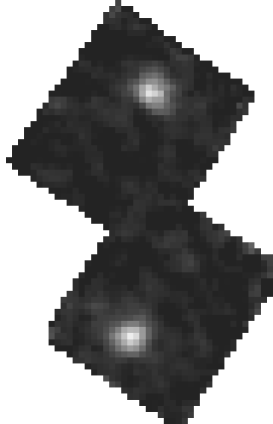
We present a continuum image as well as H2 and CO emission line maps in Fig 2, and plot spectra in Fig. 3. The spectra are rather different from the only other published K-band spectra (Aspin, Sandell, & Weintraub, 1994). We find that the northern star is much brighter in K than the southern star, and shows no evidence for H2 emission. On the other hand, both stars have a similar CO emission flux. These characteristics are briefly discussed below.


2.2 YSO Class
The shape of the spectra are most similar to those of Class I young stellar objects presented in the Atlas of Greene & Lada (1996). These are the least evolved sources, surrounded by relatively massive envelopes of gas and dust. Class I objects are associated with very high K-band veilings (the ratio of excess to photospheric emission in the K-band, ). The excess emission is believed to come from hot dust or an accretion disk around the star and does not necessarily redden the star itself. Optical spectroscopy from Hillenbrand (1995) suggests that these stars have spectra types mid A to F, and extinctions of AK–8. We have therefore fitted a simple model, comprising an extincted (AK=10) mid to late A star (Teff=8000 K) and a dust component (with temperature Td to be determined), to the spectra. The degeneracy that arises from varying the spectra type and extinction does not permit a more general model to be used. On the other hand fitting only a dust component leaves a significant residual which rises towards the blue. The northern star has best fitting parameters Td=520 K and =3.4 (rms residual 0.033, on the same scale as figure 3); the southern star yielded Td=430 K and =1.7 (rms residual 0.010). This confirms the identification of V 1318 Cyg N as Class I, but suggests that V 1318 Cyg S is closer to Class II in which the massive envelope is dissipating or the accretion rate is slowing.

2.3 Emission Line Features
Fig 2 (centre) is a map of the H2 1-0 S(1) emission, showing that the strongest emission is located directly on the southern star and there is an outflow/jet or extra source to its east. A Br image is not shown as there is none detectable. Although these observations are in stark contrast to those of T Tau (Section 3), they do not contradict the survey of YSOs by Greene & Lada (1996) in which 23/44 of Class I–II objects showed Br emission, and only 5/44 exhibited H2 emission.
A continuum-subtracted spectrum of the south star is presented in Fig 4, in which 8 H2 lines are detectable at 3, 4 from each of the =1-0 and =2-1 series. The strength of the latter lines immediately rules out models of pure thermal or fluorescent excitation. Possible alternatives include a combination of these two, or excitation in fast (100–300 km s-1) shocks leading to dissociation of the molecules.
CO emission has been known to occur in some YSOs for 20 years. High spectral resolution observations suggest that emission from an accretion disk is the most likely source, although it is not yet possible to rule out neutral winds in all cases (Chandler, Carlstrom, & Scoville 1995). In a survey of 40 YSOs, Carr (1989) observed 9 with CO emission. For an accretion disk model he found that accretion rates of 10-8– a few M⊙ yr-1 could account for the CO bandhead fluxes and the correlation with stellar luminosity. For a wind model mass loss rates of 10-7–10-5 M⊙ yr-1 were needed. Greene & Lada (1996) also considered accretion disks but in the context of veiling, and found that accretion rates M⊙ yr-1 could account for . But the greater accretion rates required for much higher veiling are not compatible with CO emission. It appears initially as if an accretion disk model could simultaneously account for the veiling and CO emission in the southern source. In the northern source the CO flux is similar and could indicate similar conditions (density, temperature, accretion rate) in the accretion disk, but an additional hot dust envelope probably contributes to the higher veiling. This issue, and the others briefly touched upon above, will be examined in more detail in a future paper.

3 T Tauri
3.1 Introduction
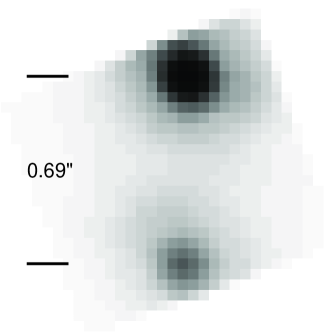
T Tau is an unusually complex system of multiple (at least two) stellar components, jets and outflows unlike that seen in any other T Tauri star. The optically visible primary, T Tau N, was measured to be a K1 star (Cohen & Kuhi 1979), and has an companion 0.7′′ to the south (Dyck, Simon & Zuckerman 1982). This companion, T Tau S, exhibits a spectral energy distribution suggestive of a very young embedded source (Koresko, Herbst & Leinert 1997) assigning it to the class of infrared companions (IRC) of which very few are known today. It shows an apparent lack of cold dust emission and has undergone a brightness flare of 2 magnitudes at various wavelengths between 1989 and 1991 (Ghez et al. 1991). Recent speckle holography observations revealed an companion to T Tau S which is separated by only 0.05′′ (Koresko, 2000). The near environment of T Tau is a source of surprisingly strong extended 2.12 m =1-0 S(1) ro-vibrational line emission (Beckwith et al. 1978). The spatial distribution of this excited shows two separate outflows which are perpendicular to each other in projection (Langevelde et al. 1994, Herbst et al. 1996). Recent optical spectroscopy (Solf & Böhm 1999) indicated that these outflows are in fact almost perpendicular with the N-S component originating from T Tau S and the E-W component originating from T Tau N. This supports the model that T Tau S is intrinsically similar to T Tau N but is obscured by the outer parts of T Tau N’s disk (Hogerheijde et al. 1997).
Investigating these small angular scale phenomena is a formidable observational challenge, since the seeing limit from ground-based observatories smears detail on scales of approximately hundred AU. High angular resolution for imaging and spectroscopy is mandatory for untangling these phenomena. Diagnostic spectral lines include the Br (n=7-4) 2.17 m recombination line of hydrogen, which traces stellar winds, ionized regions and accretion, and the 2 m quadrupole lines of molecular hydrogen, which, through their distribution and ratios, will point to regions of shock excitation and ultraviolet fluorescence.

3.2 Observations
T Tauri was observed with the 3D imaging spectrometer in H- and K-band in October 1999 at the 3.5-m-telescope on Calar Alto with a spectral resolution of in H and in K. The adaptive optics system ALFA used T Tau N (mV) as a natural guide star delivering angular resolutions of 0.14′′ in H and 0.16′′ in K. The total integration time was 14 and 18 minutes respectively .
Standard techniques of sky substraction and flat fielding removed background emission, dark current and pixel-to-pixel gain variations. A G2V star was observed at similar airmass to T Tau and served as a photometric, spectroscopic and PSF reference. Division by the spectroscopic standard and subsequent multiplication by a solar spectrum of the same spectral resolution eliminated telluric features, photospheric features of the G2V star, and produced the correct spectral slope across the band. The final data structure consists of 600 separate wavelength slices, each containing the spatial information over a 1′′1′′ region.
Fig. 5 shows a K-band continuum image of the inner square arcsecond of T Tau which is the whole high resolution field of view of 3D when used with ALFA. T Tau S, which was reported to be extended compared to T Tau N (Roddier et al. 1998), is point-like in the K-band continuum and in the Br line-map. The H-band data, which is of a somewhat better resolution, indicates that T Tau S is slightly elongated at a position angle corresponding to the rescently discovered companion. Both stars are still unresolved in the Br 10 (1.74 m) line-map.
Fig. 6 displays the K-band spectra of T Tau N and T Tau S.
The most prominent feature is the Br emission line with
equivalent widths of 2.4 Å for T Tau N and 1.5 Å for T Tau S.
While earlier observations showed Br to be
confined to T Tau N (Herbst et al. 1996), our data indicates that both
components are accreting classical T Tauri stars.
Furthermore the stars themselves do not appear to be responsible for
much H2 emission, a large amount of which was found
in the vicinity of T Tau at seeing scales (Herbst et al. 1996).
The photospheric features of T Tau N are consistent with a
veiled () spectrum of a K1 star, while T Tau S
appears almost featureless.
A detailed analysis of all the H- and K-band data will be the subject of a future paper (Kasper, Herbst, Looney in prep).
4 NGC 1161
4.1 Introduction
Optical spectroscopy of NGC 1161 by Ho, Filippenko, & Sargent (1997) suggested that NGC 1161 is a ‘transition object’, exhibiting properties similar to both LINER and starburst. In particular the high ratios [Nii]/H=1.75, [Sii]/H=0.52, and [Oi]/H=0.14 tend to put the galaxy in the AGN region of the diagnostic diagrams developed by Fruscione & Griffiths (1991). Furthermore Ho et al. claim to have detected a broad component to the H emission, constituting about half the total H flux.
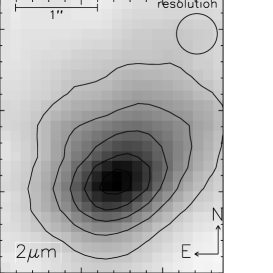
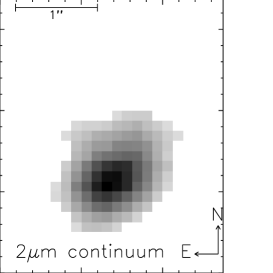
In order to shed light on the excitation source in the nucleus of this galaxy, we observed it with ALFA & 3D in Oct 99. The wavefront reference was the mV=9.9 star PPM 45763 45′′ to the east. A pair of stars from the Washington Double Star Catalogue was found which matched this configuration, allowing the PSF to be measured. As a result of the large offset and also due to the non-ideal seeing, the resolution achieved was 0.5′′. Fig 7 (left) shows the K-band image of the galaxy, in which the nucleus is clearly extended on sub-arcsec scales.
4.2 Stellar Populations
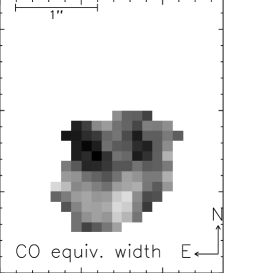
The central image in Fig. 7 has been masked, leaving only those pixels where there is good signal to noise in the K-band continuum. In these pixels the equivalent width of the CO absorption in the first 2 bandheads has been measured and is shown in the right-hand image. This shows that the deepest CO absorption – corresponding to the largest fraction of late-type supergiant stars or least dilution form hot dust – occurs in 2 regions distinct from the continuum peak.

A spectrum of the inner 1′′ is presented in Fig 8 (spectra of smaller individual regions are similar). Overdrawn is a best-fit spectrum made from templates of late-type stars, consisting of 10% M-type supergiants and 90% K0 and K5 giants. Fitting only the wavelength range 2.25–2.37 m gives a 25% contribution from supergiants. The existence of supergiants indicates that star formation has occured in at least 2 sites in the last 107 yr. It is interesting that while the first CO bandhead is very well fit, the second is less so and the third not at all. This may suggest a contribution of cool 500 K dust to the emission at longer wavelengths.
The spectrum shows that any activity in the continuum peak is dominated by a stellar population typical of normal galaxies. Since the flux of late-type stars peaks in the infrared, it is natural to look at the optical spectrum to see if there is a population of bluer OB stars. The spectrum of Ho et al. extracted in a 2′′4′′ box also shows little evidence for young stars. A fit including A stars is a marginally better fit than one without, but a UV spectrum would be needed to clarify the issue.
Our conclusion is that the main episodes of star formation on NGC 1161 are over, so that the only remnants observable in the infrared are late-type supergiants. In the optical, the narrow component of H may be produced by A stars which have not yet evolved away from the main sequence. The broad H may suggest that there is a galactic wind resulting from supernovae, and other lines such as [Nii] and [Sii] may be excited in shocked clouds as this wind expands. If this is the case H-band observations of [Feii] at 1.64 m, which traces supernova remnants in starbusts, would help to explain the observations.
5 NGC 1068
5.1 Introduction
NGC 1068 holds a special interest both in astrophysics, because it is so close and is considered an archetypal Seyfert 2 galaxy, and also in adaptive optics, because it is faint and in the optical is extended. Correcting on the nucleus of NGC 1068 has been likened to earning the ‘driving licence of AO systems’.
For a Shack-Hartmann sensor we can consider the number of photons available in each spot on which it is necessary to estimate the centroid. To do so we assume 70% atmospheric transmission, 70% telescope and instrument transmission (including detector quantum efficiency), 50 cm subapertures (matched to 1′′ seeing), 100 Hz frame rate. For NGC 1068, in a 2.8′′ aperture mV=13.5 (Antonucci & Miller, 1985) while mK=10.1 (Thatte et al. 1997). Hence there are only 200 photons for the centroid calculation, rather too few for a robust estimation (Kasper et al. 1999). To obtain a good result requires either excellent seeing, but partial correciton can be achieved by undersampling the wavefront.
ALFA was able to lock on this galaxy for the first time in Oct 99 and achieve a resolution of 0.25′′ in the H-band, confirming that in this waveband the nucleus is single and has no other bright knots of emission nearby. More recently, it has been possible to correct on fainter objects and during Feb 00 it was possible to use Mkn 231 as the wavefront reference (integrated mV=13.6, and mV14.3 in the nucleus).
[Fe ii] 1.64 m
5.2 Line Map
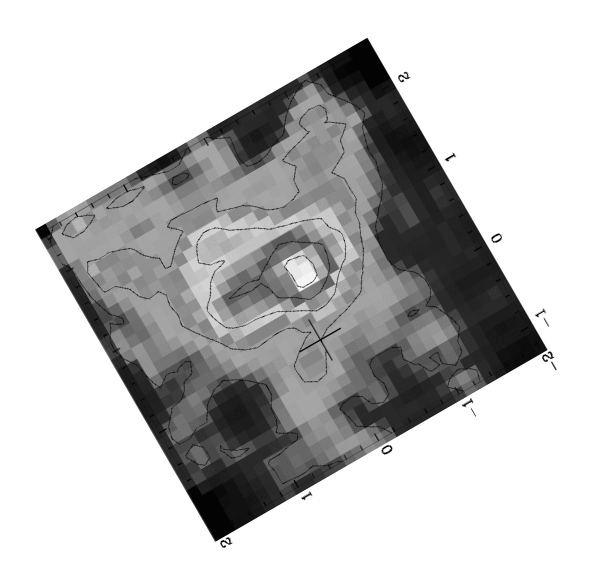
The first 2 m integral field spectroscopy of NGC 1068 was presented by Blietz et al. (1994). At a resolution of 1′′, they found that the 1.64 m [Feii] emission peaked close to the continuum nucleus and was extended northeast along the direction of the radio jet. The surface brightness of the line emission was greatly reduced where the radio continuum widened. Their interpretation was that the line emission arises at the interface bewteen the nuclear outflow and surrounding molecular clouds. The [Feii] could be excited either by X-ray photo-ionisation of the clouds, or as a result of fast J-shocks destroying grains which contain most of the interstellar iron.
Fig 9 shows the new image from ALFA & 3D which reveals more structure in the [Feii] line. The peak of the line emission is to the north of the continuum nucleus, and there is some faint emission to the south. Examination of the spectra suggest that there is a difference in line-of-sight velocity between the north and south emission. A detailed analysis of the [Feii] line and other data will be presented elsewhere (Thatte et al. in prep).
6 Conclusion
We have presented a selection of results obtained using the ALFA adaptive optics system and the 3D integral field spectrometer during October 1999.
Although only one of the results is at the diffraction limit of the telescope the others demonstrate that AO is still viable in the partial correction mode, to improve poor seeing or when using far off-axis reference stars.
Together they show the real advantages of integral field techniques over conventional longslit spectroscopy when used in conjunction with adaptive optics. However, one disadvantage is also abundantly clear: the spatial field is very limited if one dimension of the detector is used for the spectral regime. Here we used a 2562 detector for a 3.5-m telescope (at Calar Alto), but the problem will remain for 8-m telescopes even with larger detectors due to the smaller diffraction limit. Nevertheless, these preliminary results are very encouraging for the future of integral field spectroscopy with adaptive optics.
ACKNOWLEDGMENTS
The authors extend their thanks to everyone who has helped in this project with their hard work and enthusiasm. In particular we gratefully acknowledge the commitment of the ALFA team, the 3D team, and the staff at Calar Alto.
References
- [1] Anders S., Maiolino R., Thatte N., Genzel R., 1998, Aperture Interchange Module (AIM): diffraction limited NIR spectroscopy with 3D and ALFA, in Infrared Astronomical Instrumentation, SPIE, 3354,
- [2] Antonucci R., Miller J, 1985, Spectropolarimetry and the Nature of NGC 1068, ApJ, 297, 621
- [3] Aspin C., Sandell G., Weintraub D., 1994, The remarkable pre-main sequence object V 1318 Cygni, A&A, 282, L25
- [4] Beckwith S., et al. 1978, Molecular hydrogen emission from T Tauri stars, ApJ, 223, 41
- [5] Blietz M., Cameron M., Drapatz S., Genzel R., Krabbe A., et al., 1994, Near-Infrared Spectroscopic Imaging of the Circumnuclear Environment of NGC 1068, ApJ, 421, 92
- [6] Carr J., 1989, near-Infrared CO emission in Young Stellar Objects, ApJ, 345, 522
- [7] Chandler C., Carlstrom J., Scoville N., 1995 Infrared Emission from Young Stars: Accretion Disks and Neutral Winds, ApJ, 446, 793
- [8] Cohen M., Kuhi L. V. 1979, Observational studies of pre-main-sequence evolution, ApJS, 41, 743
- [9] Davies R., Hackenberg W., Ott T., Eckart A., Rabien S., et al., 1999, First Observational Results from ALFA with Natural and Laser Guide Stars, in Astronomy with Adaptive Optics, eds. Bonaccini, ESO Proc. 56, 153
- [10] Dyck H. M., Simon T., Zuckerman B., 1982, Discovery of an infrared companion to T Tauri, ApJ, 255, 103
- [11] Fruscione A., Griffiths R., 1991, Search for Starbursts among X-ray selected Galaxies: Optical Spectroscopy, ApJ, 380, L13
- [12] Ghez A. M., et al., 1991, : Diffraction limited infrared images of the binary star T Tauri, AJ, 102, 2066
- [13] Greene T., Lada C., 1996, Near-Infrared Spectra and the Evolutionary Status of Young Stellar Objects, AJ, 112, 2184
- [14] Herbst T. M., Beckwith S., et al., 1996, : A Near-Infrared Spectral Imaging Study of T Tau, AJ, 111, 2403
- [15] Ho L., Filippenko A., Sargent W., 1997, A search for “Dwarf” Seyfert Nuclei. III., ApJS, 112, 315
- [16] Hogerheijde M. R., et al., 1997, Subarcsecond Imaging at 267 GHz of a Young Binary System. Detection of a Dust Disk of Radius Less than 70 AU around T Tauri N, ApJL, 490, 99
- [17] Kasper M., Looze D., Hippler S., Davies R., Glindemann A., 1999, Increasing the sensitivity of a Shack-Hartmann sensor, in Wavefront Sensing And Its Applications, University of Kent, Canterbury, UK
- [18] Koresko C.D., Herbst T.M., Leinert Ch., 1997, The Infrared Companions of T Tauri stars, ApJ, 480, 741
- [19] Koresko C.D., 2000, A Third Star in the T Tauri System, astro-ph/0001370
- [20] Hillenbrand L., Meyer M., Strom S., Skrutskie M., 1995, Isolated Star-Forming Regions containing herbgi Ae/Be Stars. I., AJ, 109, 280
- [21] Mathieu R., 1994., Pre-Main-Sequence Binary Stars, ARA&A, 32, 465
- [22] Solf J., Böhm K. -H., 1999, A Deep Long-Slit Spectroscopic Study of the Two Bipolar Outflows from the T Tauri Binary System, ApJ, 523, 709
- [23] Roddier C., et al., 1998, Four-year observations of T Tauri with adaptive optics in Astronomy with Adaptive Optics, eds. Bonaccini, ESO Proc. 56, 389
- [24] Thatte N., Quirrenbach A., Genzel R., Maiolino R., Tecza M., 1997, The Nuclear Stellar Core, the Hot Dust Source, and the Location of the Nucleus in NGC 1068, ApJ, 490, 238
- [25] van Langevelde H. J., et al., 1994, The spatial distribution of excited H2 in T Tau. A molecular outflow in a young binary system, A&A, 287, 25
- [26] Weitzel L. Krabbe A., Kroker H., et al., 1996, 3D: The next generation near-infrared imaging spectrometer, A&AS, 119, 531