Kinematic Age Estimates for 4 Compact Symmetric
Objects
from the Pearson-Readhead Survey
Abstract
Based on multi-epoch observations at 15 and 43 GHz with the Very Long Baseline Array (VLBA) we detect significant angular expansions between the two hot spots of 4 Compact Symmetric Objects (CSOs). From these relative motions we derive kinematic ages of between 300 and 1200 years for the radio emission. These ages lend support to the idea that CSOs are produced in a recent phase of activity. These observations also allow us to study the evolution of the hot spots dynamically in individual sources. In all 4 sources the hot spots are separating along the source axis, but in 1031+567 the tip of one hot spot appears to be moving almost orthogonally to the source axis. Jet components, seen in 3 of the 4 sources observed, are found to be moving relativistically outward from the central engines towards the more slowly moving hot spots.
1 Introduction
While most radio galaxies exhibit an asymmetric, core-jet morphology on the parsec scale, approximately 7% of radio galaxies in complete, flux-limited samples display parsec-scale jets and lobe emission on both sides of a central engine (Taylor et al. 1996). This emission is thought to be free of Doppler boosting effects (Wilkinson et al. 1994) and the sources are believed to be physically small as opposed to appearing small due to projection.
The measurement of a kinematic age for the CSO 0710+439 by Owsianik & Conway (1998) of just 1100 100 years lent strong support to the theory that CSOs are small by virtue of their youth and not because of confinement. This was the favored interpretation by Phillips & Mutel (1980, 1982) who first drew attention to a group of 4 compact double sources with steep spectra and slow motions compared to the majority of core-jet sources. Although further multi-frequency VLBI observations have revealed that 2 of these (CTD93 - Shaffer, Kellermann & Cornwell 1999; and 3C 395 - Taylor 2000) are actually asymmetric core-jet sources, many of the speculations of Phillips & Mutel have been borne out. Their misidentification of two sources emphasizes the fact that sensitive multi-frequency VLBI observations are required to demonstrate symmetric structure on the parsec scale. In particular, not all (or even most) GHz Peaked Spectrum (GPS) radio galaxies belong to the CSO class. Failure to find any evidence of the extremely dense environment required to confine CSOs, along with some indirect age measurements, also led Readhead et al. (1996a) to favor the idea that CSOs are young. In fact, angular separation rates for the CSOs measured to date indicate typical hotspot velocities of 0.1 c (e.g., Owsianik et al. 1998, Owsianik & Conway 1998, Polatidis et al. 1999). Such speeds are about an order of magnitude larger than predicted by Readhead et al. (1996a) and so indicate even younger ages.
The evolution of CSOs is of considerable current interest. To understand the evolution of radio galaxies we need to be able to recognize the evolutionary state of any given galaxy. Readhead et al. (1996b) have proposed an evolutionary model for powerful radio sources in which CSO’s evolve first into Compact Steep Spectrum doubles and then into large Fanaroff-Riley (1974) Type II objects. Based on a different sample of somewhat larger objects, Fanti et al. (1995) reached the same conclusions. Measurements of source ages are crucially important to the understanding of the evolution of this intriguing class of objects.
In 1994 Taylor, Readhead, and Pearson (1996) performed VLBA observations of 4 CSOs from the Pearson-Readhead survey (Pearson & Readhead 1988) at 15 GHz in order to pinpoint their centers of activity. The results were surprising in that the components inferred to be the cores, because of strongly inverted spectra and compactness, were found not to be associated with the strongest central components seen at 5 GHz and lower frequencies, but instead were unresolved components very close to the midway point between the hotspots (e.g., Fig. 1). The bright components seen at 5 GHz (in some cases previously mis-identified as cores) turn out to be one-sided jets. To further characterize the properties of the core components we carried out 43 GHz VLBA observations of several PR CSOs in 1996 and 1999.
In §3 we present multi-epoch VLBA observations at 15 and 43 GHz for four CSOs from the PR survey. These results are used in §4 to measure the advance speeds of the hot spots, and to thereby determine kinematic age estimates. Velocity measurements are expressed in terms of = H0 / 100 km s-1 Mpc-1, and where physical scales are quoted (or drawn) we assume .
2 Observations and Data Reduction
Observations were made at 15 and 43 GHz using the Very Long Baseline Array (VLBA)111The National Radio Astronomy Observatory is a facility of the National Science Foundation operated under cooperative agreement by Associated Universities, Inc. telescope at multiple epochs between 1994 and 1999. The details of the observations are provided in Table 1. All sources were observed with 5–8 scans spread across a wide range in hour angle in order to obtain good (, ) coverage. The VLBA correlator produced typically 16 frequency channels across every 8 MHz of observing bandwidth in each 2 second integration period.
Calibration procedures were followed for the 15 GHz data in a manner similar to that used for the first epoch observations as described in Taylor, Readhead & Pearson (1996). At 43 GHz the delays and IF phase offsets were determined from the injected pulse-calibration and a short observation of the strong calibrator 3C 84. The data were then averaged in frequency to a single channel of 64 MHz. No global fringe-fitting was attempted as the scatter in the solutions so derived was judged to be worse than the small residual delay error. After phase self-calibration with a 10 s solution interval and a point-source model, the data were coherently averaged to 10 s integrations. All editing, imaging, deconvolution, and self-calibration were performed using Difmap (Shepherd, Pearson & Taylor 1994, 1995). Several iterations of phase self-calibration and imaging were performed with each data set before any attempt at amplitude self-calibration, and no amplitude self-calibration was attempted at 43 GHz. No reliable 43 GHz image could be obtained for the weakest source, 0108+388. At each iteration, windows for clean components were added, if necessary, to provide support and reject sidelobes.
Once the data were completely self-calibrated, Gaussian model-fitting was performed using Difmap. To determine relative motions the component shapes and sizes were frozen in the model-fitting to equal the fitted values in the first epoch, while the flux densities and positions of components were allowed to vary. The AIPS task JMFIT was also used to perform Gaussian model-fitting to the hotspots in the image plane. In all cases the AIPS JMFIT produced very similar results to fitting the visibility data.
3 Results
A history of the VLBI observations of each source studied herein can be found in Taylor, Readhead & Pearson (1996; hereafter TRP96). For convenience source identifications and redshifts are given in Table 2, and measurements of core properties are summarized in Table 3. Here we describe our velocity measurements and compare them with recent results in the literature. We compute the kinematic age of the source in its rest frame, , as where is the angular separation of the hot spots, and is the angular separation rate of the hot spots.
3.1 0108+388
In Fig. 1 we show a naturally weighted 15 GHz image of 0108+388. This image shows continuous emission connecting the two main components (labeled C1 through C7). Component C3 was identified as the core based on its inverted spectrum and compactness (TRP96; and see Table 3). A detailed spectral analysis between 1.6 and 15 GHz has been carried out by Marr, Taylor, and Crawford (2000a,b) who find that while C3 is likely to have a spectral turnover at a high frequency due to synchrotron self-absorption, the spectra of other components turn over around 5 GHz because of free-free absorption by an ionized disk centered on the nucleus. More evidence for a relatively dense circumnuclear environment comes from Hi absorption measurements by Carilli et al. (1998) who find an optical depth of 0.44 0.04 and implied column density of 80.7 1018 T cm-2, where Ts is the spin temperature and is the Hi covering factor. Owsianik, Conway & Polatidis (1998) measured an angular separation rate for the outer components (C1 and C7) of 9.3 1.2 as yr-1 from 3 epochs of global VLBI observations at 5 GHz spread over 12 years.
Given the identification of C3 as the core in 0108+388, the relative velocity of 0.57 0.35 c (see Fig. 1 and Table 4) is at first glance somewhat alarming since one traditionally assumes the core component to be stationary. The core component, however, is likely to be just the optically thick base of the jet (Blandford & Königl 1979), and could well appear to move in either direction along the jet axis as new jet components emerge. In one of the few cases where absolute motions have been obtained there is evidence that the “core” of 1928+738 moves in this way (Ros et al. 1999). For this reason, the core component makes a poor choice as a reference feature. Instead we adopt the westernmost component (C1) as the reference feature. As we will argue, this is likely to be a subrelativistic hotspot. This choice is somewhat arbitrary, and we could just as well have taken the easternmost hot spot (C7) as a reference.
From our 3 VLBA epochs at 15 GHz we find a separation rate for C1 and C7 of 11 2 as yr-1, which is in agreement with the measurements of Owsianik et al. (1998) and also with recent measurements at 8.4 GHz (Polatidis et al. 1999). Our kinematic age estimate for 0108+388 is 310 70 yrs. Assuming that C1 and C7 are moving apart at equal speeds, this gives each an advance speed of 0.12 c. The best-fit models from which these velocities were derived are listed in Table 4. A significant velocity of 0.79 0.04 c is found for component C5, although since this is relative to C1 the true velocity of C5 likely to be smaller by 0.12 c.
Due to the low flux density of 0108+388 at 43 GHz, it was not possible to self-calibrate the data and make an image. Even so we can still estimate that the core flux density must be less than 40 mJy at 43 GHz, otherwise it would have been readily detected. This indicates that the spectral index is not as steeply inverted as at the lower frequencies (see Table 3).
3.2 0710+439
Owsianik & Conway (1998) reported the first significant detection of a hot spot advance speed based on 5 epochs on 0710+439 at 5 GHz between 1980 and 1993. The hot spots (components A2 and C2) were found to have a separation rate of 14 1.6 as yr-1.
In Fig. 2 we show our 2nd epoch 15 GHz observations with motions derived from the two epochs indicated by arrows. Components A and C are both leading-edge brightened with emission fading gradually towards the center of the source. Component B is more compact at the southern end and becomes wider to the north with an opening angle of 20 degrees. At the base of the jet a compact inverted spectrum component (B5 in Fig. 2) was identified and inferred to be the core by TRP96. Gaussian model-fits and component motions are given in Table 5. In general our 15 GHz model components correspond to the 5 GHz model of Owsianik & Conway (1998), but at 15 GHz the extended components A1, B1 and C1 are resolved out. The other difference in the 5 and 15 GHz models is the core component (B5) which was too weak to be included in the 5 GHz model.
We find a separation rate between the hotspots (A2 and C2) of 29 8.7 as yr-1. The implied velocity of advance, assuming equal speeds, is 0.26 c. This velocity is nearly twice that found by Owsianik & Conway (1998). The kinematic age we derive for 0710+439 is 550 160 yrs. Since the epochs do not overlap, one explanation could be that the hot spot advance speed has recently doubled. A more likely explanation for the discrepancy is that the 15 GHz observations are more sensitive to the motion of a bright, compact working surface, while the 5 GHz observations measure the more stable overall expansion of the lobe. In support of this idea we note that the size of component A2 is 0.51 0.33 mas at 15 GHz, and 0.84 0.57 mas at 5 GHz.
We also find a substantial velocity of 1.36 0.16 c for component B3 relative to C2. This velocity, however, is accompanied by a change in the flux density of B3 from 116 mJy in 1994.971 to only 63 mJy in 1999.587. The large drop in flux could indicate a region or subcomponent that faded significantly, causing a large shift in the centroid.
In Fig. 3 we show an image of 0710+439 at 43 GHz. Only the core, inner jet complex, and brightest region of the northern hot spot are detected. The hot spot is well resolved in these observations and shows a similar twist to the southeast as indicated in the 15 GHz image. The core component is prominent and still unresolved. The core has a 15-43 GHz spectral index of 0.2 0.3 (where ). Despite the higher resolution afforded by the 43 GHz observations, no significant component motions were detected due to the shorter time baseline and lower signal-to-noise compared to the 15 GHz observations.
3.3 1031+567
A map made from our 15 GHz observations of 1031+567 is shown in Fig. 4 and the modelfit components are listed in Table 6. No central core component is apparent. It is likely that the two outermost components are the working surfaces and lobes of two oppositely directed jets, given the edge brightened appearance and steep spectra (TRP96) and that no core emission is detected. This source is also remarkable for the very small (1 – 9%) change in the flux density of its components.
We report here a first tentative detection of the expansion of 1031+567. We find a separation rate between the hot spots W1 and E1 of 14.6 4.8 as yr-1, although not along the axis of the source (see Fig. 4). A larger expansion rate is found between W1 and E2 of 37.6 8.4 as yr-1 roughly along the position angle of the axis. The kinematic age derived from the W1–E2 expansion rate is 620 140 yrs. Assuming equal advance speeds this corresponds to a velocity of 0.31 c.
3.4 2352+495
The hot spots (labeled A and C after Conway et al. 1992) are well resolved in our 15 GHz image (Fig. 5). We also see a faint narrow jet to the south of the bright B1-B5 complex with a compact component (D) embedded in it and identified by TRP96 as the core. Based on global VLBI observations at 5 GHz over 14 years, Owsianik, Conway & Polatidis (1999) measured a relative angular separation rate for the hot spots of 21.1 2.7 as yr-1.
The model-fit results at 15 GHz for 2352+495 are listed in Table 7. From our two epoch VLBA observations over 4.6 years we find an angular separation velocity for the hot spots of 33 11 as yr-1. Given our large uncertainty, these observations are consistent with the findings of Owsianik et al. (1999). Our measured component separation rate yields a kinematic age for 2352+495 of 1200 400 years. Assuming equal advance speeds for the hot spots yields a velocity of 0.16 c. The jet components in the component B complex have velocities ranging from 0.27 – 0.76 c.
In Fig. 6. we show a 43 GHz image of 2352+495. Only the core and B1-B5 complex is detected. The core component appears well isolated and still unresolved, and has a 15-43 GHz spectral index of 0.6 0.4.
4 Discussion
4.1 Baby Radio Galaxies?
The kinematic ages derived for the 4 bright CSOs studied here range from 300 to 1200 yrs. This is part of a growing body of evidence conclusively demonstrating that CSOs are indeed young objects. These ages are derived under the assumption that the velocity has been constant over the entire period of activity. The kpc-scale bridge of emission in 0108+388 (Baum et al. 1990) suggests prior active phases in at least this CSO. Owsianik et al. (1998) have suggested that the one-sided appearance of the large scale structure is due to this periodic nature and light travel time effects.
In 3 of the 4 CSOs observed here the hot spots appear to be advancing along the jet axis. The one exception is 1031+567 for which the separation of the hot spot heads is not along the axis of the source, although the lobe complex is moving out along the source axis. In the dentist drill model (Scheuer 1974) for radio galaxy evolution, the hotspots wander around the leading edge of the lobe. At lower frequencies (see for example Owsianik et al. 1999) the northern lobe of 2352+495 appears to extend further from the core than the hotspot. There is also a sharp bend at the hotspot so it is possible that the jet is deflected at the “primary” hot spot toward the east.
4.2 Core and Jet Properties
Three of the four CSO’s studied here contain central components inferred to be the cores. All three of these apparent core components display spectra that peak around 15 GHz (see Table 3) and are unresolved. If the turnovers are due to synchrotron self-absorption, following Marscher (1983) one finds that the magnetic fields in the cores must be less than 7 , 80, and 600 Gauss in 0108+388, 0710+439, and 2352+495, respectively. Free-free absorption is unlikely to be significant at 15 GHz, although it has been demonstrated to be significant at frequencies below 5 GHz in the central regions of some CSOs (e.g., 1946+708 – Peck, Taylor, & Conway 1999; 0108+388 – Marr, Taylor, & Crawford 2000a,b). One might also expect the cores to turn over more sharply than is indicated in Table 3 if free-free absorption is the dominant mechanism.
In 0108+388 we find marginal evidence for motion of the core component. Less significant motions are detected in 0710+439 and 2352+495. These motions are expected in the Blandford & Königl (1979) model where the core is the base of an optically thick jet as new components emerge from the center of activity.
Jet components moving relativistically from the cores towards the hot spots are seen in all sources studied here except 1031+567. In 0710+439 and 2352+495 the jet components appear stronger on one side of the core, consistent with their fast motions and probably indicating that these sources do not lie in the plane of the sky. Without some additional constraint on jet velocities, however, the inclination angle is not well determined.
5 Conclusions
We confirm hot spot advance speeds of 0.2 c in three CSOs and present a new detection for the CSO 1031+567. These growth rates correspond to ages between 300 and 1200 yrs for the current phase of activity in the sources studied here. Further observations should allow for a more precise determination of the hot spot velocities and will test the dentist drill model for radio sources.
References
- (1)
- (2) Baum, S. A., O’Dea, C. P., de Bruyn, A. G., & Murphy, D. W. 1990, A&A, 232, 19
- (3) Blandford, R. D., & Königl, A. 1979, ApJ, 232, 34
- (4) Carilli, C. L., Menten, K. M., Reid, M. J., Rupen, M. P. & Yun, M. S. 1998, ApJ, 494, 175
- (5) Conway, J.E., Pearson, T.J., Readhead, A.C.S., Unwin, S.C., Xu, W., & Mutel, R.L. 1992, ApJ, 396, 62
- (6) Fanaroff, B. L., & Riley, J. M. 1974, MNRAS, 167, 31P
- (7) Fanti, C., Fanti, R., Dallacasa, D., Schilizzi, R. T., Spencer, R. E. & Stanghellini, C. 1995, A&A, 302, 317
- (8) Lawrence, C. R., Zucker, J. R., Readhead, A. C. S., Unwin, S. C., Pearson, T. J., & Xu, W. 1996, ApJS, 107, 541
- (9) Marr, J. M., Taylor, G. B., & Crawford, F. 2000a, in Astrophysical Phenomena Revealed by Space VLBI, eds. H. Hirabayashi, P.G. Edwards, and D. W. Murphy (ISAS: Tokyo), in press
- (10) Marr, J. M., Taylor, G. B., & Crawford, F. 2000b, ApJ, in prep.
- (11) Marscher, A. P. 1983, ApJ, 264, 296
- (12) Owsianik, I., & Conway, J. E. 1998, A&A, 337, 69.
- (13) Owsianik, I., Conway, J. E., & Polatidis, A. G. 1998, A&A, 336, L37
- (14) Owsianik, I., Conway, J. E., & Polatidis, A. G. 1999, New Astronomy Reviews, 43, 669
- (15) Patnaik, A. R., Browne, I. W. A., Wilkinson, P. N., & Wrobel, J. M. 1992, MNRAS, 254, 655
- (16) Peck, A. B., Taylor, G. B., & Conway, J. E. 1999, ApJ, 521, 103
- (17) Phillips, R. B., & Mutel, R. L. 1980, ApJ, 236, 89
- (18) Phillips, R. B., & Mutel, R. L. 1982, A&A, 106, 21
- (19) Pearson, T.J., & Readhead, A.C.S. 1988, ApJ, 328, 114
- (20) Polatidis, A.G., Wilkinson, P.N., Xu, W., Readhead, A.C.S., Pearson, T.J., Taylor, G.B., & Vermeulen, R.C. 1999, New Astronomy Reviews, 43, 657
- (21) Readhead, A. C. S., Taylor, G. B., Xu, W., Pearson, T. J., Wilkinson, P. N., & Polatidis, A. G. 1996a, ApJ, 460, 612
- (22) Readhead, A. C. S., Taylor, G. B., Pearson, T. J., & Wilkinson, P. N. 1996b, ApJ, 460, 612
- (23) Ros, E., Marcaide, J. M., Guirado, J. C., Ratner, M. I., Shapiro, I. I., Krichbaum, T. P., Witzel, A., & Preston, R. A. 1999, A&A, 348, 381
- (24) Scheuer, P. A. G. 1974, MNRAS, 166, 513
- (25) Shaffer, D. B., Kellermann, K. I., & Cornwell, T. J. 1999, ApJ, 515, 558
- (26) Shepherd, M. C., Pearson, T. J., & Taylor, G. B. 1994, BAAS, 26, 987
- (27) Shepherd, M. C., Pearson, T. J., & Taylor, G. B. 1995, BAAS, 27, 903
- (28) Taylor, G.B., Vermeulen, R.C., Readhead, A.C.S., Pearson, T.J., Henstock, D.R., and Wilkinson, P.N. 1996, in The Second Workshop on Gigahertz Peaked Spectrum and Compact Steep Spectrum Radio Sources, eds. I.A.G. Snellen, R.T. Schilizzi, H.J.A. Rottgering, and M.N. Bremer (Leiden Observatory:Leiden)
- (29) Taylor, G. B., Readhead, A. C. S., & Pearson, T. J. 1996, ApJ, 463, 95; TRP96
- (30) Taylor, G. B. 2000, ApJ, in press
- (31) Wilkinson, P. N., Polatidis, A. G., Readhead, A. C. S., Xu, W., & Pearson, T. J. 1994, ApJ, 432, L87
- (32) Xu, W. 1994, Ph.D. Thesis, California Institute of Technology
- (33)
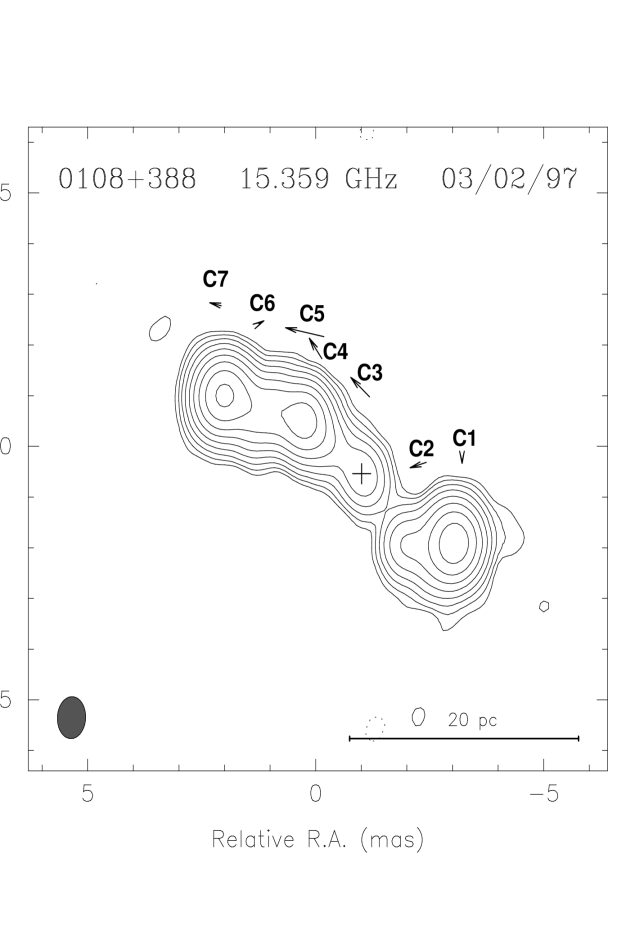
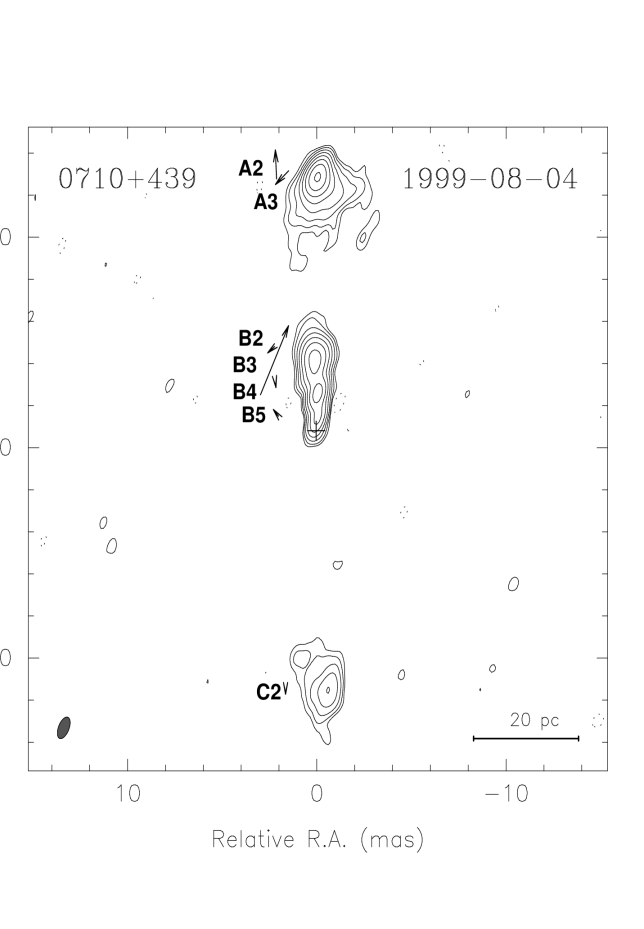
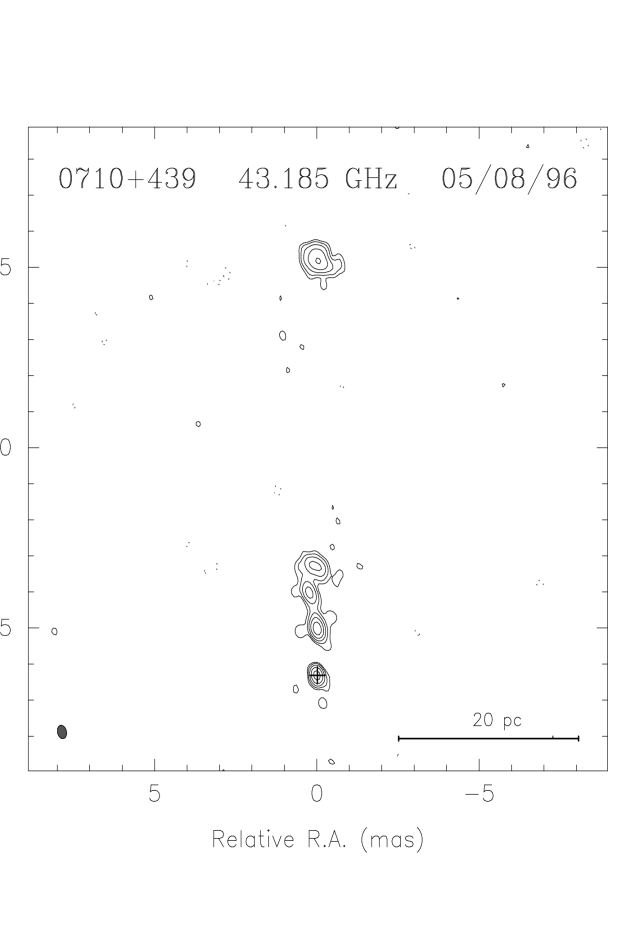
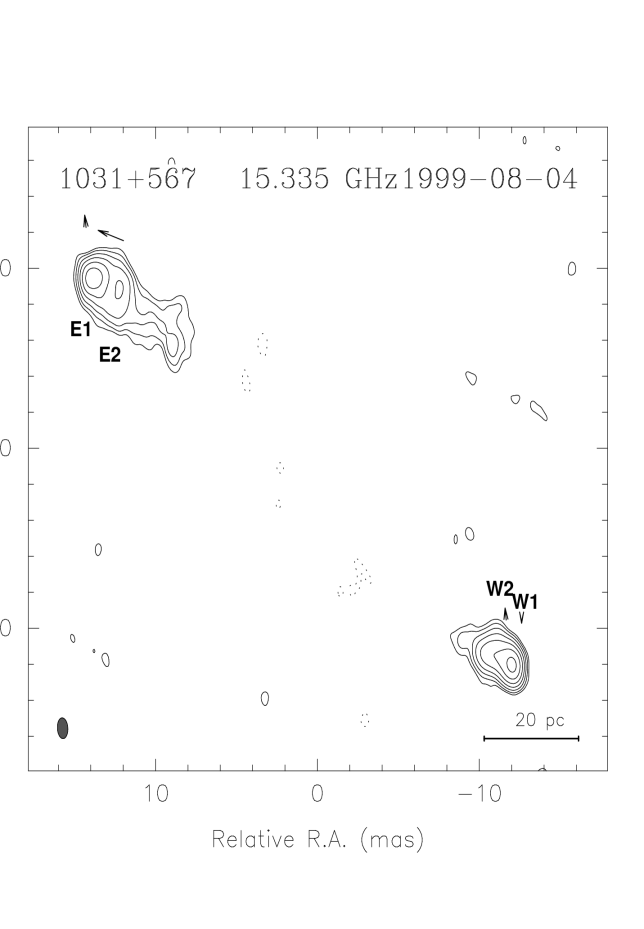
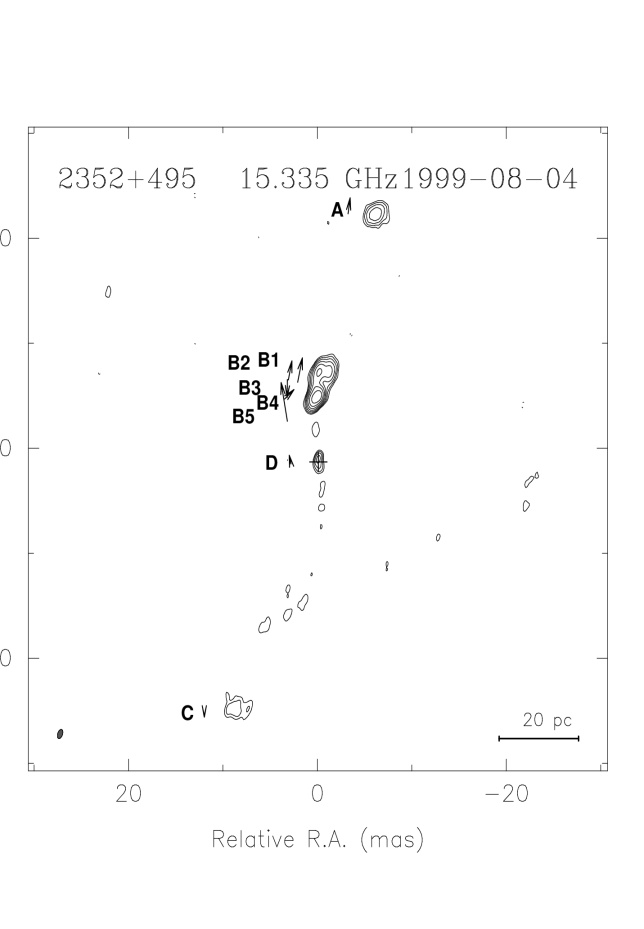
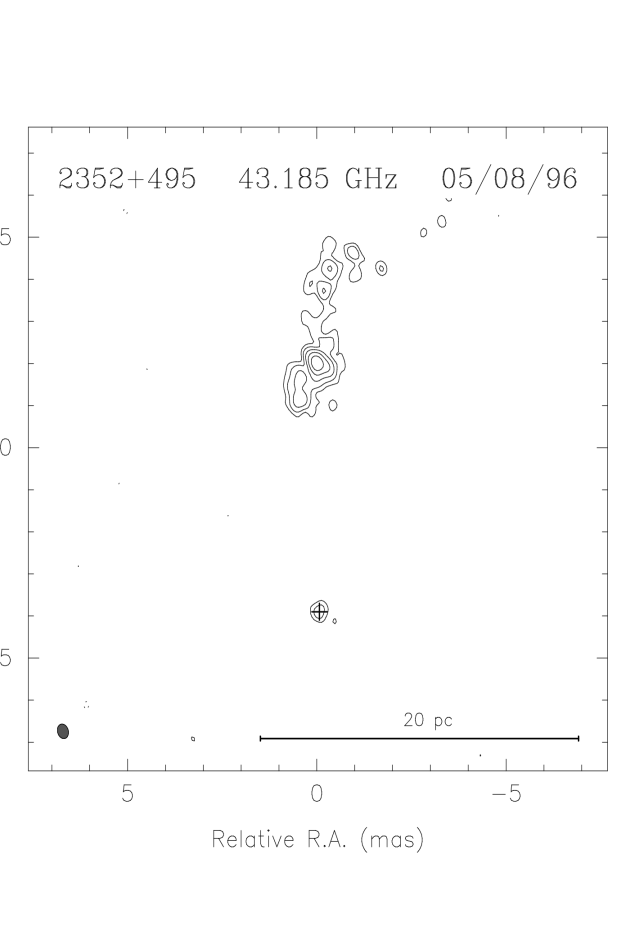
TABLE 1
Observational Parameters
| Source | Date | Frequency | Bandwidtha | Scan Length | Total Time |
|---|---|---|---|---|---|
| (GHz) | (MHz) | (min) | (hours) | ||
| 0108+388 | 1994.971 | 15.4 | 16 | 26 | 2.2 |
| 1996.594 | 43.2 | 64 | 5 | 1.3 | |
| 1997.092 | 15.4 | 64 | 5 | 4.3 | |
| 1999.587 | 15.4 | 64 | 5 | 1.2 | |
| 1999.587 | 43.2 | 64 | 7 | 1.6 | |
| 0710+439 | 1994.971 | 15.4 | 16 | 13 | 1.3 |
| 1996.594 | 43.2 | 64 | 5 | 1.3 | |
| 1999.587 | 15.4 | 64 | 5 | 1.2 | |
| 1999.587 | 43.2 | 64 | 7 | 1.5 | |
| 1031+567 | 1995.411 | 15.4 | 16 | 13 | 1.4 |
| 1999.587 | 15.4 | 64 | 5 | 1.0 | |
| 2352+495 | 1994.971 | 15.4 | 16 | 26 | 3.5 |
| 1994.971 | 43.2 | 64 | 6 | 1.6 | |
| 1999.587 | 15.4 | 64 | 5 | 1.2 |
a Total bandwidth refers to the sum of RCP and LCP bandwidths when both were observed in 1994.971.
TABLE 2
Source Identifications
| Source | R.A. | Declination | ID | ||
|---|---|---|---|---|---|
| (1) | (2) | (3) | (4) | (5) | (6) |
| 0108+388 | 01 11 37.3118 | 39 06 28.110 | 22 | G | 0.6703 |
| 0710+439 | 07 13 38.1766 | 43 49 17.005 | 21 | G | 0.518 |
| 1031+567 | 10 35 07.0451 | 56 28 46.697 | 20 | G | 0.4597 |
| 2352+495 | 23 55 09.4539 | 49 50 08.362 | 20 | G | 0.237 |
Notes – Col.(1): B1950 Source name according to IAU convention. Cols.(2)-(3):J2000.0 right ascension and declination (Patnaik et al. 1992). Col.(4): Visual magnitude (Pearson & Readhead 1988). Col.(5): Optical identification: G, galaxy. Col.(6): Redshift (Lawrence et al. 1996).
TABLE 3
Core Properties
| Source | (8 GHz) | (15 GHz) | (43 GHz) | (8-15) | (15-43) |
|---|---|---|---|---|---|
| (1) | (2) | (3) | (4) | (5) | (6) |
| 0108+388 | 6.3 1 | 14 2 | 40 | 1.3 0.4 | 1.0 |
| 0710+439 | 42 4 | 45 5 | 37 7 | 0.1 0.3 | 0.3 |
| 1031+567 | 3 | – | – | – | |
| 2352+495 | 13 3 | 12 3 | 6.5 1 | 0.1 0.7 | 0.4 |
Notes – Col.(1): Source name. Col.(2): Flux density of the core in mJy at 8.4 GHz from Xu (1994). Col.(3): Flux density of core in mJy at 15 GHz. Col.(4): Flux density of core in mJy at 43 GHz. Col.(5): Spectral index of core at between 8.4 and 15 GHz. Col.(6): Spectral index of core at between 15 and 43 GHz.
TABLE 4
Gaussian Model and Relative Proper Motions for 0108+388
| Component | Epoch | p.a. | ||||||||
|---|---|---|---|---|---|---|---|---|---|---|
| (Jy) | (mas) | (∘) | (mas) | (∘) | (as/yr) | ( c) | (∘) | |||
| C1… | 1994.971 | 0.119 | 0.0 | 0.0 | 0.53 | 0.74 | 30.5 | |||
| 1997.092 | 0.115 | 0.0 | 0.0 | 0.53 | 0.74 | 30.5 | ||||
| 1999.587 | 0.105 | 0.0 | 0.0 | 0.53 | 0.74 | 30.5 | reference | |||
| C2… | 1994.971 | 0.033 | 0.894 | 91.85 | 0.82 | 0.72 | 66.4 | |||
| 1997.092 | 0.027 | 0.931 | 92.42 | 0.82 | 0.72 | 66.4 | ||||
| 1999.587 | 0.023 | 0.963 | 92.90 | 0.82 | 0.72 | 66.4 | 16 20 | 0.35 0.44 | 106 | |
| C3… | 1994.971 | 0.010 | 2.510 | 55.98 | 0.29 | 1.0 | 0.0 | |||
| 1997.092 | 0.014 | 2.507 | 55.87 | 0.29 | 1.0 | 0.0 | ||||
| 1999.587 | 0.012 | 2.615 | 55.59 | 0.29 | 1.0 | 0.0 | 26 16 | 0.57 0.35 | 48 | |
| C4… | 1994.971 | 0.037 | 3.664 | 54.76 | 0.89 | 0.20 | 74.7 | |||
| 1997.092 | 0.030 | 3.750 | 54.58 | 0.89 | 0.20 | 74.7 | ||||
| 1999.587 | 0.024 | 3.664 | 54.26 | 0.89 | 0.20 | 74.7 | 23 20 | 0.51 0.44 | 44 | |
| C5… | 1994.971 | 0.054 | 4.022 | 53.04 | 0.17 | 0.28 | 76.6 | |||
| 1997.092 | 0.061 | 4.097 | 53.60 | 0.17 | 0.28 | 76.6 | ||||
| 1999.587 | 0.069 | 4.170 | 53.99 | 0.17 | 0.28 | 76.6 | 36 2 | 0.79 0.04 | 79 | |
| C6… | 1994.971 | 0.104 | 4.856 | 57.68 | 0.93 | 0.37 | 84.8 | |||
| 1997.092 | 0.089 | 4.859 | 57.68 | 0.93 | 0.37 | 84.8 | ||||
| 1997.092 | 0.083 | 4.844 | 57.44 | 0.93 | 0.37 | 84.8 | 4.7 6 | 0.10 0.12 | 67 | |
| C7… | 1994.971 | 0.172 | 5.830 | 59.84 | 0.47 | 0.48 | 79.3 | |||
| 1997.092 | 0.152 | 5.841 | 59.88 | 0.47 | 0.48 | 79.3 | ||||
| 1999.587 | 0.130 | 5.878 | 59.98 | 0.47 | 0.48 | 79.3 | 11 2 | 0.24 0.04 | 76 |
Notes to Table 4
NOTE – Parameters of each Gaussian component of the model brightness distribution: , flux density; , polar coordinates of the center of the component relative to an arbitrary origin, with polar angle measured from north through east; , major and minor axes of the FWHM contour; , position angle of the major axis measured from north through east; , relative proper motion of the component; , relative projected velocity in units of c ( = H0/100 km s-1 Mpc-1), along the given position angle (p.a.).
TABLE 5
Gaussian Model and Relative Proper Motions for 0710+439
| Component | Epoch | p.a. | ||||||||
|---|---|---|---|---|---|---|---|---|---|---|
| (Jy) | (mas) | (∘) | (mas) | (∘) | (as/yr) | ( c) | (∘) | |||
| C2… | 1994.971 | 0.051 | 0.0 | 0.0 | 1.30 | 0.62 | 7.3 | |||
| 1999.587 | 0.043 | 0.0 | 0.0 | 1.30 | 0.62 | 7.3 | reference | |||
| B5… | 1994.971 | 0.042 | 12.941 | 2.17 | 0.56 | 0.33 | 13.1 | |||
| 1999.587 | 0.041 | 12.974 | 2.29 | 0.56 | 0.33 | 13.1 | 9.3 9.7 | 0.17 0.17 | 42 | |
| B4… | 1994.971 | 0.121 | 14.205 | 2.03 | 0.46 | 0.25 | 15.8 | |||
| 1999.587 | 0.107 | 14.184 | 2.02 | 0.46 | 0.25 | 15.8 | 4.5 8.7 | 0.08 0.16 | 171 | |
| B3… | 1994.971 | 0.116 | 15.355 | 2.13 | 1.15 | 0.31 | 25.5 | |||
| 1999.587 | 0.063 | 15.670 | 1.56 | 1.15 | 0.31 | 25.5 | 76.0 8.7 | 1.36 0.16 | 24 | |
| B2… | 1994.971 | 0.115 | 15.854 | 2.66 | 1.05 | 0.29 | 13.1 | |||
| 1999.587 | 0.126 | 15.826 | 2.80 | 1.05 | 0.29 | 13.1 | 10.4 8.7 | 0.19 0.16 | 129 | |
| A3… | 1994.971 | 0.126 | 23.743 | 0.43 | 2.11 | 0.60 | 68.7 | |||
| 1997.092 | 0.095 | 23.679 | 0.60 | 2.11 | 0.60 | 68.7 | 20.6 11 | 0.37 0.20 | 133 | |
| A2… | 1994.971 | 0.185 | 24.333 | 1.16 | 0.51 | 0.65 | 51.4 | |||
| 1999.587 | 0.189 | 24.468 | 1.17 | 0.51 | 0.65 | 51.4 | 29.2 8.7 | 0.52 0.16 | 3 |
Notes to Table 5
See notes to Table 4.
TABLE 6
Gaussian Model and Relative Proper Motions for 1031+567
| Component | Epoch | p.a. | ||||||||
|---|---|---|---|---|---|---|---|---|---|---|
| (Jy) | (mas) | (∘) | (mas) | (∘) | (as/yr) | ( c) | (∘) | |||
| W1… | 1995.411 | 0.078 | 0.0 | 0.0 | 0.69 | 0.71 | 13.2 | |||
| 1999.587 | 0.080 | 0.0 | 0.0 | 0.69 | 0.71 | 13.2 | reference | |||
| W2… | 1995.411 | 0.097 | 1.075 | 62.24 | 1.68 | 0.54 | 71.5 | |||
| 1999.587 | 0.099 | 1.113 | 59.31 | 1.68 | 0.54 | 71.5 | 16.3 12 | 0.27 0.20 | 5 | |
| E2… | 1995.411 | 0.085 | 32.057 | 49.64 | 2.42 | 0.56 | 44.0 | |||
| 1999.587 | 0.092 | 32.211 | 49.74 | 2.42 | 0.56 | 44.0 | 37.6 8.4 | 0.61 0.14 | 70 | |
| E1… | 1995.411 | 0.065 | 33.699 | 50.34 | 0.72 | 1.00 | 0.00 | |||
| 1999.587 | 0.064 | 33.748 | 50.26 | 0.72 | 1.00 | 0.00 | 14.6 4.8 | 0.24 0.08 | 6 |
Notes to Table 6
See notes to Table 4.
TABLE 7
Gaussian Model and Relative Proper Motions for 2352+495
| Component | Epoch | p.a. | ||||||||
|---|---|---|---|---|---|---|---|---|---|---|
| (Jy) | (mas) | (∘) | (mas) | (∘) | (as/yr) | ( c) | (∘) | |||
| C… | 1994.971 | 0.024 | 0.0 | 0.0 | 2.06 | 0.61 | 81.0 | |||
| 1999.587 | 0.019 | 0.0 | 0.0 | 2.06 | 0.61 | 81.0 | reference | |||
| D… | 1994.971 | 0.013 | 25.237 | 20.29 | 0.64 | 0.17 | 4.1 | |||
| 1999.587 | 0.012 | 25.310 | 20.18 | 0.64 | 0.17 | 4.1 | 19.1 32 | 0.18 0.31 | 13 | |
| B5… | 1994.971 | 0.084 | 30.104 | 15.72 | 0.53 | 0.53 | 8.4 | |||
| 1999.587 | 0.048 | 30.433 | 15.42 | 0.53 | 0.53 | 8.4 | 79.1 11 | 0.76 0.11 | 10 | |
| B4… | 1994.971 | 0.156 | 30.913 | 16.30 | 0.60 | 0.80 | 54.3 | |||
| 1999.587 | 0.117 | 31.025 | 16.43 | 0.60 | 0.80 | 54.3 | 28.6 11 | 0.27 0.11 | 48 | |
| B3… | 1994.971 | 0.075 | 31.390 | 15.66 | 1.56 | 0.39 | 0.4 | |||
| 1999.587 | 0.101 | 31.227 | 15.74 | 1.56 | 0.39 | 0.4 | 36.6 11 | 0.35 0.11 | 179 | |
| B2… | 1994.971 | 0.120 | 33.047 | 15.38 | 0.94 | 0.63 | 25.4 | |||
| 1997.092 | 0.064 | 33.229 | 15.36 | 0.94 | 0.63 | 25.4 | 39.4 11 | 0.38 0.11 | 12 | |
| B1… | 1994.971 | 0.085 | 33.360 | 17.03 | 1.20 | 0.70 | 5.8 | |||
| 1999.587 | 0.058 | 33.592 | 17.00 | 1.20 | 0.70 | 5.8 | 50.5 11 | 0.48 0.11 | 13 | |
| A… | 1994.971 | 0.055 | 49.243 | 17.47 | 1.20 | 0.69 | 68.2 | |||
| 1999.587 | 0.042 | 49.392 | 17.44 | 1.20 | 0.69 | 68.2 | 32.7 11 | 0.31 0.11 | 8 |
Notes to Table 7
See notes to Table 4.