High-Resolution Imaging of Molecular Gas and Dust in the Antennae (NGC 4038/39): Super Giant Molecular Complexes
Abstract
We present new aperture synthesis CO maps of the Antennae (NGC 4038/39) obtained with the Caltech Millimeter Array. These sensitive images show molecular emission associated with the two nuclei and a partial ring of star formation to the west of NGC 4038, as well as revealing the large extent of the extra-nuclear region of star formation (the “overlap region”), which dominates the CO emission from this system. The largest molecular complexes have masses of M⊙, typically an order of magnitude larger than the largest structures seen to date in more quiescent galaxy disks. The extremely red luminous star clusters identified previously with HST are well-correlated with the CO emission, which supports the conclusion that they are highly embedded young objects rather than old globular clusters. There is an excellent correlation between the CO emission and the 15 m emission seen with ISO, particularly for the brightest regions. The most massive complexes in the overlap region have similar [NeIII]/[NeII] ratios, which implies that all these regions are forming many massive stars. However, only the brightest mid-infrared peak shows strong, rising continuum emission longward of 10 m, indicative of very small dust grains heated to high temperatures by their proximity to nearby luminous stars. Since these grains are expected to be removed rapidly from the immediate environment of the massive stars, it is possible that this region contains very young ( Myr) sites of star formation. Alternatively, fresh dust grains could be driven into the sphere of influence of the massive stars, perhaps by the bulk motions of two giant molecular complexes. The kinematics and morphology of the CO emission in this region provide some support for this second scenario.
Subject headings:
galaxies: individual (NGC 4038, NGC 4039) – galaxies: ISM – ISM: molecules1. Introduction
The all-sky survey carried out by the Infrared Astronomical Satellite identified a large number of galaxies that are extremely luminous in the infrared (i.e. Soifer et al. 1984). Follow-up optical imaging revealed that galaxy interactions play a key role in generating these large infrared luminosities, since virtually all of the nearby galaxies with infrared luminosities L⊙ are strongly interacting or merger systems (Sanders et al. 1988). Recent spectroscopic work with the Infrared Space Observatory (ISO) suggests that a major fraction of the infrared luminosity in these systems is generated by a starburst rather than an active galactic nucleus (Genzel et al. 1998; Lutz et al. 1998; Laurent et al. 2000). Identifying the origin of the intense star formation produced in galaxy mergers is also an important step towards understanding galaxy formation in the early universe, since the faint submillimeter sources seen at high redshift are similar in many ways to the ultraluminous infrared galaxies seen in the local universe (Ivison et al. 1998; Blain et al. 1999).
At a distance of only 19 Mpc ( km s-1 Mpc-1), the Antennae system (NGC 4038/39, Arp 244) is the closest example of a major merger between two gas-rich spiral galaxies. Thus, the Antennae provide us with a unique opportunity to study the internal structure of a merger in progress. It has an infrared luminosity of L⊙, sufficient for it to be classified as a luminous infrared galaxy (Sanders & Mirabel 1996). Early CO observations identified three large concentrations of molecular gas, one in each of the two nuclei and a third, more massive concentration in an intermediate region dubbed the “overlap region” (Stanford et al. 1990), while the total molecular gas content of this system has been estimated to be M⊙ (Gao et al. 1998). Recent 850 m continuum data also show emission from the two nuclei and the overlap region (Haas et al. 2000). Observations with the Hubble Space Telescope have identified a population of hundreds of compact, luminous star clusters, which are likely the young counterparts of present-day globular clusters (Whitmore & Schweizer 1995; Whitmore et al. 1999). These star clusters have masses in the range of to M⊙ and follow a power-law mass spectrum (Zhang & Fall 1999). Recent observations with ISO in the mid-infrared have identified an extremely luminous region of massive star formation that is almost completely obscured at optical wavelengths (Vigroux et al. 1996). This compact region is so luminous that it accounts for 15% of the 15 m flux of the entire system (Mirabel et al. 1998). In fact, the Antennae is the only nearby interacting system in which the most luminous mid-infrared region is not one of the two nuclei (Xu et al. 2000).
Since stars form from molecular gas, determining the physical properties and kinematics of the molecular gas in merger systems is important for understanding how star formation is triggered by galaxy mergers. In this paper, we present new, more sensitive, high-resolution CO observations of the Antennae made with the Caltech Millimeter Array. These observations cover most of the inner regions of the disks, which contain the luminous star clusters and bright mid-infrared sources. We compare these CO data to HST images from Whitmore et al. (1999) and to mid-infrared imaging and spectroscopic data from ISO (Vigroux et al. 1996; Mirabel et al. 1998). The observations and data reduction are presented in §2, while the properties of the most massive molecular complexes are discussed in §3. In §4, we focus on the mid-infrared properties of these massive complexes, and, in particular, on the origin of the steeply rising continuum emission, which is a unique feature of the most luminous region. The paper is summarized in §5. A more detailed discussion of the entire CO data set, including a comparison with the young star clusters identified with HST and an analysis of possible scenarios for star cluster formation in light of the new CO data, will be presented in a second paper (Paper II, Wilson et al., in preparation).
2. Observations and Data Reduction
Observations of three overlapping fields in the Antennae were obtained with the Caltech Millimeter Array between 1998 March and 1999 February. The primary beam of the array at this frequency is 66′′ and the field centers were separated by 40′′. The phase calibrator for these observations was 3C279 and the flux calibrator was 3C273, which was itself calibrated against Uranus and Neptune using the standard Caltech Millimeter Array database. Observations of each field were obtained in four configurations of the array, which resulted in a synthesized beam of or pc at the distance of the Antennae. Due to the low declination of the source, the typical single sideband system temperatures ranged between 1000 and 2000 K, which gave an rms noise in the maps of 0.055 Jy beam-1 (0.33 K) in a 5.2 km s-1 (2 MHz) channel.
The data were mapped and analyzed using the MIRIAD package (Sault, Teuben, & Wright 1995). Data for the three fields were combined with robust weighting to produce a single mosaic data cube and the data were cleaned using the task MOSSDI with a cutoff of 2 (0.11 Jy beam-1). Individual molecular complexes were identified from the data cube using the automatic clump identification algorithm CLFIND (Williams, de Geus, & Blitz 1994). This algorithm searches for peaks of emission within a contour map of the data, which it then follows down to lower intensity levels, and has the advantage of not assuming any specific clump profile (such as a gaussian profile). We used a contour level of 2 (0.11 Jy beam -1). The individual complexes were inspected by eye and, in several cases, two or more complexes that appeared to belong to a single structure rather than to be separate objects were merged by hand. The properties of the individual complexes were measured using the program CLSTATS (Williams, de Geus, & Blitz 1994). This program combines the data cube with the clump assignment cube produced by CLFIND to calculate individual statistics (such as total flux, velocity width, and radius). The data were corrected for the varying primary beam attenuation across the field by dividing by the gain image; regions of the mosaic map with a primary beam attenuation lower than 0.5 were masked. An integrated intensity map was created by summing the emission from all the complexes with velocity extents of at least 3 channels (15.6 km s-1). More details of the identification of the complexes and the data reduction will be given in Paper II.
3. Molecular Gas in the Antennae and the Properties of the Largest Complexes
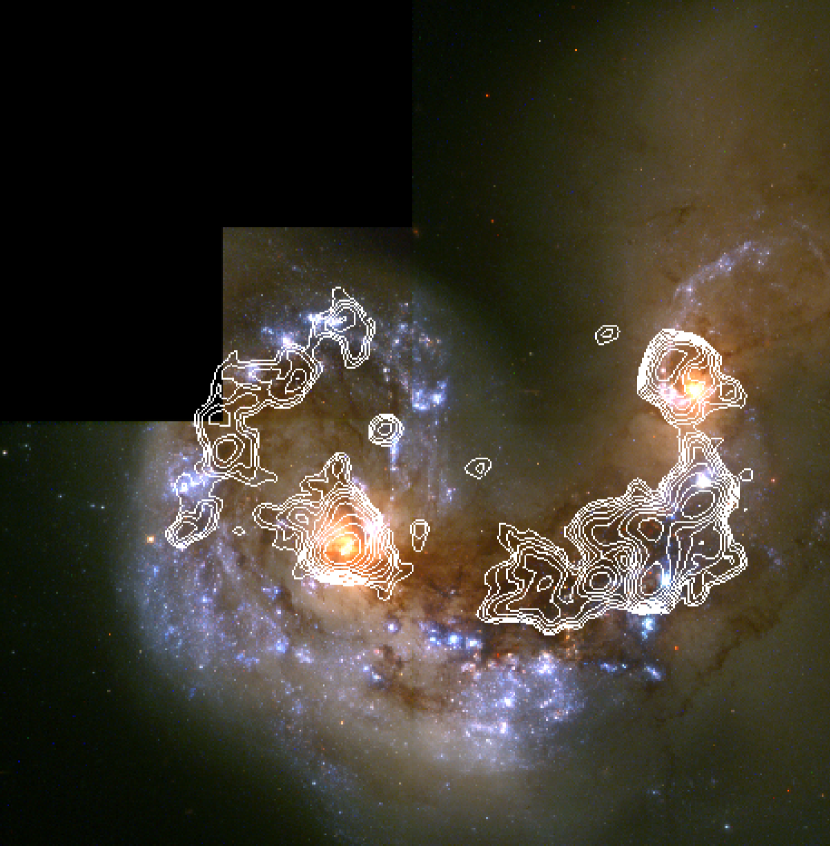
The CO integrated intensity map is shown in Figure 1 and is overlaid on the HST image from Whitmore et al. (1999) in Figure 2. The strongest CO peak is associated with the nucleus of NGC 4038 in the north. Significant CO emission is also associated with the nucleus of NGC 4039, but fully half the CO emission comes from a kpc region between the two nuclei. The strong emission in the southern half of this region corresponds to the “overlap region” identified by Stanford et al. (1990). Comparison with the map of Stanford et al. (1990) shows that our new map detects significantly more extended CO emission than the previous map; indeed, the entire northern half of the extended overlap region is not visible in the older maps. Because of our larger area coverage, we also detect significant CO emission associated with the blue arc of star formation located to the west of NGC 4038.
The total flux detected in our map is 910 Jy km s-1, compared to a total flux of 430 Jy km s-1 in the map of Stanford et al. (1990). Most of the increase in detected flux is due to the higher sensitivity of the new map (due to the larger number of telescopes and more sensitive receivers). In addition, a more compact configuration was included in these observations, which gives better sensitivity to structures on larger scales. Gao et al. (1998) have made an extensive single dish map of the Antennae, which detects five times more flux than Stanford et al. (1990). If all this flux were to lie within the area we have mapped, then we would have detected 40% of the single dish flux across our entire map. In a single 55′′ beam pointed (quite by chance) at the overlap region, Sanders & Mirabel (1985) measured an integrated CO intensity of 15.9 K km s-1. Adopting a CO-to-H2 conversion factor of H2 cm-2 (K km s-1)-1 (Strong et al. 1988) and including a factor of 1.36 to account for heavy elements, this intensity corresponds to M⊙ of molecular gas. In the same region of our map, we detect 470 Jy km s-1 for a total mass of M⊙. Thus, at least in the overlap region, we likely detect most of the molecular gas present. For the individual complexes discussed below, nearly all of the flux should be present in our map since they are much smaller than the spatial scale at which our interferometer data resolves out structures. The residual single dish flux must be more extended or at lower surface brightness levels than the emission in our map. The total flux detected in our map corresponds to a mass of M⊙ of molecular gas.
The physical properties of the seven largest molecular complexes seen in our map are given in Table 5 and their locations are identified in Figure 1. The molecular and virial masses were calculated from the CO flux, diameter, and velocity width using the equations given in Wilson & Scoville (1990). (One difference is that the diameter is measured from , where is the area of the cloud at the 2 contour level; the diameter was then deconvolved from the synthesized beam.) These seven complexes are significantly larger and more massive than typical giant molecular clouds seen in the Milky Way, which have masses in the range of to M⊙ (i.e. Sanders, Scoville, & Solomon 1985). This result is not too surprising, since our spatial resolution and sensitivity are insufficient to detect even the most massive Milky Way cloud at the distance of the Antennae. However, the complexes are also a factor of 5-10 times more massive than the most massive giant molecular associations seen in the grand-design spiral galaxy M51 ( M⊙, Rand & Kulkarni 1990), which has been observed with similar resolution and mass sensitivity. Because of their unusually large masses, we will refer to these objects as super-giant molecular complexes, or SGMCs. Note that SGMC4 and SGMC5 lie at the same location but at different velocities, and so are not visible as separate emission peaks in Figure 1. Cross-identification with previous work is given in Table 2. Most of the complexes have molecular masses which are comparable to or larger than their virial masses, which suggests that these complexes could be gravitationally bound. Only the nucleus of NGC 4039 has a molecular mass that is significantly smaller than its virial mass; however, since this complex is located in a galactic nucleus, there is likely to be a significant mass contribution by the stars in both the disk and the bulge, which will affect the kinematics of the molecular gas.
Approximately 600 of the 728 star clusters identified by Whitmore & Schweizer (1995), including 9 of the 12 very red clusters, lie within the region mapped in CO. Six of the very red star clusters lie within the CO contours of Figure 2, and four of these are associated with the very strong CO emission of the overlap region. Thus, the 6% of the area which contains the strongest CO emission contains 45% of the very red clusters. This correlation of the reddest clusters with the CO emission strongly supports the argument that the red color of these clusters comes from high extinction (Whitmore & Schweizer 1995).
4. What is the Origin of the Strong Mid-Infrared Emission in the Antennae?
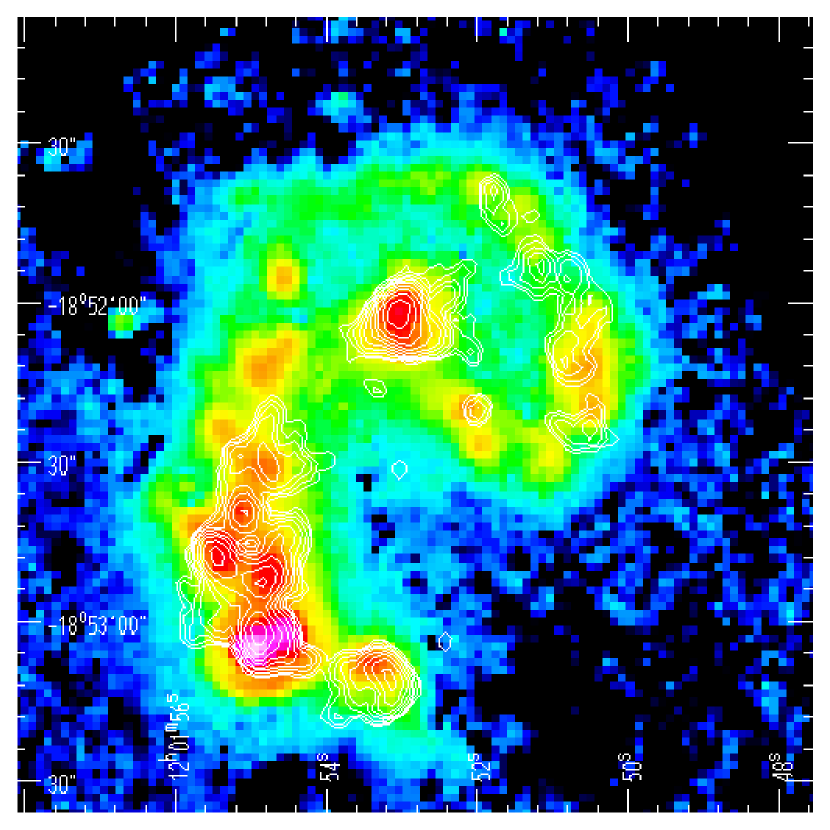
Comparing our new high-resolution CO map with similarly high-resolution mid-infrared data from ISO reveals intriguing similarities and differences among the super-giant molecular complexes in the overlap region of the Antennae. Figure 3 shows the CO contours superimposed on the 15 m (12-18 m) ISO image with 4.5′′ resolution from Mirabel et al. (1998). As noted by Vigroux et al. (1996), the strongest mid-infrared peak is not associated with either of the two nuclei, but instead lies in the overlap region. Figure 3 shows that this strong mid-infrared peak is associated with two super-giant molecular complexes (SGMC4 and SGMC5). The other two mid-infrared peaks in the overlap region are associated with SGMC1 and SGMC2, respectively. In general, there is an excellent correspondence between the strongest CO peaks and the strongest mid-infrared peaks.
Differences between the complexes begin to be apparent when we examine their mid-infrared spectra. Figure 4 shows the mid-infrared spectra from 5 m to 17 m at the positions of each of the seven SGMCs. While all the SGMCs in the overlap region show strong emission lines of both [NeIII] (15.5 m) and [NeII] (12.8 m), the mid-infrared spectra of the two nuclei have at most weak [NeIII] emission (see also Vigroux et al. 1996; Mirabel et al. 1998; Vigroux 1999). The strong [NeIII] lines and large [NeIII]/[NeII] ratios111We note that, given the spectral resolution of the ISOCAM CVF, the [NeII] line is blended with the weak 12.7 m Unidentified Infrared Band (UIB). However, since we are concerned with the variation of this ratio over the various peaks in the overlap region, we can make the assumption that the relative strengths of the UIB features are approximately invariant in the interstellar medium (see also Boulanger 1999; Uchida et al. 2000). Thus, when we state the [NeIII]/[NeII] ratio (Table 2), we are always referring to the blended [NeII] line. We expect the contamination by the 12.7 m UIB to result in an underestimate of the true [NeIII]/[NeII] ratio by no more than 20% (i.e. Uchida et al. 2000). throughout the overlap region (Table 2) indicate that all five molecular complexes in the overlap region contain embedded regions of massive star formation. The observed line ratios correspond to effective temperatures of K (Kunze et al. 1996) or O stars with masses of 40-60 M⊙ and main sequence lifetimes of Myr (Schaerer et al. 1996). This high effective temperature has also been confirmed by observations of the He I/Br ratio for the bright cluster in the SGMC4-5 region (Gilbert et al. 2000).
Although the relative strengths of the neon lines and the UIBs in the various molecular complexes in the overlap region are quite similar to one another, there is a striking difference in the mid-infrared continuum emission between the different complexes. In particular, SGMC4-5 (and to some extent SGMC3) show strong continuum emission that rises towards longer wavelengths, while the continuum emission in SGMC1 and SGMC2 is essentially flat (Figure 4). The net effect of this rising spectrum is to increase the flux of SGMC4-5 seen in the broad-band 15 m filter (Figure 3), which gives it enhanced 15m/7m and 15m/CO ratios compared to the other two regions (Table 2). Thus, most of the high luminosity of this region seen in the 15 m image is due to the presence of this unusual continuum spectrum. A rising mid-infrared continuum spectrum, such as is seen in SGMC4-5, can be produced by a population of very small dust grains that are heated to quite high temperatures (of the order of 100 K) due to their proximity to massive O stars. In the Milky Way, this rising continuum emission is seen to be closely confined to HII regions and photon-dominated regions; for example, in M17, the strong continuum emission is confined to a region roughly 1 pc in extent (Verstraete et al. 1996; Cesarsky et al. 1996). Thus, to have strong mid-infrared continuum emission requires the presence of very small dust grains within a few parsecs of the massive stars.
These observations of the overlap region of the Antennae present us with an interesting puzzle. The three bright mid-infrared peaks seen in Figure 3, which correspond to SGMC1, SGMC2, and SGMC4-5, contain similar masses of molecular gas, and their neon lines indicate that they contain similar populations of massive stars. Yet one region (SGMC4-5) contains strong and rising mid-infrared continuum emission, which indicates the presents of very warm and small dust grains, while the other two regions have much flatter mid-infrared spectra (Figure 4). Why does the SGMC4-5 region contain a population of warm dust grains which the other two, otherwise similar, regions lack? O stars are highly effective at modifying their immediate environment by means of their high luminosities and strong stellar winds. Models and observations of superbubbles produced by these strong stellar winds show that a single massive O star can drive a stellar wind bubble to a radius of 20 pc in about 1 Myr (Oey & Massey 1995). Thus, only younger regions would likely have dust grains located close enough to the massive stars to produce a rising mid-infrared continuum spectrum. Alternatively, for an older region to produce such a strong mid-infrared continuum, it would need its supply of dust grains replenished by some mechanism, perhaps infall of new material or an encounter with a second molecular cloud. Finally, given the relatively large spatial scales (500 pc) of the regions we are studying, it is also possible that a single SGMC region contains a number of star formation sites of various ages, and we are observing dilution effects in our mid-infrared spectra. For example, in a region with a large number of extremely young sites of massive star formation, the steep mid-infrared continuum spectrum from these regions may dominate over the flat spectra of the older regions to produce a spectrum similar to that seen in the SGMC4-5 region.
The information that is available on the relative ages of the stars associated with these molecular complexes is inconclusive. The [NeIII]/[NeII] line ratios indicate similar populations of O stars in all the regions (Table 2). Since these massive O stars only live for Myr (Schaerer et al. 1996), these observations place an upper limit on the age of the regions. (However, if these regions are undergoing continuous star formation, they could be considerably older. In this case, the age would refer to the most recent episode of star formation.) The HST data of Whitmore et al. (1999) show very compact H bubbles in the vicinity of SGMC1, which suggests that this complex is relatively young. Neither SGMC2 nor SGMC4-5 appear to have significant H emission. This lack of H emission could mean that these regions are so young that the star formation is still deeply cocooned and hence invisible at optical wavelengths. However, all the regions do show Br emission (Fischer et al. 1996). Using instantaneous starburst models, the intrinsic -band brightness, and the Br flux, Gilbert et al. (2000) estimate the age of the brightest star cluster near SGMC4-5 to be Myr. Similarly, Mengel et al. (2000) have estimated the ages of the two star clusters near SGMC4-5 and SGMC3 using the Br and 12CO(2-0) equivalent widths. They estimate ages of 4-6 Myr, and do not find any significant differences between these two clusters. These age estimates suggest that we are not viewing SGMC4-5 at a special time in their evolution, when massive star formation has been going on for less than a million years. However, given that even the near-infrared observations measure the average emission from an area of pc, it is possible that SGMC4-5 contains a mix of extremely young clusters (1 Myr), which could contribute the rising mid-infrared continuum spectrum, and somewhat older regions ( Myr), which could dominate the near-infrared emission lines.
The CO data for the SGMC3-5 region suggest that the second scenario, in which older ( Myr!) star formation sites are replenished with dust grains from unprocessed material, deserves a second look. One striking aspect of this region is that it is the only region of strong CO emission (besides the nucleus of NGC 4039; see Paper II) that is clearly made up of more than a single molecular complex. In fact, our analysis of this region suggests that there are three large, gravitationally bound molecular complexes projected within an area of just 1 kpc2 (Table 5). Figure 5 illustrates this in more detail; it is clear that each complex is well-separated from the other two in velocity but is close to overlapping spatially. This close proximity of three massive complexes suggests that cloud collisions could be the means of replenishing the small dust grains and maintaining the rising mid-infrared continuum spectrum in this region of the Antennae. In this picture, two or more massive complexes could collide and form a first generation of O stars in the shocked boundary layers. The winds of the O stars would quickly remove the dust and gas (including the very small grains) from their immediate vicinity. However, the motions of the large amount of remaining material in the two complexes would continually feed fresh gas and dust into the sphere of influence of the O stars. Thus, the photon-dominated region around the O stars would remain out of equilibrium for much longer than would be the case for a static situation, and hence there would be a significant population of hot grains to produce the observed mid-infrared continuum emission over an extended period of time. An additional complementary effect can be the shattering of larger grains in grain-grain collisions in shocks with velocities of 100 to 150 km s-1 to form the smaller grains that we are seeing in the mid-infrared (Jones, Tielens, & Hollenbach 1996). Such shocks might be expected to produce near-infrared H2 emission lines; indeed, H2 emission has been seen in the vicinity of SGMC4-5, as well as within SGMC1 and SGMC2 (Fischer et al. 1996). However, high-resolution near-infrared spectra of the brightest star cluster in the SGMC4-5 region reveals almost pure ultraviolet fluorescence (Gilbert et al. 2000).
5. Conclusions
We have presented a new, high-resolution CO map of the inner region of the Antennae (NGC 4038/39) obtained with the Caltech Millimeter Array. These new data cover a larger area than previously published aperture synthesis maps (Stanford et al. 1990) and have considerably higher sensitivity and resolution as well.
(1) We detect twice as much flux in our new map as was seen in the original interferometric map by Stanford et al. (1990), and 40% of the total CO flux seen in the extended single dish map of Gao et al. (1998). Comparison with older single dish data suggests we may be detecting all of the flux in the key “overlap region”. These new data reveal that the overlap region is even larger than seen previously, at least kpc in size, and accounts for 50% of the molecular gas content of the inner disk of the Antennae. We also detect CO emission associated with a partial ring of star formation located to the west of NGC 4038.
(2) The seven most massive molecular gas complexes are unusually large, with masses in the range of M⊙. These super-giant molecular complexes (SGMCs) are a factor of 5-10 times more massive than the most massive giant molecular associations seen in the grand-design spiral galaxy M51 (Rand & Kulkarni 1990). Comparison of the CO map with the young star clusters identified by Whitmore & Schweizer (1995) shows that half of the extremely red clusters are located in the southern part of the overlap region. This high concentration of the red clusters towards the small fraction of the map containing the brightest CO emission provides strong support for the idea that the red color of the clusters is due to high extinction (Whitmore & Schweizer 1995).
(3) Comparison of the CO data with the ISO 15 m image shows that there is an excellent correlation between the CO emission and the 15 m emission, particularly in the brightest regions. The three brightest regions in the 15 m image all have similar masses of molecular gas, as well as similarly strong [NeIII]/[NeII] ratios, which indicate that all the regions are forming massive stars. However, the mid-infrared continuum spectrum is significantly different from one region to another; in particular, the brightest 15 m peak in the overlap region shows a strong and rising continuum spectrum, while the other two bright peaks in this region show a relatively flat continuum spectrum.
(4) We have presented two possible scenarios for explaining the presence of strong, rising mid-infrared continuum emission in the SGMC4-5 region. This continuum emission is produced by very small dust grains heated to high temperatures by their proximity to massive stars. These grains are expected to be removed from the neighborhood of the massive stars on relatively rapid timescales, most likely by the effect of the stellar winds. One possibility is that the SGMC4-5 molecular complexes contain a larger number of young sites of star formation than the other two, otherwise similar, large molecular complexes in the overlap region, sites so young that the O stars have not yet managed to blow away the dust. An alternative mechanism to produce the strong continuum emission would be to replenish the dust grains around older (few Myr) sites of star formation, perhaps via new material being brought in by an ongoing collision of two massive molecular complexes. Such collisions could fuel the strong mid-infrared emission by continuously bringing fresh supplies of very small dust grains into the sphere of influence of the massive stars that formed in the shocked boundary layer of the two clouds. Although there is some support for the collisional scenario in the kinematics and morphology of the CO emission in this region of the galaxy, it is impossible with the current data to rule out either scenario.
References
- (1)
- (2) Blain, A. W., Smail, I., Ivison, R. J. & Kneib, J.-P. 1999, MNRAS, 302, 632
- (3)
- (4) Boulanger, F. 1999, in Solid Interstellar Matter: The ISO Revolution, eds L. D’Hendecourt, C. Joblin, & A. Jones, in press
- (5)
- (6) Cesarsky, D., Lequeux, J., Abergel, A., Perault, M., Palazzi, E., Madden, S., & Tran, D. 1996, A&A, 315, L309
- (7)
- (8) Fischer, J. et al. 1996, A&A, 315, L97
- (9)
- (10) Gao, Y., Gruendl, R. A., Lo, K. Y., Lee, S.-W. & Hwang, C. Y. 1998, BAAS, 192, 6904
- (11)
- (12) Genzel, R. et al. 1998, ApJ, 498, 579
- (13)
- (14) Gilbert, A. M. et al. 2000, ApJ, 533, L57
- (15)
- (16) Haas, M., Klaas, U., Coulson, I., Thommes, E., & Xu, C. 2000, A&A, 356, L83
- (17)
- (18) Jones, A. P., Tielens, A. G. G. M., & Hollenbach, D. J. 1996, ApJ, 469, 740
- (19)
- (20) Ivison, R. J., Smail, I., Le Borgne, J.-F., Blain, A. W., Kneib, J.-P., Bezecourt, J., Kerr, T. H. & Davies, J. K. 1998, MNRAS, 298, 583
- (21)
- (22) Hummel, E., & van der Hulst, J. M. 1986, A&A, 155, 151
- (23)
- (24) Kunze, D. et al. 1996, A&A, 315, L101
- (25)
- (26) Laurent, O., et al. 2000, A&A, submitted
- (27)
- (28) Lutz, D., Spoon, H. W. W., Rigopoulou, D., Moorwood, A. F. M., & Genzel, R. 1998, ApJ, 505, L103
- (29)
- (30) Mengel, S., Lehnert, M. D., Thatte, N., & Genzel, R. 2000, in “Massive Stellar Clusters”, eds A. Lancon and C. M. Boily, in press
- (31)
- (32) Mirabel, I. F. et al. 1998, A&A, 333, L1
- (33)
- (34) Oey, M. S. & Massey, P. 1995, ApJ, 452, 210
- (35)
- (36) Rand, R. J., & Kulkarni, S. R., 1990, ApJ, 349, L43
- (37)
- (38) Rubin, V. C., Ford, W. K., & D’Odorico, S. 1970, ApJ, 160, 801
- (39)
- (40) Sanders, D. B. & Mirabel, I. F. 1996, ARA&A, 34, 749
- (41)
- (42) Sanders, D. B., Scoville, N. Z. & Solomon, P. M. 1985, ApJ, 289, 373
- (43)
- (44) Sanders, D. B. et al. 1988, ApJ, 325, 74
- (45)
- (46) Sault, R. J., Teuben, P. J., & Wright, M. C. H. 1995, in ASP Conf. Ser. 77, Astronomical Data Analysis Software and Systems IV, ed. R. A. Shaw, H. E. Payne & J. J. E. Hayes (San Francisco: ASP), 433
- (47)
- (48) Schaerer, D., de Koter, A., Schmutz, W., & Maeder, A. 1996, A&A, 310, 837
- (49)
- (50) Soifer, B. T. et al. 1984, ApJ, 278, L71
- (51)
- (52) Stanford, S. A., Sargent, A. I., Sanders, D. B. & Scoville, N. Z. 1990, ApJ, 349, 492
- (53)
- (54) Strong, A. W. et al. 1988, A&A, 207, 1
- (55)
- (56) Uchida, K. I., Sellgren, K., Werner, M. W., & Houdashelt, M. L. 2000, ApJ, 530, 817
- (57)
- (58) Verstraete, L., Puget, J. L., Falgarone, E., Drapatz, S., Wright, C. M., and Timmermann, R. 1996, A&A, 315, L337
- (59)
- (60) Vigroux, L. 1999, in XVIIth Moriond Astrophysics Meeting: Extragalactic Astronomy in the Infrared, eds. G. A. Mamon, Trinh Xuan Thuan, & J. Tran Thanh Van, 63.
- (61)
- (62) Vigroux, L. et al. 1996, A&A, 315, L93
- (63)
- (64) Whitmore, B. C. & Schweizer, F. 1995, AJ, 109, 960
- (65)
- (66) Whitmore, B. C., Zhang, Q., Leitherer, C., Fall, S. M., Schweizer, F. & Miller, B. W. 1999, AJ, 118, 1551
- (67)
- (68) Williams, J. P., de Geus, E. J. & Blitz, L. 1994, ApJ, 428, 693
- (69)
- (70) Wilson C. D. & Scoville, N. 1990, ApJ, 363, 435
- (71)
- (72) Xu, C., Gao, Y., Mazzarella, J., Lu, Nanyao, Sulentic, J. W., & Domingue, D. L. 2000, ApJ, submitted
- (73)
- (74) Zhang, Q, & Fall, S. M. 1999, ApJ, 527, L81
- (75)


![[Uncaptioned image]](/html/astro-ph/0005208/assets/x6.png)
| ID | 7 maaMeasured from the ISOCAM CVF spectrum in a 6′′ pixel; units are mJy pixel-1. | 15 maaMeasured from the ISOCAM CVF spectrum in a 6′′ pixel; units are mJy pixel-1. | bbPeak CO intensity in a single beam; units are Jy km s-1 beam-1. | 15m/7m | 15m/CO | [NeIII]/[NeII]acacfootnotemark: | Other IDsddCross-identification with previous work at optical, radio and infrared wavelengths. The letter and number designations refer to Rubin et al. (1970), Hummel & van der Hulst (1986), Stanford et al. (1990), and Vigroux et al. (1996), respectively. |
|---|---|---|---|---|---|---|---|
| NGC4038 | 28 | 38 | 91 | 1.4 | 0.42 | 0.1 | JK;7 |
| NGC4039 | 15 | 24 | 32 | 1.6 | 0.75 | 0.5 | A;1 |
| SGMC1 | 27 | 43 | 38 | 1.6 | 1.1 | 1 | C;4;E;CD |
| SGMC2 | 29 | 39 | 38 | 1.3 | 1.0 | 1 | none;3;W;B |
| SGMC3 | 21 | 83 | 16 | 4.0 | 5.2 | 2 | B;2;S;A |
| SGMC4,5eeSGMC4 and SGMC5 are combined in this table because they are only separated in velocity, which the infrared data cannot distinguish. | 28 | 150 | 51 | 5.4 | 2.9 | 4 | none;2;S;A |