Multi-wavelength visibility measurements of the red giant R Doradus
Abstract
We present visibility measurements of the nearby Mira-like star R Doradus taken over a wide range of wavelengths (650–990 nm). The observations were made using MAPPIT (Masked APerture-Plane Interference Telescope), an interferometer operating at the 3.9-m Anglo-Australian Telescope. We used a slit to mask the telescope aperture and prism to disperse the interference pattern in wavelength. We observed in R Dor strong decreases in visibility within the TiO absorption bands. The results are in general agreement with theory but differ in detail, suggesting that further work is needed to refine the theoretical models.
Keywords: interferometry, aperture masking, angular diameters, visibilities, R Doradus, stellar models
1 The MAPPIT Interferometer
MAPPIT (Masked APerture-Plane Interference Telescope) is an interferometer operating at the 3.9-m Anglo-Australian Telescope[1, 2, 3]. Its main features are a one-dimensional aperture mask (either a slit or an array of holes) and a prism to disperse the fringes in wavelength. This allows us to record interference fringes simultaneously over a wide wavelength range. Here we report multi-wavelength visibility measurement of the Mira-like red giant star R Doradus, which we compare with our recent theoretical work on the wavelength dependence of angular diameters of M giants[4, 5].
MAPPIT is located in the west coudé room of the AAT at Siding Spring Observatory, Australia. It consists of a series of optical components mounted on two parallel optical rails (see Fig. 1). For this experiment, the aperture mask was a slit placed diametrically across the pupil (right panel of Fig. 1). The wavelength region was selected by adjusting the second flat mirror, to centre the desired part of the spectrum on the detector. The parameters of the configuration are given in Table 1.


| Pupil diameter at aperture mask | 25.4 mm |
|---|---|
| Projected slit width | 97 mm |
| Projected maximum baseline | 3.89 m |
| Position angles | 10.4∘ and 135∘ |
| Wavelength range | 652 to 987 nm |
| Wavelength resolution | 5 to 12 nm |
| Detector pixel size | 19 m |
| Detector angular scale | 10.5 mas/pixel |
| CCD window — | |
| spatial direction: | 400 pixels (not binned) |
| wavelength direction: | 220 pixels, binned by a factor of 5 to 44 pixels |
| Exposure time | 10 ms (at 650 ms intervals) |
Most previous aperture-masking observations have used a CCD with full on-chip binning and no shutter, to collapse the interference pattern along the fringes and produce a high-speed one-dimensional readout[6, 7, 8, 9]. However, the curved fringes in a broadband wavelength-dispersed system require full two-dimensional detection. For previous observations with MAPPIT in wavelength-dispersed mode, we therefore used the IPCS (Image Photon Counting System)[1, 2]. The IPCS had fast two-dimensional readout with no readout noise but, like other photon counting systems, it had poor red sensitivity and suffered from non-linear effects at high count rates.
The observations reported here used a CCD operating as a conventional two-dimensional detector. Only a portion of the CCD was read out and some on-chip binning was used (see Table 1), to give faster readout and reduce the effect of readout noise. A shutter was used to set the exposure time to 10 ms, with one frame being recorded every 650 ms. The wavelength resolution ranged from about 5 nm per binned pixel at 650 nm to about 11 nm per binned pixel at 950 nm.
2 Observations
R Doradus (HR 1492; ; spectral type M8 IIIe) is a nearby Mira-like star which alternates on a timescale of several years between two pulsation modes having periods of 332 and 175 days[10]. Wing[11] has pointed out that R Dor has the brightest visual magnitude of any M8 star and that it rivals Ori as the brightest star in the night sky at the and infrared bands. He predicted that it should have one of the largest angular diameters of any star.
We have previously used aperture-masking to observe R Dor at 1.25 m and found it to have an angular diameter of 575 mas[9]. This exceeds that of Ori (44 mas[12]) and confirms Wing’s prediction. We detected non-zero closure phases at 855 nm, suggesting an asymmetric brightness distribution, but limited position-angle coverage prevented image reconstruction. We have presented visibility profiles for R Dor at 820/18 nm (pseudo-continuum) and 850/20 nm (TiO) which showed that the TiO band diameter was about 20% greater than the pseudo-continuum diameter[13]. We also found that a uniform disk gave a poor fit to the observations.
The observations of R Dor reported here were made on 19 December 1996 (JD 2450439). The pulsation phase of the star at that time was approximately 0.7 in its 332-day cycle, although the irregularity of the pulsations makes this value uncertain[10]. Our observations consisted of a series of 10-ms exposures of R Dor, interspersed with similar observations of a calibrator star ( Ret; HR 1264; ; M4 III) and of blank sky. The observing sequence was: calibrator (300 frames), sky (100 frames), R Dor (300 frames), sky (100 frames). Two such sequences were recorded with the aperture mask at a position angle on the sky of 10.4∘ (measured from North through East), followed by two more sequences at position angle 135∘. We therefore have four separate data sets on R Dor, two at each position angle, acquired over about one hour.
3 Data Processing
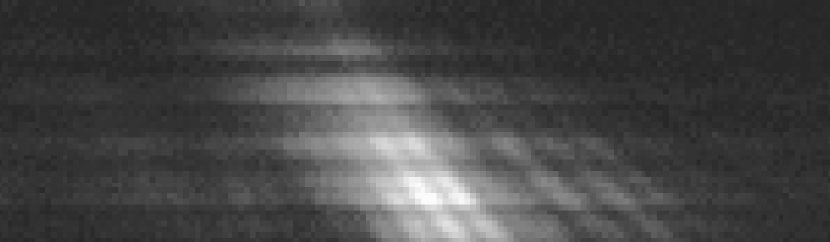
The data were reduced using AIPS++ (version 0.9). The raw data consisted of a stack of 10-ms images, each 400 44 pixels (spatial position wavelength channel). Figure 2 shows a single frame of data for R Dor. Wavelength increases downwards in 44 channels, which are not equal in bandwidth because dispersion in the glass prism is greater in the blue than the red. The dark horizontal bands are TiO absorption features in the spectrum of the star, and speckle patterns can be seen across the image. The prominent fringes result from inteference between the two halves of the slit aperture (see the right panel of Fig. 1). The fringes are diagonal rather than vertical because of dispersion in the atmosphere and the optics, which make optical path differences vary with wavelength.
The sky frames were averaged to a produce CCD bias frame, which was subtracted from each source and calibrator image. The spatial power spectrum of each frame was calculated row by row for the 44 wavelength channels using the Fast Fourier Transform, with the images having first being padded with zeroes in the spatial direction to 1600 pixels and smoothed with a Hamming window.
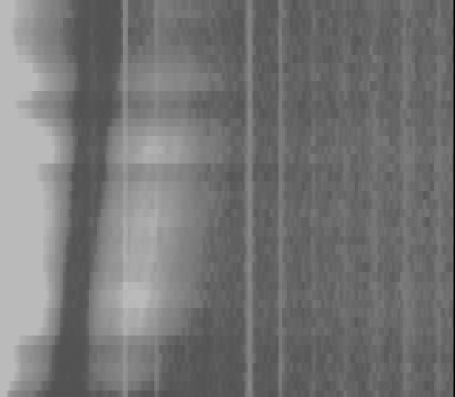
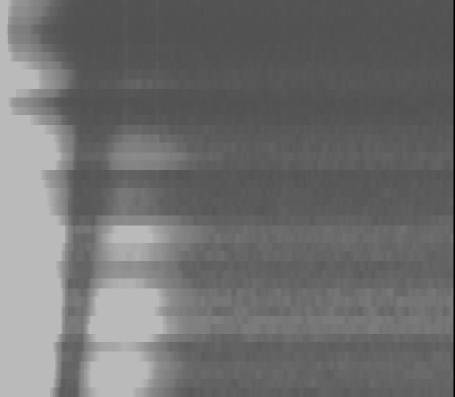
Figure 3 shows power spectra for the calibrator star and R Dor, each averaged over 100 frames. Power can be seen out to the diffraction limit, with dark nearly-vertical bands indicating spatial frequencies not sampled because of the telescope’s central obstruction. TiO absorption features in the stellar spectrum are visible as dark horizontal bands. The thin bright vertical stripes in the calibrator data (and actually present but less obvious in R Dor) are due to pattern noise in the CCD electronics. The pattern noise varied in intensity during the observations but remained at fixed spatial frequencies, which made it simple to ignore those regions of the power spectra.
The power spectra had a background level due to biases from photon noise and CCD readout electronics. This was corrected by subtracting a slowly varying function (a cosine curve) that was fitted to regions devoid of stellar power, namely frequencies within the central obstruction gap and beyond the telescope diffraction limit. The central obstruction therefore turned out to be useful – it is an advantage of masked-aperture interferometry over full-aperture speckle that some regions of the power spectrum do not contain stellar signal and are therefore available to measure detector bias.
The next step was to turn the power estimates into visibilities, which we did by dividing the power in each wavelength channel by the number of photons in that channel. We then extracted the visibility as a function of wavelength channel at two spatial frequencies, and rad-1, chosen to avoid the central obstruction and the CCD pattern noise. The visibility in each wavelength channel was averaged over a range of spatial frequencies having width rad-1.
Note that the baseline corresponding to a given spatial frequency is proportional to wavelength. Over the range 650–950 nm, spatial frequency corresponds to baselines 0.63–0.92 m, while corresponds to 1.99–2.91 m.


The results for both calibrator and R Dor are shown in Fig. 4. The squared visibilities (upper panels) have not yet been corrected for the atmospheric transfer function. For each star, the upper four curves correspond to while the lower curves correspond to (two observations at two position angles – see Sec. 2). The lower panels show the stellar spectra (not yet corrected for the CCD response function), which indicate the positions of the TiO absorption bands.
A number of features can be seen in Fig. 4. The offsets between the four curves at each spatial frequency are due to variations in the seeing. In both stars, the visibilities at drop steeply towards the blue, presumably due to wavelength dependence of the atmospheric transfer function. The visibilities at , on the other hand, show little evidence of such a trend.
The purpose of these observations was to measure the variation of visibility with wavelength due to the structure of the star’s atmosphere. In R Dor we certainly see strong variations which coincide with absorption features in the stellar spectrum. In the case of the calibrator ( Ret; spectral type M4 III), the TiO bands are present in the spectrum but weaker and we do not expect them to be accompanied by significant changes in visibility[14]. This seems to be the case, although we do see small drops in visibiity near wavelength channels 12, 19 and 38. These probably indicate residual systematic effects arising from inaccurate background subtraction.
The strong visibility decreases shown by R Dor in the TiO bands, and the lack of similar variations for Ret, gives us confidence that these variations are intrinsic to R Dor. There is also a clear consistency in the change in visibility from observation to observation and between the two spatial frequencies.


The visibilities for R Dor were calibrated using those of the calibrator star, to remove any instrumental and atmospheric effects that were common to both. Note that we expect the calibrator star Ret to be slightly resolved. This star has no measured angular diameter, but Ochsenbein et al. estimated a diameter of 11 mas based on its spectral type[15], while the calibration of Di Benedetto gives 7.5 mas[16]. We have adopted an intermediate value of 9.25 mas, which we used to correct the measured visibility spectra. We then calibrated each of the four R Dor observations by dividing the visibilities by those of the corresponding calibrator observations. The results are shown in Fig. 5, where the horizontal axis has now been converted to wavelength and the spectrum of the star has been approximately corrected for the quantum efficiency curve of the CCD.
Note that even after calibration, there remained systematic offsets up to about 10% between the four visibility curves. There was no obvious dependence on position angle, such as would arise from a non-circular stellar disk, so we attribute these offsets to residual effects of seeing. Since we are primarily interested in the variation of visibility with wavelength, these offsets have been removed in Fig. 5 by normalizing so that the average value at in wavelength channels 1 through 34 is the same for all four observations. Note that the measurements at spatial frequency become noisy at the blue end due to the low visibility and low photon flux.
4 Comparison with stellar models
It has been pointed out in the literature that improvements in atmospheric models for M giants requires measurements of stellar radii over a wide range of wavelengths [17, 18]. The visibility curves in Fig. 5 represent the first multi-wavelength visibility measurements of a red giant star. We have compared our observations of R Dor with the M-giant models by Bessell, Brett, Hofmann, Scholz and Wood[19, 20, 21, 22]. Note that although most of their dynamic models were originally developed for Cet, they are representative of typical M-type Miras and, in some cases, have been used in previous studies for these types of stars.
We find agreement in the general features, with clear drops in visibility within the TiO absorption bands. However, although some models match the visibility observations in some regions, none match across the whole spectrum. Also, most of the models overpredict the ratio between visibility amplitudes at spatial frequencies and . The static 1M⊙ models, in particular, did not fit our observations well.
Figs. 6 and 7 show our observations superimposed on visibility spectra calculated for two Mira models: a 1M⊙ star pulsating in the first overtone and a 1.2M⊙ star in the fundamental mode. The model calculations are described in full by Jacob et al[5]. The model data were smoothed to simulate observing with a filter of 10 nm FWHM, while the spectral resolution of the observations varies from 5 to 12 nm (see Sec. 1). The radius of each model was adjusted until the visibilities at were approximately aligned. The corresponding angular diameters for the models are given in the figure captions.


The overtone-mode 1M⊙ model (Fig. 6) does not fit the observations very well, depsite the fact that it was chosen by Jacob et al.[5] because it had parameters close to those of R Dor. The predicted variation in visibility with wavelength is too small, especially at spatial frequency . The model also predicts an increase in visibility within the 710-nm TiO band that is not observed (this extreme limb darkening effect is discussed by Jacob et al.[5]). Other overtone-mode 1M⊙ models at other phases also give poor fits to the observations.
The fundamental-mode 1.2M⊙ model at a pulsation phase of 0.5 (Fig. 7) gives a much better fit, reproducing many of the features in the lower () visibility curve. Visibility variations at are present in the model, although still less pronounced than in the observations. Note that the same model at maximum phase is a poor fit to the observations.
In summary, the 1.2M⊙ M-series models (and 1M⊙ D models) appear to be the best fits to our observations. Both these models pulsate in the fundamental mode. The first-overtone-mode models (E series) do not fit well, perhaps because they are at the wrong pulsation phase (1.0, 1.1 & 1.21).
5 Conclusion
We have presented multi-wavelength visibility observations of R Dor and compared them with theoretical models. We find that fundamental-mode 1M⊙ and 1.2M⊙ Mira models provide the best fits to our observations. First overtone 1M⊙ Mira models and static models do not fit our observations well. Therefore, if R Dor does pulsate in the first overtone mode (as Bedding et al.[10] suggest) then the first-overtone models will need to be extended to other parameters and phases, and/or to be refined to accommodate our results.
Finally, we note that there is still uncertainty as to whether the pulsation mode of Miras is the fundamental or the first overtone. Observed line velocities are too large for first-overtone pulsation, but angular diameters are too large for fundamental-mode pulsation. To resolve this, it has been suggested that scattering, e.g., by molecules or dust, may cause angular diameter measurements to over-estimate the true stellar size[23]. Multi-wavelength observations like those presented here should be able to place constraints on the amount of scattering that can be present.
ACKNOWLEDGMENTS
We thank the staff of the Anglo-Australian Observatory for their invaluable support. The development of MAPPIT was supported by a grant under the CSIRO Collaborative Program in Information Technology, and by funds from the University of Sydney Research Grants Scheme and the Australian Research Council. CAH is grateful to the Royal Society for financial support.
References
- [1] T. R. Bedding, MAPPIT: Optical Interferometry with the Anglo-Australian Telescope. PhD thesis, School of Physics, University of Sydney, 1992.
- [2] T. R. Bedding, J. G. Robertson, and R. G. Marson, “An optical interferometer with wavelength dispersion,” A&A 290, p. 340, 1994.
- [3] R. G. Marson, Analysis Techniques for Optical Interferometry: Theory and Practice. PhD thesis, School of Physics, University of Sydney, 1997.
- [4] A. P. Jacob, High angular resolution studies of red giant stars. MSc thesis, School of Physics, University of Sydney, 2000.
- [5] A. P. Jacob, T. R. Bedding, J. G. Robertson, and M. Scholz, “Wavelength dependence of angular diameters of M giants: an observational perspective,” MNRAS 312, p. 733, 2000.
- [6] D. F. Buscher, C. A. Haniff, J. E. Baldwin, and P. J. Warner, “Detection of a bright feature on the surface of Betelgeuse,” MNRAS 245, p. 7p, 1990.
- [7] R. W. Wilson, J. E. Baldwin, D. F. Buscher, and P. J. Warner, “High-resolution imaging of Betelgeuse and Mira,” MNRAS 257, p. 369, 1992.
- [8] P. G. Tuthill, C. A. Haniff, and J. E. Baldwin, “Hotspots on late-type supergiants,” MNRAS 285, p. 529, 1997.
- [9] T. R. Bedding, A. A. Zijlstra, O. von der Lühe, J. G. Robertson, R. G. Marson, J. R. Barton, and B. S. Carter, “The angular diameter of R Doradus: a nearby Mira-like star,” MNRAS 286, p. 957, 1997.
- [10] T. R. Bedding, A. A. Zijlstra, A. Jones, and G. Foster, “Mode switching in the nearby Mira-like variable R Doradus,” MNRAS 301, p. 1073, 1998.
- [11] R. F. Wing, “The spectral type and infrared brightness of R Doradus,” PASP 83, p. 301, 1971.
- [12] H. M. Dyck, J. A. Benson, S. T. Ridgway, and D. J. Dixon, “The infrared angular diameter of Orionis,” AJ 104, p. 1982, 1992.
- [13] A. P. Jacob, T. R. Bedding, J. G. Robertson, R. G. Marson, J. R. Barton, and C. A. Haniff, “Wavelength-dependent stellar diameters using MAPPIT,” in Proc. IAU Symp. 189, Fundamental Stellar Properties: The Interaction between Observation and Theory (Poster Proceedings), T. R. Bedding, ed., p. 10, Sydney: School of Physics, University of Sydney, 1997.
- [14] K. H. Hofmann and M. Scholz, “Limb-darkening and radii of non-Mira M giant models,” A&A 335, p. 637, 1998.
- [15] F. Ochsenbein and J. L. Halbwachs, “A list of stars with large expected angular diameters,” A&AS 47, p. 523, 1982.
- [16] G. P. Di Benedetto, “Empirical effective temperatures and angular diameters of stars cooler than the Sun,” A&A 270, p. 315, 1993.
- [17] M. Scholz, “Properties and spectra of extended static model photospheres of M giants,” A&A 145, p. 251, 1985.
- [18] M. S. Bessell, J. M. Brett, M. Scholz, and P. R. Wood, “The effects of photospheric extension upon the spectra of M-type Mira variables,” A&A 213, p. 209, 1989.
- [19] M. S. Bessell, J. M. Brett, M. Scholz, and P. R. Wood, “Colors of extended static model photospheres of M giants,” A&AS 77, p. 1, 1989. Erratum: 87, 621.
- [20] M. S. Bessell, J. M. Brett, M. Scholz, and P. R. Wood, “Colors and stratifications of extended static model photospheres of M stars located on the FGB, AGB and supergiant branch,” A&AS 89, p. 335, 1991.
- [21] M. S. Bessell, M. Scholz, and P. R. Wood, “Phase and cycle dependence of the photospheric structure and observable properties of Mira variables,” A&A 307, p. 481, 1996.
- [22] K. H. Hofmann, M. Scholz, and P. R. Wood, “Limb-darkening and radii of M-type Mira models,” A&A 339, p. 846, 1998.
- [23] G. Perrin, V. Coudé Du Foresto, S. T. Ridgway, B. Mennesson, C. Ruilier, J. M. Mariotti, W. A. Traub, and M. G. Lacasse, “Interferometric observations of R Leonis in the K band. First direct detection of the photospheric pulsation and study of the atmospheric intensity distribution,” A&A 345, p. 221, 1999.