ASCA Observations of NLS1s
Abstract
The study of NLS1s using ASCA has many advantages. A representative sample can be studied; to date, observations of more than 30 NLS1s have been made. ASCA observations are conducted contiguously, so their X-ray variability properties can be studied systematically. ASCA detectors have a broad band pass and moderate energy resolution, properties which allow their complex X-ray spectrum to be deconvolved.
ASCA observations have revealed that a soft excess extending up to 1 keV is frequently found in the X-ray spectra from NLS1s. The hard X-ray photon index has been shown to be systematically steeper than in Seyfert 1 galaxies with broad optical lines. NLS1s also exhibit larger amplitude variability than broad-line Seyferts of similar hard X-ray luminosity. On occasion, features in the soft X-ray band have been detected that appear to be specific to NLS1s; ionized iron lines have also been observed.
These results have been fundamental for building our current picture of the X-ray emission from NLS1s. Many of the properties can be explained if the specific accretion rate is larger in NLS1s than in Seyfert 1 galaxies with broad optical lines. NLS1s may exemplify an extreme state of an intrinsic physical parameter and therefore their study may lead to an enhanced understanding of AGN in general.
This proceedings contribution has two parts. First I describe and discuss some of the results obtained from a study of the X-ray variability in NLS1s using ASCA data (Leighly 1999ab). Then, I discuss the results from our HST observations of NLS1s that were first presented during this meeting (Leighly & Halpern 2000).
keywords:
galaxies: active — galaxies: individual (IRAS 132243809, 1H 0707495) — line: profiles – ultraviolet: galaxies – X-rays: galaxies1 Introduction
ASCA observations have proved to be instrumental in our understanding of Narrow-line Seyfert 1 galaxies (NLS1s). One of the most compelling first indications that NLS1s may be characterized by a high accretion rate came from the ASCA spectrum of RE 1034+39, reported by Pounds, Done & Osborne (1995). This spectrum revealed a strong soft excess component and a steep hard X-ray power law that seemed to be similar to the spectra of black hole candidates in the high state. While it is now quite clear that not all NLS1s have such spectra and indeed a range of strengths of the soft excess are seen (e.g. Leighly 1999b), and that perhaps comparison with the very high state seen in some Galactic X-ray emitting objects may be more appropriate, the result has been extremely important in the development of our understanding of these objects.
The results from the ASCA observations of NLS1s have now been reported in several places (e.g. Leighly 1999ab and references therein, see also Vaughn et al. these proceedings). Therefore, only part of this review will be devoted to a few results from the variability analysis of NLS1s and a very brief discussion of models and implications. In the second half, I present a preview of our work on the HST spectra from NLS1s (Leighly & Halpern 2000).
2 X-ray Variability of NLS1s
The X-ray variability in NLS1 ASCA observations is discussed in detail in Leighly 1999a. Because of the gaps in the light curves, the excess variance, also known as the fractional amplitude of variability, was used to quantify the variability. The results are shown in Fig. 1 (left). This figure shows that for a given X-ray luminosity, the amplitude of variability is consistently larger for NLS1s than for Seyfert 1 galaxies with broad optical lines (BLS1s). The uniform sampling and other properties of the ASCA data mean that the excess variance should be proportional to the inverse of a time scale of variability as , where is the slope of the variability power spectrum (see also Lawrence & Papadakis 1993). Thus, the simplest interpretation of Fig. 1 is that, if the hard X-ray luminosity is characteristic of the absolute mass accretion rate (i.e. the efficiency of conversion of accretion energy to radiation is the same in all objects), then NLS1s have a shorter variability time scale than do Seyfert 1s with broad optical lines (BLS1s). This would be equivalent to compressing a BLS1 light curve into an interval approximately 10 times shorter in NLS1s. The variability time scale may be characteristic of the black hole mass, simply from light-crossing time-scale arguments. Thus, the simplest explanation of this result is that NLS1s have a smaller black hole mass than BLS1s, and since they are no fainter than BLS1s, they must be accreting at a relatively larger accretion rate.
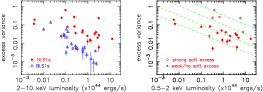
Closer examination indicates that the situation may not be as simple as the argument above would imply. Specifically, Fig. 1 shows a large spread in the excess variance values for NLS1s, much larger than the measurement error, but also much larger than the model-dependent systematic error in (excess variance) of 0.31–0.47 arising from the weakly nonstationary nature of a power spectrum (see Leighly 1999a for details). It is possible that the large spread is a consequence of the fact that the nature of the variability may not be homogeneous among NLS1s. Leighly 1999b report a correlation between the strength of the soft excess in the ASCA spectrum and the amplitude of the variability, and suggests that strong soft excess objects are characterized by flaring, high amplitude variability. In Fig. 1 (right), I separate the 6 objects identified as having strong soft excesses in Leighly 1999b and plot the excess variance as a function of 0.5–2.0 keV luminosity111Note that this is the inferred intrinsic luminosity and therefore there may be some model dependence associated with the modeling of the absorption.. When these six objects are excluded, the slope of the regression at is no longer biased by the scatter. The slope is still somewhat flatter than that expected if the time scale is proportional to the luminosity assuming that the slope of the variability power spectrum is (dashed lines)222Lawrence & Papadakis (1993) found that the slopes of the power spectra on 1-day time scales in a sample of objects are consistent with a constant value of 1.55..
What is the origin of the enhanced variance observed in NLS1s? As stated above, it may be simply a consequence of a smaller emission region characteristic of a smaller black hole. However, the light curves in some strong soft excess NLS1s are characterized by very high amplitude flares, and they could not be simply time-compressed versions of BLS1 light curves. A few other emission mechanisms have been suggested that instead would be equivalent to stretching the amplitude of flares in BLS1 lightcurves to produce the enhanced excess variance observed in NLS1s. Naturally, because of the scale invariant nature of the variability power spectrum (at least in the range of frequencies that the ASCA data probe) these general scenarios cannot be distinguished using the power spectrum or the excess variance.
-
•
Noting that the very large amplitude variability on short time scales implies a very high efficiency of conversion of accretion energy to radiation in the NLS1 PHL 1092, it has been proposed that beaming plays an important role in amplifying flares (Brandt et al. 1999). A specific scenario has been proposed: the emission regions are found on the very inner edge of the accretion disk, and the accretion disk is inclined at a very high angle with respect to the viewer so that Doppler effects cause amplification of flares (Boller et al. 1997). The results presented in the next section of this contribution cast significant doubt on an edge-on orientation.
-
•
It has recently been suggested that if NLS1s are accreting at a higher rate then the magnetic field energy, assumed to be in equipartion with gravitational potential energy, should be proportionally larger (Mineshige et al. 2000). Large amplitude flares may result from reconnection of this more powerful magnetic field.
-
•
It has been suggested that occultations by large optically-thick clouds may produce high-amplitude X-ray variability (Brandt et al. these proceedings). An observed steep in some objects seems to support this idea; however, there is no physical reason that luminous NLS1s should not have intrinsically steep , for example, if the X-ray emitting corona is weak or not present.
What are the implications of the high amplitude flaring? It has been previously suggested that high amplitude flaring is evidence that the variability is nonlinear (Green, McHardy & Done 1999; Boller et al. 1997). This conclusion is based on the assumption that the AGN variability is Gaussian, since in that case a very high variance compared with the mean can only be produced if the variability is nonlinear. In fact, non-Gaussian variability makes more sense for AGNs because our usual physical picture supposes that the light curve should be built up from the superposition of flares, and flares are inherently non-Gaussian. Linear, non-Gaussian variability can easily produce high values of excess variance. Non-Gaussian variability can be detected using a parameter related to the skew of the flux distribution, and evidence for non-Gaussianity was found in several of the NLS1s with the highest amplitude of variability. Demonstration that a light curve is nonlinear is a much harder problem; it is a very important one, however, because of the potentially strong constraints on emission processes and geometry. See Leighly 1999a for a detailed discussion. We find some evidence for nonlinear variability in the broad-line radio galaxy 3C 390.3 (Leighly & O’Brien 1997) in that quiescent periods occur before and after large flares, and this behavior cannot be reproduced by a linear non-Gaussian model. Evidence for nonlinear variability has been recently reported in Cyg X-1 (Timmer et al. 2000).
3 HST Observations of NLS1s IRAS 132243809 and 1H 0707495
In 1997, we reported the detection of an absorption feature near 1 keV in the ASCA spectra from three NLS1s, IRAS 132243809, 1H 0707495, and PG 1404+226 (Leighly et al. 1997). Absorption by ionized oxygen is common in the X-ray spectra from Seyfert 1 galaxies; however, if we are to interpret the 1 keV features in this way, the absorbing material must have highly relativistic velocities (0.2–0.6, depending on whether the features are interpreted as absorption lines or edges). Acceleration of ionized gas to these high velocities should be difficult; however, we noted that NLS1s exhibit suggestive similarities to a subclass of Broad-Absorption Line Quasars (BALQSOs), objects characterized by the signature of absorption by outflowing gas in the UV: both types of objects exhibit strong or extreme Fe II and weak [O III] emission, they often have red continua and strong infrared emission, and they are predominately radio-quiet (see Leighly et al. 1997 for details). An alternative explanation as absorption by highly ionized neon and iron has been presented by Nicastro et al. (1999). With luck, the origin of these features will be resolved by our upcoming Chandra observation of 1H 0707495.

Absorption in X-rays is often accompanied by absorption in the UV. To test our hypothesis that the X-ray absorption features are produced by relativistically outflowing gas, we applied for and were awarded HST STIS UV spectroscopic observations of IRAS 132243809 and 1H 0707495 (Leighly & Halpern 2000) and the results of the observations were presented for the first time at this meeting. The broad-band continuum spectra, corrected for Galactic reddening, are presented in Fig. 2 along with the average QSO spectrum compiled by Paul Francis. This figure shows that these NLS1s have continua as blue as the average QSO333IRAS 132243809 has been previously reported as having a red spectrum (Mas-Hesse et al. 1994). We find that our optical spectrum obtained from a 1 hour exposure on the CTIO 4 meter telescope is indeed rather red and does not join smoothly to the UV spectrum. We infer, from a difference in the spatial profile of the lines and continuum, that there is a strong, red galaxy component in the spectrum. In contrast, our 1H 0707495 optical spectrum is quite blue and joins smoothly onto the UV spectrum.. There is also no evidence for resonance-line absorption intrinsic to the object; all of the narrow absorption lines in the spectra originate in our Galaxy.
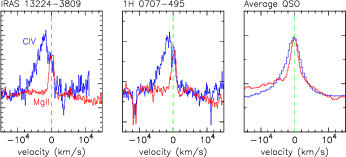
The emission line profiles are the most interesting feature of these spectra. The high-ionization lines, including Ly, N V, Si IV and C IV have a different profile than the low-ionization lines, including Mg II and H. The difference is illustrated in Fig. 3 which overlays the rescaled high-ionization line C IV and the low-ionization line Mg II profiles as a function of velocity444Note that the profile of the doublet Mg II2796, 2804 is consistent with that of H.. As is commonly found in AGN (e.g. Marziani et al. 1997), the average quasar high-ionization lines are broader and blueshifted relative to the low-ionization lines. The same trend is true in NLS1s, except the difference is more profound. The C IV FWHM is that of H, but it is significant that all of the extra width is on the blue side, whereas the red side lines up well with the low-ionization lines. Similar line profiles were reported from the NLS1 I Zw 1 (Laor et al. 1997).
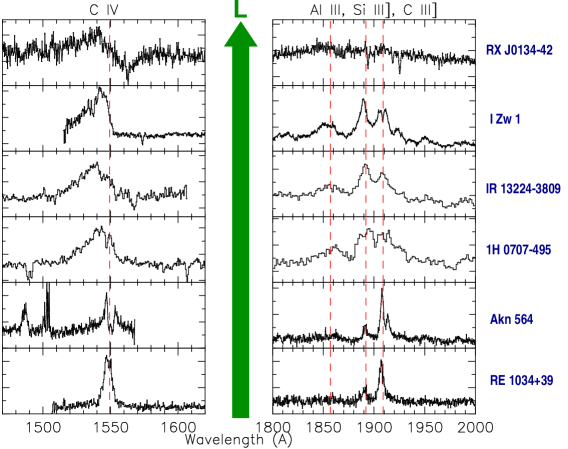
We also find evidence for emission from gas with very high densities. In Fig. 4 we plot the Al III–Si III]–C III] line region of our spectra, as well as archived spectra from several other NLS1s. We find a very high Si III] to C III] ratio in our spectra from IRAS 132243809 and 1H 0707495. The ions responsible for these lines are found under the same physical conditions; however, Si III] has a higher critical density than C III] and thus the ratio becomes large when the C III] emission has saturated. A correlation between this ratio and the width of H has been previously reported by Wills et al. 1999 (see also Wills, these proceedings). We note that these emission lines are relatively narrow and symmetric about their rest wavelengths and thus their profiles are more similar to those of the low-ionization lines.
Fig. 4 compares line profiles from 6 NLS1s. Three of the objects (I Zw 1, IRAS 132243809 and 1H 0707495) display blueshifted high-ionization lines and high Si III] to C III] ratios. RX J013442 also appears to have a blueshifted C IV line. However, the spectra from two lower luminosity NLS1s, Akn 564 and RE 1034+39, lack both of these attributes. We suspect that this reflects a dependence of the line properties on luminosity.
3.1 Disk-wind Models of AGN
We propose that the characteristic spectra we observe in the higher luminosity NLS1s can be naturally explained by a disk-wind model, as shown schematically in Fig. 5. It has long been known that it is not possible to produce all broad-line emission in gas characterized by one set of physical properties. Several multicomponent models, including disk-wind models, have been proposed; unfortunately, space limitations prohibit a through review here. What is new here is that our observations provide evidence that a disk-wind model is strongly favored over all other models. The fact that the red side of the high- and low-ionization lines line up suggests that the low-ionization lines and low-velocity cores of the high-ionization lines are produced in the same relatively low-velocity material (i.e. the accretion disk) while the high-velocity blue wings of the lines are produced in a wind. The disk is optically thick, and therefore, we see only emission from the wind accelerated toward us.
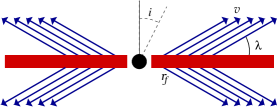
We are currently constructing a simple disk-wind model to test our assertion and Fig. 5 shows a schematic of the assumed geometry. We are following Murray & Chiang (1998) in general: we use a velocity law, often applied in star and CV winds, and we are using Cloudy to estimate the ionization structure. However, since we are interested in the emission produced in the wind in particular, we treat the radiative transfer numerically using the Sobolev approximation. A complementary and more sophisticated model being constructed by Proga, Stone and Kallman (2000; hereafter PSK) aims to determine the detailed dynamics of the wind. A definitive model has not yet been constructed; however, it is clear that there are potentially complex relationships between the radiative transfer, dynamics and ionization, and the results will quite possibly not conform to naive intuition when everything has been taken into account. Examples of two complications:
-
•
The wind is quite likely to be optically thick to scattering of the resonance lines, and thus radiative transfer will be strongly enhanced along directions in which the velocity gradient is high. This effect can strongly alter the observed line profiles for the high-ionization lines emerging from the wind, and prompts the use of the Sobolev approximation. The He II recombination lines are immune to this effect, however.
-
•
The acceleration of the wind is produced by resonance-line driving and thus the velocities attained depend intimately on the ionization structure of the gas. Specifically, there must be a mechanism for shielding the wind gas from the photoionizing X-ray source. This problem seems to have a natural solution: PSK find that there can be adequate “failed” wind material falling back onto the object to do this.
Our preliminary results and also the results presented by PSK are promising enough to conjecture that many of the features of the HST NLS1 spectra will be explainable using a disk-wind system. For example:
-
•
A disk-wind model coupled with a high accretion rate may naturally explain NLS1 spectra. PSK find that a primary condition on formation of the wind is that the wind-driving (UV) flux should be large compared with the wind-photoionizing (X-ray) flux. A high accretion rate predicts a spectrum strongly peaked in the extreme UV and therefore the UV to X-ray ratio will be large enough that a strong wind can be driven. If the accretion rate is high, then densities in the disk will be high, resulting in a large Si III] to C III] ratio. More material will be available to be blown from the nucleus, and since the black hole mass is relatively smaller, the wind is more likely to reach escape velocity. The wind may partially shield the accretion disk from the intense radiation field, thus permitting excitation but not causing ionization of the Fe+ ion, so that strong optical Fe II emission may be produced. This could explain the observed correlation between high-ionization blue asymmetry and optical Fe II (e.g. Marziani et al. 1996).
-
•
The large UV to X-ray ratio requirement found by PSK may explain why lower luminosity NLS1s do not show blue wings on their high-ionization lines. Quasars are known to have typically relatively larger UV to X-ray ratios than Seyferts (Wilkes et al. 1994), and thus gas in Seyferts may become too highly ionized to be accelerated to high velocities.
-
•
The observed line profiles will be affected by the observer’s viewing angle, and radiative transfer effects, as noted above, potentially affect the profiles as well in a non-obvious way. We interpret the fact that the red sides of the high- and low-ionizations lines line up as evidence that the low-ionization lines and the low-velocity core of the high-ionization lines are produced in the disk. However, for there to be only blue-side wind emission, either the observer’s viewing angle must be nearly face on, or the angle of the wind stream lines with respect to the disk must be large. It is quite possible that in reality the wind stream line angle and the radius at which the wind is launched are not independent of the accretion rate, and thus results from a self-consistent model would be potentially very interesting.
3.2 Summary and Further Implications
We have described how the particular UV spectra from higher luminosity NLS1s strongly suggests that the emission lines are produced in a disk-wind system. Further, we conjecture that, through a potentially complicated dependence of model parameters such as the amount of material and velocity and angle of stream lines on the physical parameters such as the black hole mass and accretion rate, it may be possible to explain Eigenvector 1 self-consistently. There are a few more important issues:
-
•
Broad emission lines in AGN are often assumed to be produced in clouds that have virialized bulk motions (e.g. Peterson & Wandel 1999). In contrast, the strong winds that we propose are responsible for the blue wings in our spectra and thus for a significant fraction of the high-ionization line emission in luminous NLS1s will not have virialized bulk motion.
-
•
It has been proposed that NLS1s bear some similarity to high redshift quasars (Mathur 2000): in particular, very high redshift quasars () appear to have rather narrow lines compared with local quasars (Shields et al. 1997). The spectra presented here show that this conjecture may have serious weaknesses. At high redshift, only the rest-frame UV high-ionization lines are observed in the optical spectrum. We have discovered that the high-ionization lines in higher-luminosity NLS1s are typically broad; furthermore, Wills et al. (these proceedings) find no correlation between the high-ionization and H line widths in the PG-quasar subsample. These results imply that the observed optical spectra of high-redshift NLS1s will show broad emission lines, and therefore, such objects may be difficult to identify. Finally, if there is a wind, it is possible that some of the N V emission is a result of excitation of high velocity N+4 ions by absorption of Ly photons, and abundance enhancements may be less necessary (however, see also Hamann & Korista 1996).
-
•
Will the wind be homogeneous? Resonance-line driven winds are a characteristic of Wolf-Rayet stars and there is very strong evidence for density enhancements in these winds. Furthermore, PSK find density inhomogeneities in their simulations. Clumping may be necessary to match the intensity of observed emission lines. If present, clumping could produce interesting time-dependent and ionization-dependent behavior.
Acknowledgements: I would like to thank the Wilhelm and Else Heraeus Foundation for travel support, Jules Halpern for helpful discussions, and Daniel Proga for an early look at his submitted paper. I gratefully acknowledge support through NAG5-7971 (NASA LTSA).
References
- (1) Boller, Th., Brandt, W. N., Fabian, A. C., & Fink, H. H., 1997, MNRAS, 289, 393
- (2) Brandt, W. N., Boller, Th., Fabian, A. C., & Ruszkowski, M., 1999, MNRAS, 303, 53
- (3) Green, A. R., McHardy, I. M., & Done, C., 1999, MNRAS, 305, 309
- (4) Hamann, F., & Korista, K. T., 1996, ApJ, 464, 158
- (5) Laor, A., Jannuzi, B. T., Green, R. F., & Boroson, T. A., 1997, ApJ, 489, 656
- (6) Lawrence, A., & Papadakis, I., 1993, ApJL, 414, 85
- (7) Leighly, K. M., 1999a, ApJS, 125, 297
- (8) Leighly, K. M., 1999b, ApJS, 125, 317
- (9) Leighly, K. M., & Halpern, J. P., 2000, in preparation
- (10) Leighly, K. M., et al., 1997, ApJL, 489, 25
- (11) Leighly, K. M., & O’Brien, P. T., 1997, ApJL, 481, 15
- (12) Marziani, P., Sulentic, J. W., Dultzin-Hacyan, D., Calvani, M., & Moles, M., 1996, ApJS, 104, 37
- (13) Mas-Hesse, J. M., Rodriguez-Pascual, P. M., de Cordoba, & Boller, T., 1994, A&A, 283, 9
- (14) Mathur, S., 2000, MNRAS, in press
- (15) Mineshige, S., Kawaguchi, T., Takeuchi, M., & Hayashida, K., 2000, PASJ in press
- (16) Murray, N., & Chiang, J., 1998, ApJ, 494, 125
- (17) Nandra, K., et al., 1997, ApJ, 476, 70
- (18) Nicastro, F., Fiore, F., & Matt, G., 1999, ApJ, 517, 108
- (19) Peterson, B. M., & Wandel, A., 1999, ApJL, 521, 95
- (20) Pounds, K. A., Done, D., & Osborne, J., 1996, MNRAS, 277, L5
- (21) Proga, D., Stone, J. M., & Kallman, T. R., 2000, ApJ, submitted
- (22) Shields, J. C., Hamann, F., Foltz, C. B., & Chaffee, F. H., 1997, proc. “Emission Lines in Active Galaxies: New Methods and Techniques”, ed. B. M. Peterson, F.-Z. Cheng & A. S. Wilson (APS: San Francisco), p. 118
- (23) Timmer, J., et al. 2000, Phys. Rev. E in press
- (24) Wilkes, B. J., et al., 1994, ApJS, 92, 53
- (25) Wills, B. J., Laor, A., et al. 1999, ApJL, 515, 53