ASCA Observations of NLS1s: BH Mass Estimation from X-ray Variability and X-ray Spectra
Abstract
ASCA observations of Narrow-Line Seyfert 1 galaxies (NLS1s) are presented. We focus on the black hole size of the NLS1 sources by employing two independent methods for the mass estimation; one is using X-ray variability, the other is using a blackbody fit to the soft component. Although the coincidence is not good for some sources, the mass estimated by these methods ranges from to , systematically smaller than those for typical (broad line) Seyfert 1. We consider the small mass black hole to be the principal cause of the several extreme characteristics of the NLS1s.
keywords:
galaxies: active; X-rays: galaxies; X-rays: variability; black hole: mass1 Introduction
Properties of Narrow Line Seyfert 1 type (NLS1) sources are summarized as, 1) steep soft X-ray spectrum, 2) rapid X-ray variability, 3) narrow H width (see e.g. Boller et al. 1996). These properties and their distinctive differences from Broad Line Seyfert 1 type (BLS1) galaxies are expected to be explained by fundamental parameters of AGNs, such as geometry, black hole (BH) mass, accretion rate, and so on. In this paper, we try to estimate the BH mass of the NLS1s (and BLS1s) by two independent methods based on the ASCA observations; One is from X-ray variability of the sources, and the other is from a black body fit to the soft X-ray spectrum. We suggest that the NLS1s have smaller black holes than usual Seyfert 1s and emit X-rays with a higher efficiency.
Earlier results with a smaller sample was presented in Hayashida (1998, 2000). In this paper, we treat 14 NLS1 sources, IZw1, Ton S 180, PHL 1092, PKS 0558-504, 1H 0707-495, RE 1034+39, NGC 4051, PG 1211+143, Mrk 766, PG 1244+226, IRAS 13224-3809, PG 1404+226, Mrk 478 and Ark 564. We also use 9 BLS1 sources observed with Ginga and ASCA for the variability analysis. Among the nine BLS1s, we include MCG-6-30-15. However, the source may better be classified as a NLS1 or a narrow emission line galaxy. We adopt in this paper.
2 Black Hole Size in the NLS1s
2.1 X-ray Variability
Rapid and large amplitude X-ray variability is one of the common features of NLS1s. The most extreme case was found in IRAS13224 (Otani et al. (1996) and Boller et al. (1997)); the maximum variability was a factor of 60, and the shortest doubling time was 800 s.
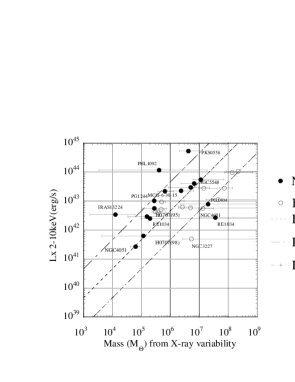
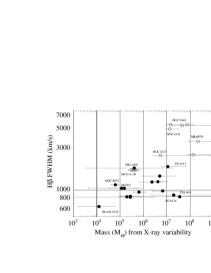
We have investigated the X-ray variability of Seyfert 1 galaxies, in which we developed a method to extract relative variability time scale of sources using a normalized power spectrum (Hayashida et al. 1998a). Another point of our work was that, employing the stellar black hole Cyg X-1 as the base point, and assuming the variability scales linearly with the time scale and the system size, we estimate the central black hole of AGNs. We applied the same procedure to the NLS1s and the BLS1s in our sample (Fig.1). As shown in Fig.1, our NLS1 sample have black hole masses ranging from to , systematically lower than the estimated masses of BLS1s plotted in the same figure. In terms of the Eddington ratio, the NLS1s have typical values of 1-10, while the BLS1s have 0.1-10. Differences in the estimated BH mass in NLS1s and in BLS1s are apparent if we look at the correlation with FWHM of (Fig.2).
2.2 Blackbody Model Fit to the Soft Component
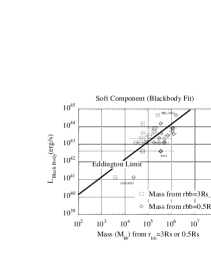
One of the most plausible interpretations of the soft component of NLS1s is thermal emission from the accretion disk. When we fit the soft component with a blackbody model, we obtain the area of the emission region. If we assume the emission region to be the surface of a 3 Schwarzshild radius () sphere or a 0.5 sphere, the black hole size can be estimated. Fig.3 shows the luminosity of the blackbody component versus the mass of the black hole estimated in this way. If we assume the emission area size ()=3, most of the sources exceed the Eddington limit. On the other hand, if =0.5, i.e. the extreme Kerr case, the radiation is at the sub-Eddignton phase. A more important thing is that the mass ranges from to .
2.3 Comparison of Two Mass Estimates
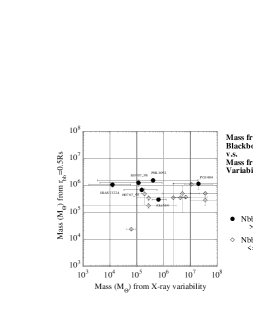
Both mass estimates are compared directly in Fig. 4. A large discrepancy of up to two orders of magnitude is found for some sources. However, for the sources below the diagonal line, we have a possible reason for it; 1) we neglected the disk inclination factor, with which the data points should move upward, and 2) the color temperature we used might be higher than the effective temperature that we should have used, if we had a sophisticated model for the disk emission. On the other hand, these facts cannot reconcile the discrepancy for the sources above the diagonal line in Fig.4. Nevertheless, we find that most of those sources have an extremely enhanced soft component relative to the hard power law component. One of the speculations we have is that those sources are in some extreme state in which the ¿variability mode is very much different from the others, e.g., intrinsic amplitude is enhanced.
References
- (1) Boller, Th., Brandt, W.N., Fink, H., 1996, Astron. Astrophys., 305, (1996) 53.
- (2) Boller, Th. et al., MNRAS,289, (1997) 393.
- (3) Otani, C., Kii, T. & Miya, K. MPE report, (1996) 263.
- (4) Hayashida, K. et al. , Astrophys. J., 500, (1998a) 642.
- (5) Hayashida, K. , The Hot Universe (IAU Sympo188), pp.428 (1998b).
- (6) Hayashida, K. , Adv. Space Sci., 25, (2000) 489.