MAXIMA-1: A Measurement of the Cosmic Microwave Background Anisotropy on angular scales of 10′ to 5°
Abstract
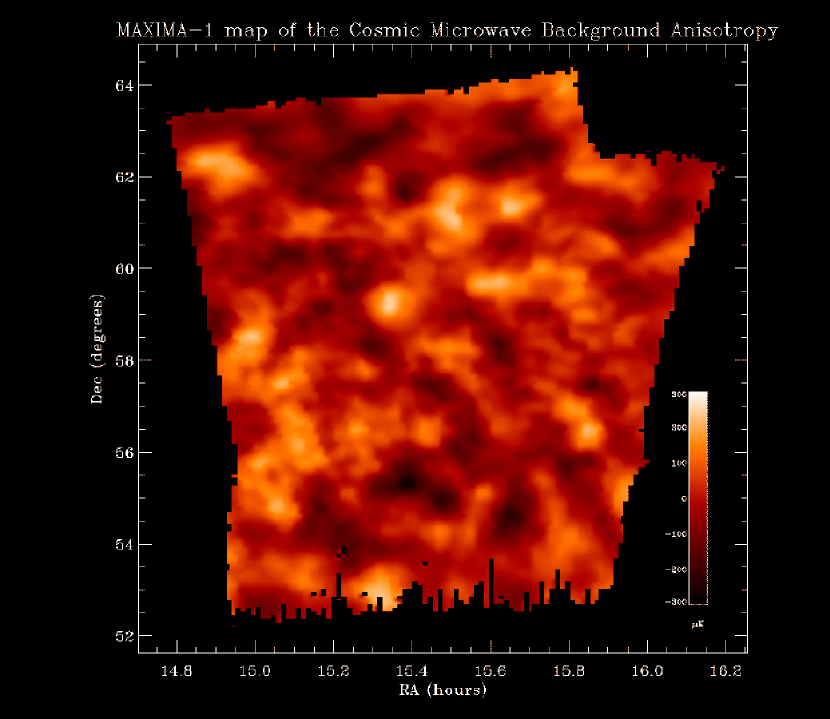
We present a map and an angular power spectrum of the anisotropy of the cosmic microwave background (CMB) from the first flight of MAXIMA. MAXIMA is a balloon-borne experiment with an array of 16 bolometric photometers operated at 100 mK. MAXIMA observed a 124 deg2 region of the sky with 10′ resolution at frequencies of 150, 240 and 410 GHz. The data were calibrated using in-flight measurements of the CMB dipole anisotropy. A map of the CMB anisotropy was produced from three 150 and one 240 GHz photometer without need for foreground subtractions. Analysis of this CMB map yields a power spectrum for the CMB anisotropy over the range . The spectrum shows a peak with an amplitude of at and an amplitude varying between and for .
1 Introduction
Measurements of the anisotropy of the cosmic microwave background (CMB) can discriminate between cosmological models and determine cosmological parameters with high accuracy (Kamionkowski & Kosowski, 1999, and references therein). Inflationary dark matter models, for example, predict a series of peaks in the angular power spectrum of the anisotropy. The collected results from many experiments show the existence of a first peak at angular scales corresponding to the spherical harmonic multipole number . These results have been interpreted as evidence for a flat universe (de Bernardis et al., 2000; Lange et al., 2000; Dodelson & Knox, 2000; Tegmark & Zaldarriaga, 2000; Pierpaoli, Scott, & White, 2000). Additional observations probing a broad range of angular scales would greatly increase confidence in these results and further constrain cosmological parameters.
MAXIMA is a balloon-borne experiment optimized to map the CMB anisotropy over hundreds of square degrees with an angular resolution of 10′. In this paper we report results from the MAXIMA-1 flight which took place on August 2, 1998. These include a 100 square degrees map of the CMB anisotropy and the resulting power spectrum over the range , which is the largest range reported to date. Despite several common team members, the data analysis was independent of that leading to the recently reported BOOMERANG results (de Bernardis et al., 2000). A companion paper, Balbi et al. (2000), discusses the cosmological significance of the MAXIMA-1 results.
2 Instrumentation
Lee et al. (1999) gives a detailed description of the MAXIMA system. It is based on a well-baffled, under-filled, off-axis Gregorian telescope with a 1.3 m primary mirror, mounted on an attitude-controlled balloon-borne platform. A well-baffled liquid-Helium-cooled optics box is lined with absorbing material (Bock, 1994) and contains two reimaging mirrors, low-pass filters, field and aperture stops, feed horns for the 16 photometers, and a focal-plane stimulator. Eight conical single-mode horns at 150 GHz and four multi-mode Winston horns each at 240 GHz and 410 GHz provide 10′ beams at all three frequencies. The frequency bands are defined with absorptive and metal-mesh filters. Radiation is detected with spider-web bolometers (Bock et al., 1996) operated at 0.1 K with an adiabatic demagnetization refrigerator (Hagmann & Richards, 1995). The bolometers are AC-biased to avoid low-frequency amplifier noise. Additional channels with a constant resistor, a thermometer, and a dark bolometer are used to monitor electromagnetic interference, cross-talk, and drifts in electronic gain and temperature.
| FWHMa | NET | |||
| (GHz) | (GHz) | (arcmin) | (msec) | () |
| 150 | (11.5,10) | 10 | 80 | |
| 150 | (10.5,9.5) | 7 | 90 | |
| 150 | (11.5,9.5) | 7 | 90 | |
| 240 | (12,8.5) | 7 | 120 | |
| 410 | (11,8) | 6 | 2050 | |
| a The beams have some asymmetry. The FWHM | ||||
| are for the long and short axes. | ||||
The gondola azimuth is driven by a reaction wheel using information from a two-axis magnetometer and a three-axis rate gyroscope. The telescope elevation is set using information from an angle encoder. Observations were carried out at fixed elevation with the primary mirror scanning ° in azimuth at 0.45 Hz and the gondola also scanning in azimuth but at a frequency of Hz. Both scans were triangle functions of time with smoothed turnarounds.
3 Observations
The MAXIMA-1 flight was launched from the National Scientific Balloon Facility in Palestine, Texas at 1 UT on August 2, 1998. Observations of the CMB dipole for the purpose of calibration began at 3.6 UT when the payload reached an altitude of 32 km and ended at 4.2 UT after rotations at 3.3 rpm. The elevation angle was set to 51°. The payload reached float altitude of km at 4.6 UT.
The 1.6 hour CMB-1 observation began at 4.35 UT with a telescope elevation of 46.3°. The gondola was scanned ° in azimuth at 16.1 mHz centered at 321.5°. The 1.4 hour CMB-2 observation began at 6.0 UT with a telescope elevation of 32.3°. The gondola was scanned ° at 21.3 mHz centered at 323°. Because of sky rotation, the combination of these observations covered a nearly square region of the sky with an area of 124 square degrees of which 45% is cross-linked at an angle of 22°.
Observations of Jupiter were carried out from 7.5 to 8.1 UT to map the telescope beams and provide additional calibration information. The elevation was fixed at 44.2° while sky rotation and the primary mirror modulation provided transits across each beam.
4 Pointing Reconstruction and Calibration
We identified the stars which moved through the field of a CCD camera aligned with the center of the primary mirror scan by using the balloon location, telescope elevation, and the position of Polaris in an offset CCD camera. Interpolations using an angle encoder on the primary mirror, rate gyroscopes, and the known star positions permitted pointing reconstruction to better than 1′ RMS. Less than 0.1% of the data had pointing uncertainty larger than 2′ and were not used.
A full beam calibration of the 150 and 240 GHz photometers was obtained from observations of the CMB dipole. The data from each rotation were -fitted to a linear combination of a dipole model (Lineweaver et al., 1996), a galactic-dust emission model (Schlegel, Finkbeiner, & Davis, 1998), data from one 410 GHz photometer, an offset, and a gradient. The amplitude of each of these components was treated as a free parameter. A monotonic change in the detector calibration of less than 9% throughout the CMB observations, due to an increasing detector temperature, was monitored by illuminating the focal plane with the stimulator lamp. Estimated calibration uncertainties were less than 4% for each of the 150 and 240 GHz photometers. The uncertainties in the dipole calibration and the time dependent calibration contributed about equally to the total error, and systematic sources contributed about 25%.
Beam maps and an independent calibration were obtained from observations of Jupiter. We estimate a uncertainty of ′ in the size of the beams. The beam profiles were integrated and used with the angular diameter and brightness temperature of Jupiter (Goldin et al., 1997) and the optical bandpass functions to calibrate all 16 photometers. For the data reported here, the errors in the calibration from Jupiter were between 12 and 14% (with about 10, 5, 5, and 2% coming from uncertainties in the beam solid angle, frequency bands, Jupiter’s flux, and measured signal, respectively). The absolute calibrations from the dipole agreed with those from Jupiter to within , with the Jupiter calibration predicting larger temperature fluctuations by 11 to 14%.
5 Map and Angular Power Spectrum
In this paper we report on the analysis of data from the three 150 GHz, one 240 GHz, and one 410 GHz photometer described in Table 1. At 150 and 240 GHz these photometers are the most sensitive in the MAXIMA array and give the highest sensitivity of any CMB instrument reported to date.
The raw data for each photometer consisted of 2.3 million samples of which about 16% were not used. We removed the stimulator calibration events and other events with an amplitude larger than . This procedure broke the data into 20 segments that were treated as independent observations of the sky. Samples in each of the segments which were in excess of , such as cosmic ray hits and short telemetry drop-outs, were removed. For the data of one of the photometers, we repeated the data analysis by using a threshold of with no significant change in the resulting angular power spectrum. We deconvolved the transfer functions of the bolometers and readout electronics and estimated the noise power spectrum from sections of the time stream that had no gaps (Stompor et al., in preparation). We used the procedure of Ferreira & Jaffe (2000) to confirm that the time-domain data are dominated by noise. We marginalized over frequencies lower than 0.1 Hz and higher than 30 Hz, where we did not expect appreciable optical signals.
The calibrated time stream data were combined with the pointing solution to produce a maximum likelihood pixelized map of temperature anisotropy and a pixel-pixel noise correlation matrix for each photometer (Wright, 1996; Tegmark, 1997; Bond et al., 1999). An area of square degrees of the map was not well cross-linked and is not included in the present analysis. The data showed a signal that was phase-synchronous with the primary mirror scan which was due to radio-frequency interference from on-board transmitters modulated by the mirror motion. This signal was constant within each data segment, varied between different photometers, and had an amplitude of 100 - 300 . We removed it by allocating fictitious map pixels to values of the primary mirror angle and determined the maximum likelihood map in these pixels simultaneously with the temperature anisotropy map (Stompor et al., in preparation).
We verified that there are no noise correlations between maps of different photometers by producing difference maps from the data of pairs of photometers. The angular power spectra of these maps were consistent with no signal. We also showed that histograms of the temperatures in the difference maps were consistent with the distributions expected for no noise correlations at a Kolmogorov-Smirnov significance level larger than 10%. A combined temperature anisotropy map was then produced by adding individual maps with a weight inversely proportional to their noise correlation matrices. A Wiener filtered version of this map is shown in Figure 1. We assign a calibration uncertainty of 4% to the magnitude of temperature fluctuations in the combined map.
We calculated the angular power spectrum of the combined map using the MADCAP (Borrill, 1999) implementation of the maximization of the likelihood function following Bond, Jaffe & Knox (1998). This implementation assumes that the beam shape has axial symmetry. We produced an effective beam for the analysis of the combined map by noise-weight averaging the individual beams. We followed the procedure of Wu et al. (2000) to find a symmetric approximation for the effective beam and included the small smoothing provided by the pixelization. We tested this procedure for the MAXIMA-1 beams and data and found no systematic bias of the estimates (Wu et al., 2000) . We calculated the power spectrum of the temperature fluctuations using 15 bins in over the range assuming a constant band power in each bin, and marginalizing over the CMB monopole and dipole. We further marginalized over the bins at and and diagonalized the -bin correlation matrix using a variant of techniques discussed in Bond, Jaffe & Knox (1998). The correlations between the dominant bin and adjacent bins were typically less than 10%. Table 2 lists the dominant bins, the estimates, and the estimates for the corresponding uncorrelated linear combinations of bins. We quote errors on the estimates assuming 68% confidence intervals using the offset log-normal distribution model of Bond, Jaffe & Knox (2000). These errors do not include two additional independent sources of uncertainty. Expressed as a percentage of , the calibration error is a constant 8% and the -dependent error due to the beam-diameter uncertainty, which has been shown to be fully correlated between bins, is given in Table 2. Information on the shape of the bin-power likelihood functions and window functions will be made available on the MAXIMA web site (http://cfpa.berkeley.edu/maxima).
| Beam Error | ||||
|---|---|---|---|---|
| () | (%) | () | ||
| 77 | [ 36, 110] | |||
| 147 | [ 111, 185] | |||
| 223 | [ 186, 260] | |||
| 300 | [ 261, 335] | |||
| 374 | [ 336, 410] | |||
| 447 | [ 411, 485] | |||
| 522 | [ 486, 560] | |||
| 597 | [ 561, 635] | |||
| 671 | [ 636, 710] | |||
| 742 | [ 711, 785] |
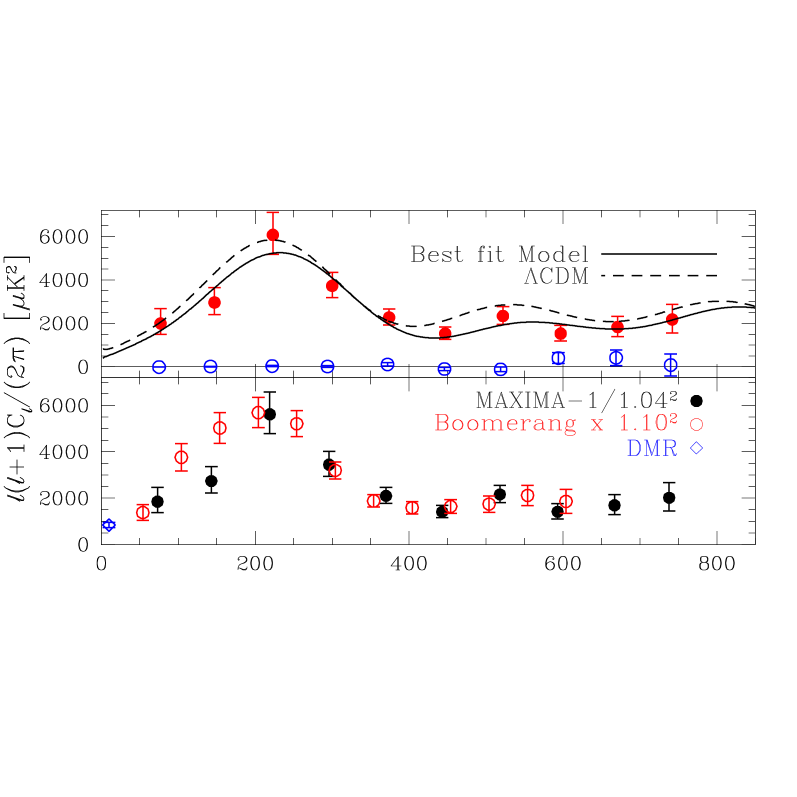
The top panel of Figure 2 shows the maximum likelihood power spectrum, an inflationary adiabatic model that best fits the MAXIMA-1 and COBE/DMR power spectra, and a CDM model. The for the best fit and for the CDM models are 41 and 50, respectively, using all 38 data points. If we only use the 10 data points of MAXIMA-1 we obtain and 9 for the best fit and CDM, respectively (Balbi et al., 2000).
6 Foregrounds
Foreground sources include emission from the earth, the atmosphere, interstellar dust, free-free radiation, synchrotron radiation, and point sources, and scattering due to the Sunyaev-Zeldovich effect. The two CMB scans, performed with a separation of 1.5 hours at different telescope elevations, show consistent structure. This temporal stability is inconsistent with an atmospheric or ground-based origin for the signal. We extrapolated the 100 µm, 10′ resolution Schlegel, Finkbeiner, & Davis (1998) map of our observed region to lower frequencies using the two-component dust model favored by Finkbeiner, Davis & Schlegel (1999). The predicted RMS dust temperature is only 2.3 and 9.3 , for the 150 and 240 GHz bands, respectively. We found a statistically significant correlation between the dust model and our maps. The ratio of the detected to predicted RMS dust signal was statistically consistent with unity. When we subtracted the correlated dust signal from the maps the change in the measured angular power spectrum was negligible. A catalog search (Sokasian, Gawiser, & Smoot, 2000; Gawiser & Smoot, 1997) yielded no detectable radio or infra-red sources in any of the frequency bands. Estimates of bremsstrahlung and synchrotron radiation (Bouchet & Gispert, 1999) yielded contributions of less than 1 at 150 and 240 GHz and no subtractions were made.
Integrating the measured power spectrum of one photometer at 150 GHz and the one at 240 GHz we find for a thermodynamic temperature fluctuations ratio of compared to unity for the CMB, 0.06 for emission from dust, 2.1 for synchrotron, and 3.7 for free-free radiation, assuming the Tegmark et al. (2000) “middle” foregrounds model. For the ratio between 150 and 410 GHz, we found a lower limit of compared to for dust and for atmosphere. The observed anisotropy is not consistent with the thermal SZ effect, which would produce anti-correlated structure in the 150 and 240 GHz bands.
7 Tests for Systematic Errors
Because of computational limitations, tests for systematic errors were done with maps which had square pixels of 8′ and 10′ on a side. The power spectra calculated from the 8′-pixel and 5′-pixel combined maps were statistically consistent. The following combinations of the data were analyzed and produced a power spectrum consistent with no signal: (1) a dark bolometer, (2) the data from the 410 GHz photometer, (3) the difference between the overlapping part of the combined map from the CMB-1 and -2 scans, (4) the differences between the maps produced by different photometers. We also weight-averaged the maps of the second and third photometers in Table 1 and the first and fourth. The maximum likelihood estimate of the power spectrum of the difference between these independent maps is consistent with no signal as shown by the open circles in the top panel of Figure 2.
We compared the estimate of the angular power spectrum to that obtained using: (1) only the sections of the map where the CMB-1 and -2 scans overlap, (2) a map of each of the CMB scans alone. We made maps and calculated estimates from the data of each photometer alone and using: (1) only a sub-section of the time stream data, (2) a high-pass filtered version of the time stream where the high-pass was a time domain box-car with a width of 10 sec, (3) various combinations of frequency marginalizations between 30 and 70 Hz, and 0.05 and 0.3 Hz, respectively. In all these cases the computed power spectra agreed among themselves and with the power spectrum presented in this paper. The Kolmogorov-Smirnov test (see Section 5), as applied to difference maps and to a map of the dark bolometer, confirms that we correctly estimated the noise in the experiment and that the pixel-domain noise is Gaussian.
We used simulations to test the algorithm used to subtract the signal that was phase-synchronous with the primary mirror modulation. We found that the power spectrum estimate was not biased with phase-synchronous signals larger than those observed in the data. If we make the maps without removing the phase-synchronous signal the power spectrum estimate changes only at .
The computer programs used to generate the maps and power spectra were tested extensively using simulations of the time domain data and noise. Maps were produced by two independent computer codes and the power spectra calculated from these maps were consistent. We used one of the map-making codes to make maps of Jupiter and found them consistent with those obtained with a simple data-binning technique.
8 Discussion
We have observed temperature anisotropy on the sky at 150 and 240 GHz that is consistent with fluctuations in the cosmic microwave background radiation, and inconsistent with any known foreground. The observations were carried out with photometers that give the highest CMB sensitivity reported to date. Our measurements cover a range of angular scales corresponding to the multipole range , which is the largest yet reported by a single experiment. The measured angular power spectrum shows a clear peak at , and an amplitude varying between and at . The power spectrum is well fit by an inflationary adiabatic model over the entire range of . The best-fit model has a total energy density close to unity and a non-zero cosmological constant. The MAXIMA-1 power spectrum appears consistent with that of the BOOMERANG experiment (de Bernardis et al., 2000) once the power spectra of the two experiments are scaled by factors equal to their respective calibration uncertainties, see Figure 2. A detailed analysis of the combined data sets which includes a determination of the calibration factors that bring the experiments to agreement is presented in Jaffe et al. (2000).
References
- Balbi et al. (2000) Balbi, A., et al. 2000, ApJ, submitted
- Bock (1994) Bock, J. J. 1994, Ph.D. Thesis, UC Berkeley, Berkeley, CA
- Bock et al. (1996) Bock J. J., DelCastillo, H. M., Turner, A. D., Beeman, J. W., Lange, A. E., & Mauskopf, P. D. 1996, Proc. of 30th ESLAB Symp., ’Submillimeter and Far-Infrared Space Instrumentation’, ESTEC, Noordwijk, ESA, SP-388.
- Bond et al. (1999) Bond, J. R., Crittenden, R., Jaffe, A. H., & Knox, L. E. 1999, Computing in Science and Engineering, 1, 21, astro-ph/9903166.
- Bond, Jaffe & Knox (1998) Bond, J. R., Jaffe, A. H., & Knox, L. 1998, Phys. Rev. D, 57, 2117, astro-ph/9708203
- Bond, Jaffe & Knox (2000) Bond, J. R., Jaffe, A. H., & Knox, L. 2000, ApJ, 533, 19 astro-ph/9808264
- Borrill (1999) Borrill, J. 1999, in EC-TMR Conference Procedings 476, 3K Cosmology, ed. L. Maiani, F. Melchiorri, & N. Vittorio (Woodbury, New York: AIP), 224
- Bouchet & Gispert (1999) Bouchet, F., & Gispert, R. 1999, New Astronomy, 4, 443
- de Bernardis et al. (2000) de Bernardis, P., et al. 2000, Nature, 404, 995
- Dodelson & Knox (2000) Dodelson, S., & Knox, L. 2000, Phys. Rev. Let, 84 3523
- Ferreira & Jaffe (2000) Ferreira, P. G., & Jaffe, A. H. 2000, MNRAS, 312, 89, astro-ph/9909250
- Finkbeiner, Davis & Schlegel (1999) Finkbeiner, D. P., Davis, M., & Schlegel, D. J. 1999, ApJ, 524, 867
- Gawiser & Smoot (1997) Gawiser, E., & Smoot G. 1998, ApJ, 480L, 1, astro-ph/9603121
- Goldin et al. (1997) Goldin, A. B., et al. 1997, ApJ, 488L, 161, astro-ph/9612040
- Hagmann & Richards (1995) Hagmann, C., & Richards, P. L. 1995, Cryogenics, 35, 303
- Hanany, Jaffe & Scannapieco (1999) Hanany, S., Jaffe, A. H., & Scannapieco, E. 1998, MNRAS, 299, 653
- Jaffe et al. (2000) Jaffe, A. H., et al. 2000, Phys. Rev. Let, submitted, astro-ph/0007333
- Kamionkowski & Kosowski (1999) Kamionkowski, M., & Kosowsky, A. 1999, Annual Reviews of Nuclear and Particle Science, in press, astro-ph/9904108
- Lange et al. (2000) Lange, A. E., et al. 2000, Phys. Rev D., submitted
- Lee et al. (1999) Lee, A. T., et al. 1999, in EC-TMR Conference Procedings 476, 3K Cosmology, ed. L. Maiani, F. Melchiorri, & N. Vittorio (Woodbury, New York: AIP), 224, astro-ph/9903249
- Lineweaver et al. (1996) Lineweaver, C. H., Tenorio, L., Smoot, G. F., Keegstra, P., Banday, A. J., & Lubin, P. 1996, ApJ, 470, 38L
- Pierpaoli, Scott, & White (2000) Pierpaoli, E., Scott, D., & White, M. 2000, Science, 287, 2171
- Schlegel, Finkbeiner, & Davis (1998) Schlegel D. J., Finkbeiner, D. P. & Davis, M. 1998, ApJ, 500, 525
- Sokasian, Gawiser, & Smoot (2000) Sokasian, A., Gawiser, E. & Smoot G. 2000, ApJ, submitted. astro-ph/9811311
- Tegmark (1997) Tegmark, M. 1997, ApJ, 480, 87
- Tegmark et al. (2000) Tegmark, M., Eisenstein, D., Hu, W., & De Oliveira-Costa, A. 2000, ApJ, 530, 133, astro-ph/9905257
- Tegmark & Zaldarriaga (2000) Tegmark, M., & Zaldarriaga, M., 2000, ApJ, submitted, astro-ph/0002091
- Wright (1996) Wright, E. L. 1996, astro-ph/9612006
- Wu et al. (2000) Wu, J. H. P., et al. 2000, ApJ, submitted, astro-ph/0007212