Imaging of Ultraluminous Infrared Galaxies in the Near-UV
Abstract
We present the first ground-based U′ (3410Å, =320Å) images of Ultraluminous Infrared Galaxies (ULIGs). Two samples were observed: (1) “warm” ULIGs with mid-infrared colors characteristic of active galactic nuclei (f25μm/f0.2), which are believed to represent a critical transition phase between cooler ULIGs and optically selected QSOs according to a previously proposed evolutionary model, and (2) the complementary “cool” ULIGs (f25μm/f0.2) which in the evolutionary model are the progenitors of warm ULIGs and which have many characteristics associated with active star-formation. Although in some cases there is also emission identified with an active galactic nucleus, the U′ emission originates primarily in massive young stars and as such allows a direct examination of the sites of recent high-mass star formation. Strong U′ emission (median total MU = -20.8) is seen in all systems and in some cases the extended tidal features (both the smooth stellar distribution and compact star-forming features) contribute up to 60–80% of the total flux. The star-forming regions in both samples are found to have ages based on spectral synthesis models in the range 10-100 Myrs, and most differences in color between them can be attributed to the effects of dust reddening. Additionally, it is found that star-formation in compact knots in the tidal tails is most prominent in those ULIGs which have double nuclei, suggesting that the star-formation rate in the tails peaks prior to the actual coalescence of the galaxy nuclei and diminishes quickly thereafter. Similar to results at other wavelengths, the observed star formation at U′ can only account for a small fraction of the known bolometric luminosity of the ULIGs. Azimuthally averaged radial light profiles at U′ are characterized by a Sérsic law with index n=2, which is intermediate between an exponential disk and an r-1/4 law and closely resembles the latter at large radii. The implications of this near-ultraviolet imaging for optical/near-infrared observations of high redshift counterparts of ULIGs are discussed.
To appear in the August, 2000 edition of the Astronomical Journal
1 Introduction
Many recent Hubble Space Telescope (HST) observations have shown the prevalence of clustered star-formation in interacting galaxies (Whitmore et al. 1995, Meurer et al. 1995). Other observations have shown that Ultraluminous Infrared Galaxies (ULIGs; objects with infrared luminosities, 111 L(8–1000µm) is computed using the flux in all four IRAS bands according to the prescription given in Perault (1987); see also Sanders & Mirabel (1996). Throughout this paper we use = 75 km s-1Mpc-1, qo = 0.5 (unless otherwise noted)., greater than ) often have extended morphologies consistent with being advanced mergers (Sanders et al. 1988a, Murphy et al. 1996, Clements et al. 1996). Surace et al. (1998, hereafter Paper I) showed that these same systems have evidence for “knots” of star-formation with characteristic diameters of 100 pc distributed over their central several kpc and along their extended tidal features. Estimated ages for these knots based on optical and near- infrared colors were in the range of 10–800 Myrs. In at least 25% of ULIGs, particularly those with “warm” mid-infrared colors and Seyfert optical spectra, it is also possible that some fraction of the optical and hence U′ light is emitted by an AGN.
With the exception of integrated photometry taken with single beam photometers for a few systems (Neugebauer et al. 1987, Young et al. 1996), only two of the ULIGs have been examined at short wavelengths before (Trentham et al. 1999). This is primarily due to former assumptions about the dusty nature of the ULIGs. Since the bulk of the luminosity in ULIGs is emitted at 25–100 m as a result of dust absorption and reradiation, the assumption has always been that the galaxies themselves are intrinsically dusty and that extinction must therefore be very high. In short, there would be nothing to see at short wavelengths. However, ground- based and HST imaging (Paper I, Surace 1998, Surace & Sanders 1999; hereafter Paper II) has revealed the presence of luminous clustered star formation at optical and near-infrared wavelengths. Paper II developed a broad-band multi-color technique at optical and near-infrared wavelengths in order to measure and correct for the presence of a foreground dust screen. These observations have shown that the apparent line-of-sight extinction is quite low (typically A 2 magnitudes), implying that many of the active star forming regions have already ejected any surrounding dust or have particularly favorable scattering geometries. Additionally, millimeter-wave observations of some of these systems have indicated directly that the dust is strongly centrally concentrated and localized, and hence the more extended starburst regions may be relatively unobscured (Bryant & Scoville 1996, Scoville et al. 1997). Line-of-sight extinction is therefore not a serious impediment to detecting the ULIG star-forming regions at short wavelengths.
There are several advantages to working at shorter wavelengths. As noted in Paper I, there is an ambiguity in interpreting broad-band colors of starbursts with burst ages of 10–100 Myrs, as their colors in all filters redder than B are degenerate during this time period. This can be partially disentangled through the use of U-band imaging; (UB) colors evolve almost monotonically throughout this period in the life of the starburst. Although reddening will still prevent a precise starburst age estimate since it is most severe at short wavelengths, the (UB) colors, in conjunction with longer wavelength data ( Surace et al. 1998 [Paper I], Surace et al. 1999 [Paper II]), will help constrain the upper age limits of the starbursts more accurately. Furthermore, the youngest stars, which dominate the luminosity of the starburst, have spectral energy distributions (SEDs) which peak at ultraviolet wavelengths. Ultraviolet observations therefore provide the greatest possible contrast between compact young star- forming regions and the redder, extended underlying galaxy. In the evolutionary model of Sanders et al. (1988a), warm ULIGs are a more advanced evolutionary state than cool ULIGs, and this should be reflected in the upper limits of the knot ages.
Finally, there have been many recent advances in the study of high redshift galaxies. Particularly important are deep submillimeter surveys, which have discovered a significant population of high-redshift galaxies which are luminous at far-infrared wavelengths (Smail et al. 1997, Hughes et al. 1998), and which are inferred on the basis of their submillimeter luminosity to be high-redshift counterparts of the local ULIGs. Optical and near-infrared observations of these high-redshift objects correspond to rest-frame UV, and hence a better understanding of the UV properties of local ULIGs is required in order to interpret high-redshift results.
We present U′ imaging data for selected ULIGs drawn from two complete samples of “warm” AGN-like ULIGs and “cool” starburst-like ULIGs which have been previously well-studied at other wavelengths (Sanders et al. 1988ab, Kim et al. 1998, Paper I, II, Surace 1998), with the primary goal of characterizing these systems at near-UV wavelengths in order to further understanding of high-redshift systems. U′ and optical colors are used to derive starburst knot ages assuming synthetic starburst models. The estimated ages, reddenings, and luminosities are used to derive the contribution of the extended starburst regions to the known bolometric luminosities of the galaxy systems. The history of star-formation in these systems and the implications of these new observations for high-redshift systems are discussed.
2 Data
2.1 Sample Selection
The ultraluminous infrared galaxies were chosen from two small, nearly complete samples. The first sample consists of the “warm” ULIGs first described by Sanders et al. (1988b); more detailed optical and near-infrared imaging can be found in Surace et al. (1998) and Surace & Sanders (1999). These systems were selected using a mid-infrared color criterion known to select active galaxies () 222The quantities , , , and represent the IRAS flux densities in Jy at 12 µm, 25 µm, 60 µm, and 100 µm respectively. and which has been used previously to select AGN from the IRAS Point Source Catalog (de Grijp et al. 1985, 1987). Studies of several small but complete samples of warm ULIGs have shown that many of these objects have a point-like optical appearance on the Palomar Sky Survey and that they exhibit broad (i.e. Seyfert 1) optical emission lines, characteristics that have led them to be referred to as “infrared QSOs” (e.g. Low et al. 1988, Sanders et al. 1988b). These warm objects, which account for 20–25 % of the total population of ULIGs discovered by IRAS (Kim 1995), appear to represent a critical transition stage in the evolution of the larger population of “cool” ULIGs into optical QSOs according to the unification scheme proposed by Sanders et al. (1988a). Since they were selected to be transition objects similar to optical QSOs, the luminosity criterion used was L L⊙ , hence the inclusion of two systems with L L⊙(Sanders et al. 1988b).
The second sample consists of ULIGs with complementary “cool” colors () as detailed by Surace et al. (2000). These systems are more similar to the majority of ULIGs (representing roughly 75% of the ULIG population; Kim 1995) and are thus similar to the Bright Galaxy Sample ULIGs described by Sanders et al. (1988a). They typically have HII or LINER spectra, have diffuse nuclear regions with optical/near-infrared colors similar to young stars obscured by A1-4 magnitudes (Surace 1998), and a high percentage of double nuclei. They therefore appear to represent an earlier stage in the merger process. Together these two samples span the entire range of interactions and far-infrared colors observed in ULIGs and in the evolutionary scheme of Sanders et al. (1988ab) represent two temporally distinct populations of the same type of physical object. Since the ultraviolet emission originates predominantly in massive young stars which have formed on timescales similar to that of the merger process, if the evolutionary hypothesis is correct then an examination of the warm and cool ULIGs should provide evidence for differences in their ultraviolet properties.
Because of spatial constraints and the limited telescope resources available, not all of the objects in the two complete samples could be observed. A total of 20 objects were observed: 11 (of a complete sample of 12) “warm” ULIGs and 9 (of a sample of 14) cool ULIGs. Tables 1 & 2 list the objects actually observed in the two samples, along with observation details.
2.2 Observations
The data were taken on December 26–29, 1997, March 23–24, 1998 and November 12–13, 1998 at the f/31 focus of the UH 2.2m telescope on Mauna Kea using the Orbit 20482048 camera. The Orbit camera is a backside- illuminated, thinned CCD that is UV-flooded for normal operation; it’s quantum efficiency at U′ (based on laboratory tests) is as high as 80%. At the f/31 focus this camera is oversampled, and hence the data was binned 22 on chip yielding a pixel scale of 0.09″ pixel-1. The UH U′ filter (which is noticeably bluer than the standard Johnson U filter; 3410Å, =320Å;Wainscoat 1996) was used for all observations. Total exposure times were typically 30–90 minutes, the long exposure times being necessitated by the narrowness of the U′ filter. A sequence of five or more frames was taken in order to allow post-processing rejection of the high cosmic ray incidence. These frames were dithered to further decorrelate structured pixel-to-pixel noise in the CCD itself (such as blocked rows, flat- fielding errors, etc.). The CCD bias pattern was removed by subtracting a median bias frame constructed from 20–30 bias frames (zero-time exposures), and pixel-to-pixel response variations were corrected by dividing the data by a high S/N median twilight flat. In both cases the expected poisson noise in the calibration frames was below 0.5%. On the second run this camera developed severe dark current instabilities. This was calibrated by taking 4–5 hours of dark current (closed shutter integration) data at the beginning and end of each night. The high S/N dark current images were made for each half of the night, scaled to the exposure times used for the science data, and subtracted from them. In most cases these dark integrations had the same exposure times as used for the actual science observations, thus helping eliminate time-dependent dark current variations. This strategy was effective with no visible dark current pattern after processing. The individual frames were then rotated to the normal orientation (northeast at upper left), aligned using IMALIGN in IRAF, and medianed using IMCOMBINE and an algorithm that rejects cosmic rays based on the CCD noise characteristics.
The data were flux calibrated by observing optical standard stars (Landolt 1983, 1992) with a wide range of colors and at different airmasses, allowing the derivation of accurate zero-point offsets and color terms relating the U′ filter to the standard Johnson U-band filter. This also allowed the atmospheric extinction to be measured and corrected; this can be as high as 0.2–0.6 magnitudes per airmass (the observed mean was 0.27) at such short wavelengths. In general, the photometric calibration appears to be accurate to 0.04 magnitudes. Possibly the largest uncertainty is the conversion from U′ to Johnson U-band; the relatively large color term can introduce uncertainties as high as 0.05–0.1 magnitudes, depending on the underlying SED of the observed feature. Throughout this paper quoted magnitudes will be on the Johnson U-band calibration, using the color correction :
|
mU = -2.5 Log +
ZP - (airmassextinction) +
0.13(B-I)
|
(1) |
where the first term is the instrumental magnitude, the second is the instrumental magnitude zeropoint, the third is the atmospheric extinction, and the last term is the color dependency which is appropriate for the combination of the Orbit camera and the UH U′ filter. No K-corrections have been applied to any magnitude reported here since the unknown SED at U′ prevents an accurate determination of such corrections. (BI) is derived from previous optical observations (Surace et al. 1998, Surace 1998) and is accurately known (with values of (BI) typically just greater than unity). For the integrated galaxy magnitudes we used the integrated galaxy colors for the color term correction, while for the star-forming regions we used the local colors.
Fluxes were measured using aperture photometry. Circular and polygonal apertures were constructed using SKYVIEW. The background was estimated using a median of the data directly outside the apertures, excluding any bright small-scale structure. Integrated magnitudes were derived from large aperture measurements. In all cases the galaxies have been deeply imaged at I-band (Surace 1998). The apertures were chosen to be large enough to encompass the entire known extent of the galaxies. The knots were identified based on spatial coincidence with previously identified star-forming knots seen in optical and near-infrared images. In many cases the spatial resolution is too poor to resolve all of the known knots. In these cases, apertures were chosen to be large enough to encompass the entire extent of each group of unresolved knots (and whose combined photometry are listed with a “/” in Table 3). Aperture corrections were derived from the observed point spread function (PSF) and have been applied to the magnitudes reported here.
Calibration of the PSF is problematic at U′ because most stars are not very luminous at such short wavelengths, thereby decreasing the likelihood of achieving a PSF S/N comparable to that of the target objects. In some cases it was possible to estimate the PSF directly from the combined science images in the same manner as in Paper II. DAOPHOT was used to iteratively construct an empirical PSF based on all the observed stars in the combined data, resulting in a high S/N PSF. In the remaining cases where not enough stars were present the PSF was derived from the standard star observations taken immediately before and after each set of science data. Most of the image degradation at short wavelengths is due to high-order atmospheric turbulence, and hence the quality of the off-axis tip/tilt guiding is largely irrelevant to the achieved PSF; the observed flux standards should therefore provide adequate PSF calibrators. Unfortunately, because of the poor resolution at short wavelengths, aperture corrections tend to be quite large (0.5–1 mag) for sub-arcsecond apertures, and hence knowledge of the PSF is critical. In most cases, in order to derive accurate colors the previous B and I- band imaging had to be re-evaluated in apertures larger than those previously used in Surace (1998) in order to compensate for seeing-induced aperture effects. This was particularly necessary for comparison with the WFPC2 data. Total cumulative uncertainties, including those in calibration, measurement, and aperture corrections, are 0.2 magnitudes.
3 Results
3.1 Morphology
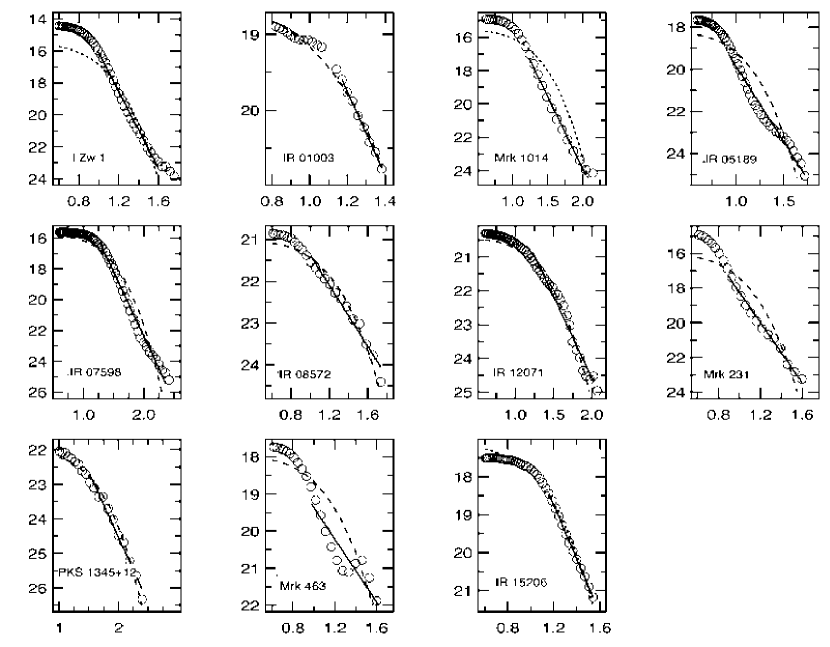
Figures 1 & 2 present the U′ observations of the 11 warm and 9 cool ULIGs, respectively, and Appendix A provides detailed descriptions. Many of the systems show considerable structure in their extended tidal features. In general, the morphology of the ULIGs at U′ is very similar to their morphology at B and to a lesser extent at I-band (Paper I). This is not surprising, as the extinction at U′ (AU=1.53AV) is only slightly larger than that at B (AB=1.45 AV), yet is much larger than I (AI=0.48 AV; Rieke & Lebofsky 1985). Therefore, dust extinction effects are unlikely to significantly alter the relative morphology between U′ and B. Any features near the I-band detection limit, however, will be completely obscured at U′ by even just a few magnitudes of extinction. Because of the generally poor spatial resolution at U′ (0.7–1.5″), any features within a radius of 1.5-2 kpc of the luminous point-like nuclei of some of the warm ULIGs will be undetectable.
Of the “warm” ULIGs, the two double nucleus systems Mrk 463 (3.8 kpc nuclear separation) and IRAS 08572+3915 (6.2 kpc nuclear separation) have the most spectacular U′ features. In both cases up to half a dozen U′ knots are scattered along the lengths of the tidal tails. The extra-nuclear (diameter greater than 2.5 kpc) regions account for 65% and 83% of the total U′ flux, respectively, where this number includes both the compact knots and the extended tidal emission. Similarly, the single active nucleus galaxies I Zw 1, Mrk 1014 and Mrk 231 have U′ knots embedded in apparent tidal features. IRAS 120710444 and IRAS 15206+3342 have evidence for marginally resolved knots in their inner 10 kpc diameter nuclear regions. IRAS 051892524, Pks 1345+12, and IRAS 010032238 have no detectable knots, although this may be due to our limited spatial resolution. The one warm ULIG which shows no U′ knots at all and should, based on the U′ -band spatial resolution and detection limits, is IRAS 07598+6508. In 7 out of 11 cases more than 50% of the U′ flux originates within a radius of 4 kpc of the nucleus, which more than anything reflects that 4 of the sample are acknowledged to be QSOs, with UV-luminous active nuclei.
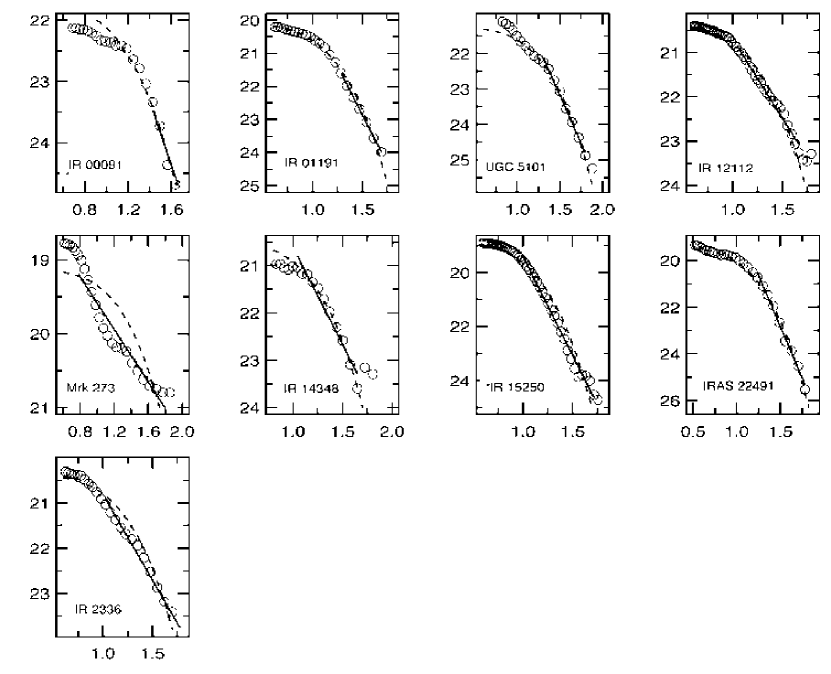
The “cool” ULIGs have an equally varied U′ morphology. More than half of the cool ULIGs have more than 50% of their U′ -band flux emitted in their inner 4 kpc radii. The single nucleus systems IRAS 000910738, UGC 5101, Mrk 273, and IRAS 23365+3604 have long, well-developed tidal tails which are easily at I-band (Surace et al. 2000), yet none of these tails has the high surface brightness U′ knots found in the warm systems IRAS 08572+3915 and Mrk 463 and even the extended tidal structure itself is barely detected at U′ . The double nucleus systems IRAS 12112+0305 (2.5 kpc nuclear separation) and IRAS 143481447 (5.5 kpc nuclear separation), however, clearly have U′ knots located in their tails and also in their nuclear regions. This indicates that the appearance of knots in the tidal structure is more a function of dynamical age as identified by the appearance of double nuclei than it is of mid-IR color. Finally, the very widest separation system examined, IRAS 011992307 (24 kpc), has no evidence for U′ knots in its barely detectable tails.
This dichotomy in the appearance or lack of knots along the extended tidal features may indicate differences in the star-formation rate in the tails during different phases of the merger evolution. Since every merger system must pass through a double-nucleus phase prior to when the two nuclei have coalesced into a single nucleus, the double nucleus systems are dynamically younger than the single-nucleus systems. However, knots embedded in the extended tidal tail structure are visible in 5 out 7 of the double nucleus systems, but only 2 out of 13 of the single nucleus systems (Table 4). Based on Monte Carlo simulations, if the probability of having extranuclear knots were the same for both samples, the likelihood of our finding as few single nucleus systems and as many double nucleus systems with knots is less than 1%, regardless of the lifetime of the knots vs. the merger lifetime. This appearance of compact star-forming knots in the tails of every merger system with nuclear separations less than 10 kpc, but not in single- nucleus post-merger systems, may indicate that the tails undergo a relatively unified burst of compact, clustered star formation during the 100 Myr period prior to the merging of the nuclei, and that no further local bursts occur. Conversely, many of the single nucleus systems (e.g. UGC 5101, IRAS 23365+3604) do have complex structure in their nuclear regions. Speculatively, this could be due to gas depletion in the tails; the denser nuclear environment may be able to fuel the bursts for much longer, or to fuel a sequence of many bursts as was indicated in Paper I. Fading of the starburst knots is very rapid at U′ ; the knots fade from their peak intensity (which occurs at an age of 30 Myrs for an instantaneous burst — see below) by nearly 5 magnitudes by the time they are only 300 Myrs old. Fading by only 3 magnitudes would make most of the luminous knots observed undetectable. Since we detect no knots even more luminous than those seen here, it is therefore likely that we are detecting the knots near the peak of their luminosity and that most of the knots we observe at U′ are between 10-100 Myrs in age, which is borne out by an analysis of their (UB,BI) colors (see below). Since the nuclear regions of the more dynamically advanced systems (i.e. Mrk 273, UGC 5101) continue to have luminous U′ knots, either these knots have an intrinsically higher peak luminosity (thus allowing them to be detectable for a longer period of time), the time-scale of the burst is much longer than the instantaneous burst modeled here, or there is an on-going generation of new knots. Note that these knots are shown below to be physically unrelated to the source of the majority of the bolometric luminosity and hence this result does not indicate anything about the evolution of the primary luminosity source in ULIGs.
An alternative explanation to the dichotomy in the appearance of star-forming knots is that two entirely different populations of ULIGs exist. The above explanation implies that the ultraluminous systems remain ultraluminous throughout the merger process. Because we have selected our targets based on a luminosity criterion, it is possible that we have actually selected systems that are ultraluminous during the early merger phase and are accompanied by many star-forming extranuclear knots, and a different population that is ultraluminous during the late merger phase and which has no knots. One way to test this would be to search for relic knots in the tails of the single nucleus systems. If knots with colors similar to older stars were found in the single nucleus systems then this would demonstrate that during their earlier double-nucleus phase they appeared similar at U′ to the double-nucleus systems we are observing. However, we lack the sensitivity to detect these older knots.
Figures 3 & 4 present surface brightness profiles for the warm and cool ULIGs, respectively, at U′ . The profiles were centered on the U′ flux centroid corresponding to the major “nuclei” (the brightest feature at B-band) identified previously in Paper I and Surace (1998). Circular azimuthally- averaged isophotes were fitted using the IRAF/STSDAS task ELLIPSE. In each case the centers and ellipticities were held fixed. The radial profiles were characterized in two ways.
First, the radial profiles were fit with a Sérsic (1968) surface brightness law:
| (2) |
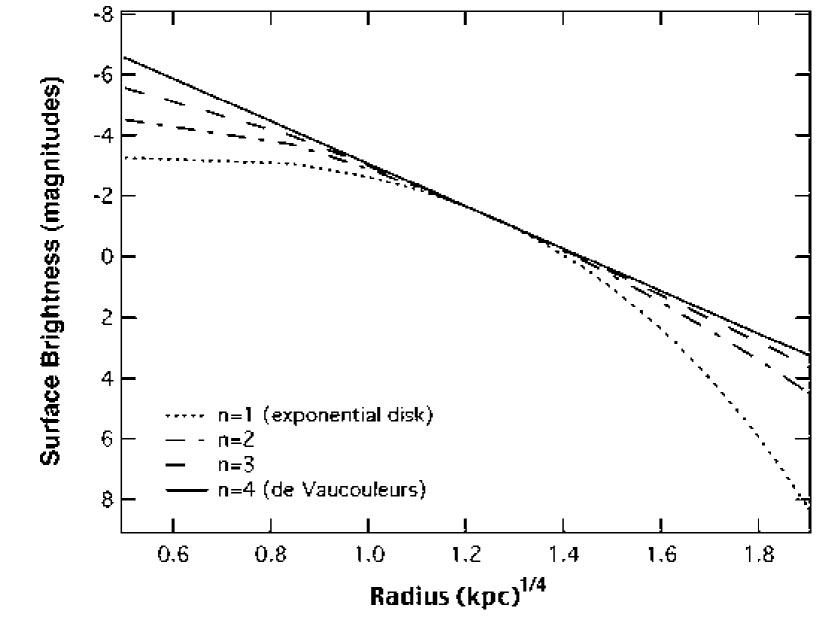
which for n=4 is a de Vaucouleurs profile, and for n=1 is an exponential disk profile. With this definition of b, Re and Ie are the half-light radius and intensity. The fitting was done with the IGOR data analysis package. In order to minimize the effects of seeing, which dominate the shape of the profile at small radii, the profiles were fit only at radii greater than the FWHM of the observed PSF (typically 1″). The Sérsic profile has many degrees of freedom, and so additional constraints had to applied. Iback was set equal to the observed background sky value far from the galaxy. Ie was constrained to be greater than zero and less than the maximum observed surface brightness. Finally, Re was estimated by integrating the total light in successive radii until the half-light radius was found. Initially, the fitting algorithm allowed Re to vary as a free parameter; however, if it arrived at a clearly non-physical value (i.e. less than 100 pc or greater than 20 kpc), then Re was held fixed at the measured value. Even so, the derived value of n was very sensitive to the input parameters. This is primarily due to the distance of the ULIGs and the limited spatial resolution of the U′ observations. Zheng et al. (1998) found, based on high spatial resolution HST data at I-band, that typical values of Re for a small sample of ULIGs were 1—6 kpc, with a median near 3 kpc. Unfortunately, this is similar to the radii over which the U′ radial profiles have been fit (typically 2—10 kpc). The Sérsic profile has an inflection near Re, and as a result n is poorly constrained (Figure 5). Furthermore, profiles with fixed parameters other than n are very similar at large radii for n . It is the profile at very small radii, which we cannot measure easily from the ground, that constrains the fit best. Only systems with apparently single nuclei were fit. This was because the uncertainties in estimating parameters in the presence of a second nucleus resulted in an unstable, and probably meaningless, value of n. The observed value of n is certain to within 0.3. Previous work has shown that n is usually slightly underestimated (Marleau & Simard 1998).
The Sérsic index n was found to lie between 0.8 (IRAS 01003-2238) and 3.5 (IRAS 05189-2524), with a median value of 1.8. There is nothing to suggest a trend between the index n and far-infrared color. Both warm and cool galaxies have nearly the same range and median; Kolomogoroff-Smirnov statistics indicate that we cannot reject the null hypothesis that the two samples were drawn from the same parent sample (Press et al. 1992). The value of n1.8 is intermediate between an exponential disk and a de Vaucouleurs profile with the same half-light radius, although it will more closely resemble the de Vaucouleurs profile than the exponential disk. The derived value of Re is contaminated by residual light from the QSO nucleus in I Zw 1, Mrk 1014, IRAS 07598+6508, and Mrk 231. In the remaining galaxies Re ranges from 1.9 kpc (IRAS 00091-0738) to 9.3 kpc (Mrk 273), with a median of 5.3 kpc. This is larger than that found by Zheng et al. (1998).
Additionally, for each galaxy, an r-1/4 law profile was fit to the outer isophotes, beginning at a radius equal to the FWHM of the PSF. An exponential disk model was also fit. Similar to the result found above with the Sérsic law, it is apparent that these two models fit the ULIGs to a varying degree (see Figures 3 & 4). Those dominated by a bright central nucleus (I Zw 1, Mrk 1014, IRAS 07592+6508, and Mrk 231) are all extremely well fitted by a de Vaucouleurs (r-1/4 ) profile, while an exponential disk fits poorly. In some cases, both the exponential disk and the de Vaucouleurs profile fit the outer isophotes equally well (e.g. IRAS 15206+3342, PKS 1345+12), while in other cases, the outer radii are well-fit by the r-1/4 profile and the inner regions by the exponential disk. Since the inner regions are more affected by dust extinction and resolution effects it is unlikely that this really represents the underlying stellar distribution. There is no obvious trend between far-infrared colors (i.e., “warmness” or “coolness”) and the type of best-fit model; it is not the case that all warm ULIGs have r-1/4 profiles, while the cool have exponential disks, which might have been expected if the two samples had different dynamical ages.
Since the morphologies of the systems are consistent with the remnants of major mergers, this is the expected result since relaxation of the disks results in their assuming a profile approximated by the r-1/4 law. Significant deviations from an r-1/4 law are still seen— specifically, they decrease more rapidly at large radii than might be expected for a de Vaucouleurs profile. Given the relatively sharp, discontinuous edges of the tidal features, which are the most extended parts of the merger systems, this turnover in the brightness profile at large radii probably represents it’s truncation past the maximum extent of the tidal debris. This falloff in intensity is also similar to the behavior expected for an exponential disk, and may be due to incomplete relaxation of the merger remnant (Toomre 1977).
Similar results have been found for merging galaxies in general (Schweizer 1982, Wright et al. 1990, Stanford & Bushouse 1991), and more specifically for ULIGs at R & K- band (Wright et al. 1991, Kim 1995). The latter is not surprising, since it is now known that most ULIGs are merging systems. What is perhaps surprising is that this result is true even at U′ and over a large range of radii extending to as far as 20 kpc. While longer wavelength observations (e.g. near-infrared) trace primarily the older stellar population and hence most of the stellar mass, the U′ observations should trace higher mass stars and sites of intense local star formation. However, an examination of Table 3 indicates that most of the compact features observed at U′ represent only a fraction of the total U′ flux and hence the U′ low surface brightness emission continues to trace the general galactic stellar population. This is similar to the result of Meurer et al. (1995). U′ traces stars with ages of at most a few hundred Myrs, which is similar to the dynamical merger timescale. The existence of an extended smooth stellar population at U′ may indicate that the ULIGs are currently undergoing spheroidal component growth, similar to that observed by Fanelli et al. (1997) and Smith et al. (1996) in the far-ultraviolet in two nearby starburst galaxies.
3.2 Colors and Derived Starburst Ages
3.2.1 Modeled Colors
Table 3 presents the photometric data for the U′ observations, all of which have been transformed to the Johnson U-band from the observed U′ filter. The colors of the observed features were compared to various modeled colors. The U′ colors provide essentially no discriminant between AGN and starburst activity. The synthetic optical QSO model introduced in Paper II predicts (UB, BI) colors for a QSO at the sample median redshift of (0.78, 0.67) and the UVSX sample of Elvis et al. (1994) has colors of (UB),(BI) = (0.82,1.12)(0.16,0.19), which are similar to a modeled instantaneous starburst with an age of 10 Myrs. As discussed in Paper II, long wavelength emission ( 2 m) therefore remains the best possible broad-band color discriminant between AGN and recent star formation activity. Throughout this analysis we will continue to consider the U′ emission as a result of either starburst activity or AGN depending on the results found at other wavelengths (Surace 1998). Larson & Tinsley (1978) find typical (UB) colors for non- interacting galaxies in the RC2 in the range of 0.2 to 0.6, and Guiderdoni et al. (1988) find typical values of (UB) for spirals of 0.03. Such a wide span of colors is probably due to the variable star formation histories of the “normal” galaxies involved. Perhaps a more meaningful comparison can be made to the (UB) colors of individual stellar spectral types: (UB) = 1.15, 1.06, 0.02, 0.07, 0.05, 0.47, and 1.28 for spectral classes O5, B0, A0, F0, G0, K0, and M0, respectively (for stars on the main sequence — the corresponding giant stars are somewhat redder; Allen 1973). Only OB stars can directly contribute to (UB) colors significantly less than 0.
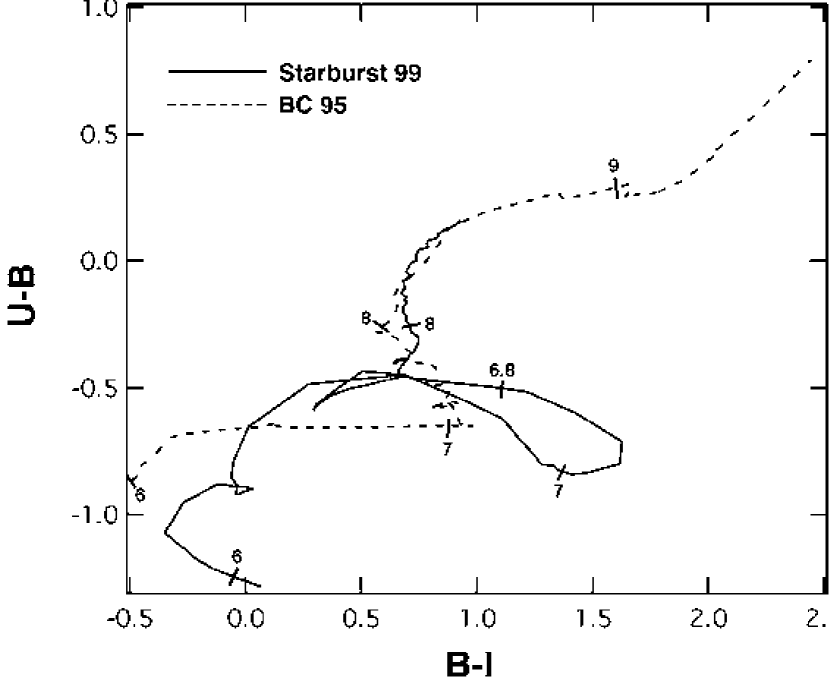
The derived colors are compared to evolutionary synthesis models. Figure 4 illustrates the (UB, BI) colors derived from two of the most popular models: BC95 (first described in Bruzual & Charlot 1993; the updated version is BC95) and Starburst 99 (Leitherer et al. 1999). The BC95 models represent isolated, bare stellar ensembles (photospheres), whereas the Starburst 99 models also include nebular continuum emission, which has an effect at both very short ( 4000Å) and very long ( 1.5 m) wavelengths (Leitherer & Heckman 1995). BC95 extends to much greater ages than Starburst 99, but it is unlikely that any of the star-forming regions observed here are so old. Neither model includes the effects of dust, which will both redden the intrinsic colors and also deplete the nebular continuum. In this paper most of the ages will be based on the BC95 models, since it is easier to understand how processes such as reddening affect the observed colors when applied directly to stars without additional complications such as nebular continuum which may not be well-understood.
The age estimates based on color diagrams of this sort are relatively insensitive to the exact shape of the IMF, which in this case is a Salpeter initial mass function (IMF) with upper and lower mass cutoffs of 125 and 0.1 M☉, respectively.. This is because the colors of a stellar (starburst) ensemble are dominated by the most luminous stars since what is actually observed is a luminosity-weighted average of all the stars in the burst (Leitherer 1996). It would require very extreme changes in the mass index of the IMF in order for late-type stars to dominate the colors by sheer numbers. The low mass end of the IMF primarily acts as a reservoir for the mass of the burst; most of the luminosity is emitted by only a small ( 10%) mass fraction of the burst. Truncation of the lower end of the IMF, therefore, primarily adjusts the luminosity per unit mass of the burst, and thus the rate at which the gas supply is consumed. For example, truncating the IMF at 3 M⊙ in the BC95 model above only increases the bolometric luminosity per unit mass by a factor of 5 and leaves the color evolution almost unchanged until roughly 1 Gyr (at which time the entire stellar population has left the main sequence and therefore becomes very red; Charlot et al. (1993)). Similarly, adjusting the upper mass cutoff from 120 to 60 M⊙ leaves the color evolution unchanged after the first few million years due to the very rapid evolution of the upper end of the IMF. This model is thus likely to be a good one for a typical long-lived stellar population extending from the most massive stars to the least massive. Changing the upper and lower mass cutoffs is likely to only change the bolometric luminosity per unit mass, and even then only by a factor of a few.
The short wavelength colors are most strongly affected by dust and metallicity. Figure 7 presents different metallicity models from Starburst 99 (BC95 assumes solar metallicity). Shown are solar metallicity, twice solar metallicity, and a 0.05 solar metallicity case. Note that the solar and twice-solar metallicity models have nearly the same colors. Given that the local ULIGs appear to be collisions of mature, gas-rich spiral galaxies (Sanders et al. 1988a), it is not implausible that the gas is of near solar-metallicity. Unlike the situation in the near- infrared (i.e., as in Paper II) direct thermal dust emission cannot affect the short wavelength colors as these wavelengths correspond to temperatures far above the dust sublimation temperature. This leaves reddening as the dominant source of color variance.
Two dust reddening models are considered. The first is a simple foreground screen model, where all the dust lies on a path between the emitting source and the observer. The reddening law of Rieke & Lebofsky (1985) was used. This is illustrated in Figure 8 with a solid line vector corresponding to an extinction of 1 magnitude at V-band. Ages for the starbursts are derived by dereddening their observed colors until they intersect the modeled colors for a solar metallicity starburst. Fortunately, objects can only be made more red by extinction, and thus the colors can define upper limits to the stellar ages. However, while this may be a usable extinction model in the near-infrared, at wavelengths as short as U′ scattering may play an increasingly important role. Witt et al. (1992) have shown that for some scattering geometries it is difficult to achieve effective extinctions at U- band much greater than a few magnitudes even when the line of sight extinction is as high as 25 magnitudes. The “dusty galaxy” model of Witt et al. (1992) in which dust and stars uniformly fill a spherical volume was used, and which was also used in the multi-color analysis of Surace et al. (1999). This is motivated by the observed morphology of star-formation in the nuclear regions of these galaxies (Surace et al. 1998,1999). Hill et al. (1995) find that the Witt et al. (1992) “dusty nucleus” model provides a better fit to ultraviolet observations of HII regions in M81. However, this geometry is more appropriate to individual HII regions and not to the galaxy as a whole. In any case, for the maximum possible effective extinctions allowed by the U′ observations the dusty nucleus and dusty galaxy models have nearly identical broadband color properties. Figure 8 illustrates the reddening path of the “dusty galaxy” model in units of total optical depth at V-band of =0, 5, 10, and 15. Qualitatively it is very similar to the foreground extinction model. However, the reddening vector for the dusty galaxy model is slightly flatter due to the decreased effective optical depth at U′ as a result of the increased scattered light component relative to B and I-band. As a result, derived ages based on this model will typically be 20% higher than those based on a foreground screen. All ages quoted here are upper limits based on the foreground dust extinction model, since it is simpler in application.
3.2.2 Observed Colors
The integrated (UB) colors of the ULIGs span a very large range from -0.5 (IRAS 12112+0305) to 1.1 (UGC 5101), with a median of 0.4. Such an enormous range in integrated colors is similar to the Larson & Tinsley (1978) result, and probably does not constrain the galaxies’ stellar populations significantly. Due to the wide range in colors, another approach must be used. It is more meaningful to address the colors of the individual compact high surface brightness features observed in the ULIGs, since these features correspond to the young starburst component of the galactic stellar population. Figure 8 shows the colors of the compact, high surface brightness nuclear regions of the ULIGs presented in Table 3.
The lack of resolved U′ knots among many of the cool ULIGs forces an examination of their “nuclear” colors. In Surace (1998) it was shown that the “nuclear” regions (defined by a diameter of 2.5 kpc) typically had optical/near- infrared colors similar to young star-forming regions with contributions from hot dust and mild (AV= 2–4 magnitudes) of reddening. The median nuclear colors for the cool ULIGs observed at U′ are (UB, BI)=(0.1, 2.1), with (UB) ranging from 1.2 to 0.6. The median age corresponding to the colors of the individual nuclei are 44 Myrs and 35 Myrs for the BC95 and LH99 models, respectively. Although it is not possible to discriminate between AGN and starburst activity based on UBI colors alone, the lack of a K′ excess in the cool ULIGs (Surace 1998) supports the interpretation of the blue (UB) colors as being indicative of young stars. The presence of young stars in the cool ULIG nuclei (and in particular the single nucleus systems such as UGC 5101) indicates the presence of on-going young star formation, in contrast to the tidal tails —if a burst has occurred there it has already faded to the point of undetectability. In several cases U′ knots are resolvable within a radius of 45 kpc of the nucleus. In IRAS 12112+0305 the knots flanking the northern nucleus as well as the knots in the southern arc have dereddened ages of 34 and 6 Myrs, respectively. The southern knot in Mrk 273 has colors most similar to a 1 Gyr old burst (although this seems unlikely due to the fading discussed above), while the western knot appears to be about 200 Myrs. Finally, IRAS 23365+3604 has knots ranging between 3–60 Myrs.
Examining the “warm” ULIGs is more problematic, since there is evidence for AGN activity in the nuclei of all of these systems (Sanders et al. 1988b, Papers I & II), and since AGN have (UB,BI) colors very similar to those of a young starburst. It is therefore likely that any examination of the nuclear (2.5 kpc diameter) regions will simply reflect the presence of AGN light. Instead, we break the warm ULIGs into several subcategories.
The double nucleus systems have the most complex morphology. Of the 3 systems with double nuclei, IRAS 08572+3915 and Mrk 463 each have many U′ knots, while Pks 1345+12 seems to have few. Although this latter case may be a result of the low S/N of our observations, the HST data (Paper I) also shows little in the way of knot structure as well. The knots in the tails of IRAS 08572+3915 appear to have dereddened ages of 5–10 Myrs, while those in Mrk 463 vary from 4-90 Myrs, although the median is only 6 Myrs. The stellar galactic nuclei (based on imaging at other wavelengths) IRAS 08572+3915e and Mrk 463w have (UB, BI) colors of (0.3, 1.6) and (0.5,1.5) yielding dereddened ages of 45 and 25 Myrs, respectively. Similarly, it was shown in Paper II that the optical emission from IRAS 08572+3915w is predominantly starlight, since the AGN only begins to contribute at near-infrared wavelengths. For it we derive a starburst age of 37 Myrs. Pks 1345+12 has integrated colors so red (UB, BI)=(0.8, 2.5) as to be similar to a very old, late-type stellar population, although this could also be the result of AV = 2–3 magnitudes of intervening dust.
The single nucleus systems have simpler morphology with fainter tidal features. The integrated colors of IRAS 010032238 indicate a maximum age of 40 Myrs, although at least some of the knots observed with WFPC2 are at most 5 Myrs in age (Paper I). Of the single-nucleus non-QSO systems, Mrk 231, IRAS 120710444, and IRAS 051892524 have the most well-developed tidal structure, but only the former two have any evidence for resolvable starburst knots. This is probably due to the lower spatial resolution at U′ ; there is evidence in the WFPC2 data (Paper I) for an extended starburst region in the nucleus of IRAS 051892524, but which cannot be resolved here. The estimated age of the southern, presumably stellar, region of IRAS 120710444 is 125 Myrs. The northern region in the vicinity of the putative active nucleus contains several knots of star formation which we cannot resolve here, and which may be quite young. IRAS 152063342’s western half has colors of (0.4, 1.5), which are similar to those of a 20 Myr old burst. The eastern component shows a peculiarly large U′ excess (0.9, 1.6), which may be indicative of contamination by the putative active nucleus (Paper I). The same is likely to be true of the nuclear colors of IRAS 051892524, whose dereddened colors are similar to a 20 Myr old starburst. Mrk 231’s “horseshoe” has dereddened colors similar to a starburst 225 Myrs old. The extended structure in the QSO I Zw 1 appear similar to the spiral arms of a spiral host galaxy. Mrk 1014 has several knots embedded in its tidal tails, 2 of which were detected with WFPC2. Unfortunately, they are sufficiently faint that their colors are not well determined; they are likely to be in the age range 3–30 Myrs. Lastly, the extended features to the south and east of IRAS 07598+6502 were not obviously detected; however, these features were of fairly low effective surface brightness due to the seeing. A careful examination of the region as a whole indicates (UB) similar to a stellar population of 5–10 Myrs.
It is apparent from Figure 8 that most of the “warm” ULIGs have bluer nuclear colors than the “cool” ULIGs. However, their dereddened ages are extremely similar. Thus, while the redder colors might be indicative of greater age, it is more likely that they indicate a greater degree of dust obscuration, either by virtue of more line-of-sight dust or by having a dust geometry less favorable to scattering and thus a greater effective optical depth. This would be consistent with the evolutionary scenario proposed by Sanders et al. (1988a), in which dust is cleared away from the AGN in the warm ULIGs; presumably the same process would clear dust away from the star formation regions as well. The broad-band colors do not show a detectable maximum age difference between the two samples of ULIGs (although this is poorly constrained ). This requires that the dust clearing time be relatively short compared to the timescale of the nuclear burst ( 100 Myrs) in order for the dust geometry to be the dominant color determinant above and beyond the effects of stellar aging.
Figure 9 illustrates the nuclear colors of single vs. double nucleus ULIGs. Unfortunately, several systems known to have double nuclei at other wavelengths either could not be resolved or had confused detections at one or more wavelengths (Pks 1345+12, IRAS 22491-1808, IRAS 12112+0305, IRAS 0119-2307). As a result the density of points in the figure is deceptive. Although the single nucleus systems are of necessarily greater dynamical age, this is not clearly reflected in their nuclear colors which have similar dereddened ages for both types of systems. This would argue against the evolutionary scenario, since it implies that dynamical age is not linked to dust reddening, which appears from the above to be linked to the mid-infrared colors of the ULIGs. However, the blue double nucleus point are strongly affected by IRAS 08572+3915 and Mrk 463. Since exclusion of these would produce different results, it is likely that there are too few galaxies in the sample to as yet draw meaningful conclusions.
3.3 Luminosities
3.3.1 Observed Total U-band Luminosities
The total luminosities Lν at U-band were computed using the conversion that a magnitude zero star has a flux density Fν of 1810 Jy in the U filter (Bessell 1979). The average rest-frame luminosity (i.e. the total amount of energy in units of 3.91033 ergs s-1 in the U-band filter) is Lν= 1010.7 L⊙, while the median is 1010.0 L⊙. This high average value is strongly influenced by the nuclear emission of the QSOs I Zw 1, Mrk 1014, and IRAS 07598+6508. Excluding these three systems yields an average that is also Lν= 1010.0 L⊙. In terms of absolute magnitude, the median is MU= 20.8 and the average is 21.3. These results are consistent with the values extrapolated from the far-UV observations of IRAS 224911808 and IRAS 12112+0305 (Trentham et al. 1999). Given that infrared-selected QSO host galaxies are typically similar in luminosity to their nuclei (McLeod et al. 1994, Surace 1998), the ULIG QSOs are likely to have hosts similar in luminosity to the mean luminosity of the ULIGs.
3.3.2 Contribution of U-band structure to the bolometric luminosity
We consider the probable bolometric luminosity of the observed knots and nuclear regions. The U-band bolometric correction (BC) is relatively robust against changes in the IMF mass cutoffs, since the energetics are dominated by the most massive stars. Indeed, adjustments to the IMF mass cutoffs, while changing the bolometric luminosity per unit mass by a factor of a few, have little effect on color as explained above, and hence the bolometric correction remains unchanged. Throughout the starburst age range of 0-1 Gyr, the bolometric correction at U is predicted by both BC95 and Starburst99 to vary only from about 0.5 to 2, and is very nearly 1 during the span of 10-600 Myrs for the modeled starburst. The likely bolometric luminosity of the star formation observed at U′ was determined by applying the bolometric correction applicable to a given measured emission region based on it’s estimated dereddened upper age limit, which was in turn based on its UBI colors. This was then increased by dereddening by the amount indicated by the UBI colors (typically AV = 1–1.5 magnitudes). These estimates were all based on a foreground dust extinction model.
The cool ULIG bolometric luminosities due to current star-formation were calculated by considering the emission inside the nuclear (2.5 kpc diameter) regions which are known optically to host complex star-forming knots which we cannot resolve here, as well as any observed knots outside this region. The estimated nuclear Lbol ranges from 109.7L⊙ (UGC 5101) to 1011.3L⊙ (IRAS 000910738), with a median of 1010.7L⊙ and 75% lying in the range 1010.4–1010.9L⊙ . The star-formation observed at U′ thus accounts for approximately 3% of the bolometric luminosity in a typical cool ULIG, assuming an average Lbol of 1012.3L⊙(Sanders et al. 1988a). This is extremely similar to the result derived by Surace (1998) from optical/near-infrared wavelengths.
The warm ULIGs’ star-formation budget was tallied by adding up all the emission in the observed knots as well as non-AGN nuclear regions (i.e., IRAS 08572+3915e) and all the nuclear regions where star-formation is believed to dominate at U′ based on WFPC2 B-band imaging (e.g., IRAS 08572+3915w, IRAS 120710444). The warm ULIG bolometric luminosities vary from 109.9 (IRAS 08572+3915) to 1011.7L⊙(IRAS 15206+3342), with a median of 1010.6L⊙. Again, this is similar to results found at other wavelengths. The warm ULIGs (not including 3c273) have a mean Lbol=1012.26L⊙; the average warm ULIG has a contribution of 2% by star formation observed at U′ to the bolometric luminosity, although this number is as high as 30% in at least one case (IRAS 15206+3342).
Estimation of the bolometric luminosity is more problematic in the presence of mixed stars and dust with scattering. Witt et al. (1992) point out that while the effective optical depth at short wavelengths like U′ may be quite low due to scattering, the true optical depth may be many times higher. As a result, while the galaxy may be quite luminous at U′ , a significant amount of longer wavelength emission is absorbed and reradiated in the thermal infrared due to the high total optical depth. In this case, the colors of the ULIGs are consistent with young stars mixed with dust mixed and having a total V-band optical depth of 5—20. The “dereddening” correction will increase the bolometric luminosity by a factor 4—10 greater than that of the foreground screen alone (Witt et al. 1992), and the observed star formation could contribute a sizable fraction of the known bolometric luminosity of the systems. This is unlikely, however. If the observed extended star formation did contribute a significant fraction of the bolometric luminosity, then the galaxies would be extended at every wavelength in a manner similar to that at U′ . However, it is known that the ULIGs become increasingly more compact in the near-infrared (Surace et al. 1999, Scoville et al. 1999) and ultimately are unresolved from the ground at mid-infrared wavelengths (Soifer et al. 1999). Since the latter are near the peak of the spectral energy distribution, this implies that the star-forming knots seen at U′ are not significant contributors to the bolometric luminosity, and that the dusty galaxy model is not a good approximation to the actual dust distribution.
4 Implications for High-Redshift Systems
Our 3410Å observations of low-redshift ULIGs are applicable to observations of high-z galaxies at optical and near-infrared wavelengths. In particular, rest-frame U′ observations correspond to R-band observations at z=0.88 and H-band at z=3.9. Recent observations of the Hubble Deep Field (HDF) with ISO (Rowan-Robinson et al. 1998) have shown that the preponderance of strong mid-IR emitters are apparently interacting, star- forming galaxies. Deep imaging surveys with the Sub-mm Common User Bolometer Array (SCUBA) instrument on the James Clerk Maxwell telescope (JCMT) on Mauna Kea have recently discovered large numbers of sub-mm luminous high redshift galaxies (Smail et al. 1997). The projected star- formation rates for these galaxies are as high as 100 M⊙/year; the ULIGs are the only local analog of starbursts with such high star formation rates (Hughes et al. 1998, Barger et al. 1998). Like the high redshift sub-mm galaxies, ULIGs are also found in interacting systems, and have SEDS with extremely strong far-IR components. Therefore, a more thorough understanding of the properties of ULIGs is likely to be the best opportunity for understanding the properties of these systems at high redshift.
The local ULIGs are observed to have angular diameters as large as 30 kpc. If the high redshift sub-mm galaxies are mergers of L∗ galaxies similar to the low redshift ULIGs, then they will still be resolvable from the ground with diameters of 5″ at z=1 and 6″ at z=3 for a q0=0.5 universe (Peebles 1993). For q0=0 these are 4″ and 3.5″. This is similar in many cases to the observed angular sizes of the optical counterparts of the sub-mm galaxies (Smail et al. 1998). The observed surface brightness of the galaxies is independent of q0 and varies as (1+z)4. The apparent surface brightness of an ULIG at z=0.1 decreases by 2.6 magnitudes at z=1 and 5.6 magnitudes at z=3. The extended tidal structures in the ULIGs have typical surface brightnesses of 21-23 magnitudes per square arcsecond at U′ . The equivalent depth at z=1 in R-band ( 25—27) is easily reached in less than an hour by Keck (Hogg et al. 1997). The brightest U′ extended tidal features at z=3 will have surface brightnesses approaching H=27, and are probably unattainable by ground-based telescopes. However, the new generation of 8m class telescopes, equipped with adaptive optics, will have angular resolutions of approximately 40 milliarcseconds at H. This will provide a physical spatial resolution at high redshift comparable to or higher than that achievable for local ULIGs now from the ground at U′ . The star- forming clusters, which have typical HST resolved sizes of 100 pc (Surace et al. 1998), will still be unresolved. The brightest of these unresolved knots, as well as the nuclei, will approach H=25—26, and will be detectable by a large telescope in 1—2 hours (due to the enormous increase in point source detectability afforded by high spatial resolution imaging in background-limited situations). If the star- forming galaxies now being seen at high redshift are a result of collisions and mergers, then future optical and near-infrared observations of sub-mm luminous star-forming galaxies at high redshift are likely to appear similar in appearance to the U′ observations of ULIGs, with tidal debris and clustered star formation clearly visible. The Smail et al. (1998) results do actually indicate that 6/16 optically identified high-z galaxies are interacting systems similar in appearance to local ULIGs. The ULIG mergers appear in many cases to also fuel an AGN; the rate of apparent AGN activity in high redshift submm- luminous galaxies might indicate whether the merger process, while efficient in fueling a black hole, is also capable of creating new ones. Current estimates of the rate of optically detected AGN in high redshift sub-mm galaxies are 20%. This is similar to the fraction of “warm” AGN-like systems seen in complete samples of ULIGs in the local universe (Kim 1995).
Observers will attempt to morphologically classify their observations of high redshift galaxies. Initial observations at high redshift may be of relatively poor spatial resolution, making it difficult to discern the high surface brightness features seen in many of the images of local ULIGs. Examinations of the radial profiles of objects at high redshift can help discern if they are “elliptical-like” or “disk-like”. As shown in §3.1, if the high redshift systems are similar to those examined here, then they will predominantly have radial profiles intermediate between the two. However, it may be possible to image high redshift star-forming galaxies and determine if their detailed morphologies are consistent with the local merger ULIGs observed here. Preliminary analyses of high-redshift galaxies believed to be undergoing active star-formation (for example, in the Hubble Deep Field) do show evidence for r-1/4 profiles, possibly due to the same merger activity seen in the local ULIGs.
5 Conclusions
1. Many ULIGs are luminous at U′ (median Lν= 1010.0 L⊙) and have evidence for considerable small-scale structure. This structure is almost identical to that seen at optical wavelengths.
2. Many of the double-nucleus systems have luminous knots of U′ emission in their tidal tails, which are absent in the single-nucleus systems. This may indicate that the clustered star-formation in the tails is predominantly brief and occurs early in the merger process prior to the coalescence of the nuclei.
3. The star-forming knots in the cool and warm ULIGs have similar upper age limits (10–100 Myrs), although those in the warm ULIGs are generally consistent with less dust obscuration. This is consistent with greater dust clearing if the warm ULIGs are older systems than the cool.
4. The bolometric luminosity of the star-formation observed at U′ is generally only a very small fraction ( 3%) of the known bolometric luminosity, a result nearly identical to that derived at optical and near-infrared wavelengths. This implies that even over a span of a factor of 20 in visual extinction, the star-forming structure remains similar. Most of the clustered star-formation we can detect at optical and even at near-infrared wavelengths probably occurs in knots that are either not heavily extinguished along the line of sight or have a favorable scattering geometry. The source of most of the bolometric luminosity remains completely hidden at these wavelengths, a result directly supported by mid-infrared imaging (Soifer et al. 2000).
5. The radial profiles of the ULIGs at U′ appear to be similar to a Sérsic profile with index n = 1.8. This is an intermediate form between the exponential disk and the r-1/4 law. This is the expected result for a partially relaxed merger remnant.
6. If they are similar to the local ULIGs, high-redshift ULIGs observed at optical wavelengths will have resolvable tidal structure and star- forming features which can be detected with ground-based telescopes.
Appendix A Notes on Individual Objects
The following notes are provided as a description of the individual targets and to aid in understanding the relationship between the U′ emission and features seen at other wavelengths.
IRAS 000910738 — the U′ emission originates primarily in the stellar “nucleus”, with very little emission coming from the dense tidal tail to the south.
I Zw 1 — the U′ emission originates almost entirely (90%) in the Seyfert 1 nucleus. Both tidal arms can be traced at U′ and closely mirror the B-band morphology. In particular, the two condensations in the NW arm and the bright blue condensation in the SW arm are both easily detected at U′ .
IRAS 010032238 — no features are discernible, which is expected from the small size scale of the extended structure seen in the WFPC2 images (Surace et al. 1998) and the poor ground-based resolution. It’s colors are similar to a starburst of age 10 Myrs.
IRAS 011992307 — both nuclei are detected at U′ , but the emission is dominated by the SW nucleus by roughly 3.5:1. The tidal arms are undetected at U′ .
Mrk 1014 = PG 0157+001 — the eastern tidal arm is very prominent at U′ , breaking into many smaller clumps and knots. The QSO nucleus accounts for about 86% of the total U′ emission. The integrated host galaxy color is UB=0.72, similar to that of old stars.
IRAS 051892524 — the U′ emission essentially mirrors that at all other wavelengths (Surace et al. 1998, 1999). The EW and NS tidal loops are easily seen. There are no apparent knots, although there may be some undetected in the resolved, extended nucleus.
IRAS 07598+6502 — the star-forming knots detected at B are undetected at U′ . The nucleus accounts for 94% of the emission.
IRAS 08572+3915 — large knots of emission trace the leading edges of all the tidal structures for their entire length. Many small knots are seen in the vicinity of the putative NW active nucleus. The SW nucleus dominates at short wavelengths, perhaps indicating that a strong starburst is taking place there. Both nuclei have (UB) 0.25 in a 2.5 kpc diameter aperture; this, combined with their (BI) colors from Surace et al. (1998), indicates the presence of stars that cannot be much more than 100 Myrs old in both nuclei.
UGC 5101 — the U′ emission comes from a complex extended region in the core of the merger system. The tidal tails are barely detectable.
IRAS 120710444 — clearly extended in the same manner as the WFPC2 images. Nearly all the compact U′ emission arises from the northern nucleus seen at B. The southern complex of knots is clearly detected at U′ .
IRAS 12112+0305 — all of the tidal structure seen at B & I is seen at U′ . The condensations in the center of the southern tidal arc are clearly visible. The galactic “nucleus” in the northern part of the system is dominated by a compact knot of emission at U′ , with another knot located on the short tidal arc extending to the west. Most notable by it’s absence is the star-like nucleus in the center of the system, which has completely disappeared between U′ and B-band, implying a line-of- sight extinction greater than 3 AV. This may explain the appearance of the galaxy shortward of 2200 Å, since the Trentham et al. (1999) HST/FOC data indicate almost no detectable emission from the two nuclei themselves.
Mrk 231 — The U′ emission comes almost entirely from the active nucleus and from the southern star-forming “horseshoe”. The horseshoe has (UB)=0, yielding a maximum age of a few hundred Myrs. The corkscrewing structure extending from the NW of the nucleus and wrapping around through the west to the extreme south of the nucleus is also detected at U′ .
Mrk 273 — Although the tidal tails are clearly detected at U′ , nearly all the emission arises in the central few kpc, which contains several large knots of U′ emission which are not seen in the WFPC2 I-band images (Surace 1998) or in CFHT K-band images (Knapen et al. 1997) In particular, the extremely prominent southern U′ knot does not appear in either of these images. The “nucleus” is the luminous source to the north.
Pks 1345+12 — this galaxy is very red ( UB=0.73, BI=2.54) and hence difficult to detect with high S/N at U′ . However, it appears that most of the U′ emission arises in the vicinity of the western nucleus.
Mrk 463 — the eastern nucleus is distinctly elongated N-S, and the western nucleus is elongated E-W exactly as expected from the WFPC2 images of Paper I. Nearly all of the U′ emission in the eastern nucleus comes from the position of the northern “knot”, and not the southern infrared “nucleus” (Surace & Sanders 1999), which is consistent with its interpretation as an AGN ionization feature. Although the eastern nucleus is physically smaller, and hence has a higher peak surface brightness, it is the western nucleus that dominates in overall luminosity at U′ . All of the “knots” identified in the tidal ring structure are extremely luminous at U′ . Their colors indicate ages less than 10 Myrs.
IRAS 143481447 — again, the U′ emission mirrors that at B. The blue knots seen at B surrounding the southern nucleus contribute heavily to the U′ emission in that nucleus, while the northern nucleus has a chain of knots in the base of the northern tail that contribute to the U′ emission.
IRAS 15206+3342 — closely resembles the WFPC2 optical images (Paper I). Most of the U′ emission seems to originate in the compact nuclei in the southern half of the primary “string” of knots, consistent with their blue colors.
IRAS 15250+3609 — the high surface brightness central galaxy component is well detected at U′ , as are the tidal features. Surprisingly, what appeared to be two separate features at I-band now appear to be a single arc bending away from the galaxy to the NE. The nearly circular arc to the south is undetected. The U′ emission is emitted by a compact source in the southern half of the central galaxy nucleus.
IRAS 224911808 — most of the U′ emission originates in the western nucleus and northwestern tidal arm, and corresponds to the star clusters seen at optical wavelengths. Trentham et al. (1999) find that most of the emission shortward of 2200 Åoriginates in the arm.
IRAS 23365+3604 — the U′ emission closely mirrors that at B. All of the knots detected at B are luminous at U′ , and have derived (UB) 0, indicating probable ages of 10 Myrs or less. The tails are almost undetectable; the most prominent extended emission at U′ is the arclike extension of the disk to the NW of the nucleus. Overall, the total integrated galaxy colors are similar to those of an old stellar population.
References
- (1) Allen, C.W. Astrophysical Quantities, 1973, (London: Athlone Press)
- (2) Bahcall, J.N., Kirhakos, S., Saxe, D.H., & Schneider, D.P. 1997, ApJ, 479, 642
- (3) Barger, A.J., Cowie, L.L., Sanders, D.B., Fulton, E., Taniguchi, Y., Sato, Y., Kawara, K., & Okuda, H., 1998, Nature, 394, 248
- (4) Bessell, M.S. 1979, PASP, 91, 589
- (5) Bruzual, G., & Charlot, S. 1993, ApJ, 405, 538
- (6) Bryant, P., & Scoville, N.Z., 1996, ApJ, 457, 678
- (7) Clements, D.L., Sutherland, W.J., McMahon, R.G., & Saunders, W. 1996, MNRAS, 279, 477
- (8) Charlot, S., Ferrari, F., Mathews, G.J., & Silk, J. 1993, ApJ, L57
- (9) de Grijp, M.H.K., Lub, J., & Miley, G., 1987, A&A, 70, 95
- (10) de Grijp, M.H.K., Miley, G., Lub, J., & de Jong, T. 1985, Nature, 314, 240
- (11) Guiderdoni, B., & Rocca-Volmerange, B., 1988, Ap&SS, 74, 185
- (12) Elvis, M. 1994, ApJS, 95, 1
- (13) Elvis, M., Green, R.F., Bechtold, J., Schmidt, M., et al. 1986, ApJ, 310, 291
- (14) Fanelli, M. N. , Waller, W. W. , Smith, D. A. , Freedman, W. L. , Madore, B. , Neff, S. G. , O’Connell, R. W. , Roberts, M. S. , Bohlin, R. , Smith, A. M. , Stecher, T. P., 1997, ApJ, 481, 735
- (15) Hill, J. K. , Cheng, K. -P. , Bohlin, R. C. , Cornett, R. H. , Hintzen, P. M. N. , O’Connell, R. W. , Roberts, M. S. , Smith, A. M. , Smith, E. P. , Stecher, T. P. 1995, ApJ, 438, 181
- (16) Hogg, D.W., Pahre, M.A., McCarthy, J.K., Cohen, J.G., Blandford, R., Smail, I., & Soifer, B.T., 1997, MNRAS, 288,404
- (17) Kim, D.-C. 1995, Ph.D. Thesis, University of Hawaii
- (18) Kim, D-C., & Sanders, D.B., 1998, ApJ, 119, 41
- (19) Knapen, J.H., Laine, S., Yates, J.A., Robinson, A., Richards, A., Doyon, R., & Nadeua, D. 1997, ApJ, 490, L29
- (20) Landolt, A., 1983, AJ, 88, 439
- (21) Landolt, A., 1992, AJ, 104, 340
- (22) Larson, R.B., & Tinsley, B.M., 1978, ApJ, 219, 46
- (23) Leitherer, C. 1996, in From Stars to Galaxies, eds. C. Leitherer, U. Fritze-vonAlvensleben, J. Huchra (San Francisco: ASP), 373
- (24) Leitherer, L., & Heckman, T. 1995, ApJS, 96, 9
- (25) Leitherer, C., Schraerer, D., Goldader, J.D., Delgado, , R.M., Robert, C., Kune, D.F., et al. 1998, in press (Starburst99)
- (26) Low, F.J., Cutri, R.M., Huchra, J.P., & Kleinmann, S., 1988, ApJ, 327, L41
- (27) Meurer, G., Heckman, T., Leitherer, C., Kinney, A., Robert, C., & Garnett, D. 1995, ApJ, 110, 2665
- (28) Murphy, T., Armus, L., Matthews, K., Soifer, B.T., Mazzarella, J.M., Shupe, D.L., Strauss, M.A., & Neugebauer, G. 1996, AJ, 111, 1025
- (29) Neugebauer, G., Green, R.F., Matthews, K., Schmidt, M., Soifer, B.T., & Bennett, J. 1987, ApJS, 63, 615
- (30) Peebles, P.J., 1993, Principles of Physical Cosmology, (Princeton University Press: Princeton), 327
- (31) Perault, M. 1987, Ph.D. Thesis, University of Paris
- (32) Press, W.H., Teukolsky, S.A., Vettering, W.T., & Flannery, B.P., 1992, “Numerical Recipes in C”, (Cambridge University Press: Cambridge)
- (33) Rieke, G.H., & Lebofsky, M.J. 1985, ApJ, 288, 619
- (34) Rowan-Robinson, M.; Mann, R.G.; Oliver, S. J.; Efstahiou, A.; Eaton, N.; Goldschidt, P.; Mobasher, B.; Serjeant, S. B. G.; Sumner, T. .et al. 1997, MNRAS, 289, 490
- (35) Sanders, D.B., & Mirabel, I.F. 1996, ARA&A, 34, 749
- (36) Sanders, D.B., Soifer, B.T., Elias, J.H., Madore, B.F., Matthews, K., Neugebauer, G., & Scoville, N.Z. 1988a, ApJ, 325, 74
- (37) Sanders, D.B., Soifer, B.T., Elias, J.H., Neugebauer, G., & Matthews, K., 1988b, ApJ, 328, L35
- (38) Schweizer, F., 1982, ApJ, 252, 455
- (39) Scoville, N.Z., Yun, M.S., & Bryant, P.M., 1997, ApJ, 484, 702
- (40) Scoville, N.Z., Evans, A.S., Thompson, R., Rieke, M., Hines, D., Low, F.J., Dinshaw, N., Surace, J.A., & Armus, L., 1999, AJ, in prep
- (41) Sersic, J.L., 1968, Atlas de Galaxias Australis (Cordoba: Observatorio Astronomica)
- (42) Smail, I., Ivison,R.J., & Blain, A.W., 1997, ApJ, 490, L5
- (43) Smail, I., Ivison,R.J., Blain, A.W., & Kneib, J.-P., 1998, ApJ, 507, L21
- (44) Smith, D. A. , Neff, S. G. , Bothun, G. D. , Fanelli, M. N. , Offenberg, J. D. , Waller, W. H. , Bohlin, R. C. , O’Connell, R. W. , Roberts, M. S. , Smith, A. M. , & Stecher, T. P. 1996, ApJ, 473, L21
- (45) Soifer, B.T., Neugebauer, G., Matthews, K., Egami, E., Becklin, E.E., Weinberger, A.J., Ressler, M., Werner, M.W., Evans, A.S., Scoville, N.Z., Surace, J.A., & Condon, J.J, 2000, AJ, in press
- (46) Stanford, S.A., & Bushouse, H., 1991, ApJ, 371, 92
- (47) Stockton, A., & MacKenty, J.W., 1987, ApJ, 316, 584
- (48) Surace, J.A. 1998, Ph.D. Thesis, University of Hawaii
- (49) Surace, J.A., Sanders, D.B., Vacca, W.D., Veilleux, S., & Mazzarella, J.M., 1998, ApJ, 492, 116 (Paper I)
- (50) Surace, J.A., & Sanders, D.B., 1999, ApJ, 512, 162, (Paper II)
- (51) Surace, J.A., Sanders, D.B., & Evans, A.S. 2000, ApJ, in press
- (52) Toomre, A., 1977, in “The Evolution of Galaxies and Stellar Populations”, (Yale Observatories: New Haven)
- (53) Trentham, N., Kormendy, J., & Sanders, D.B., 1999, AJ, in press
- (54) Wainscoat, R.J., 1996, “The UH 2.2m Telescope Reference Manual”, (University of Hawaii: Honolulu)
- (55) Whitmore, B., & Schwiezer, F. 1995, AJ, 109, 960
- (56) Wright, G.S., James, P.A., Joseph, R.D., & McLean, I.S., 1990, Nature, 344, 417
- (57) Young, S., Hough, J.H., Efstathiou, A., Wills, B.J., Bailey, J.A., Ward, M.J., & Axon, D.J. 1996, MNRAS, 281, 1206
- (58) Zheng, Z., Wu, H., Mao, S., Xia, X.-Y., Deng, Z.-G., & Zhou, Z.-L., å, in press
U′ images of “warm” Ultraluminous Infrared Galaxies. The images have been smoothed by convolution with a 0.2″gaussian kernel. Minor ticks are 1″, major ticks are 5 ″, and the scale bars represent a physical scale of 10 kpc. Logarithmic contours have been added to illustrate structure in the saturated regions of the grayscale figure.
Same as Figure 1, but of “cool” Ultraluminous Infrared Galaxies.
Azimuthally averaged radial profiles of “warm” ULIGs at U′ . Vertical axis is surface brightness in magnitudes per square arcsecond, while the horizontal axis is radius1/4 in kpc. In this form, an r-1/4 law is a straight line. Solid lines are the best fit de Vaucouleurs profile to the outer regions of the profiles, while the dashed lines are best fit exponential disks.
Same as Figure 3, but presents averaged radial profiles of “cool” ULIGs at U′ .
Sérsic surface brightness profiles for a range of index n with a half- light radius of 2 kpc, typical of many of the systems examined here. Profiles with n2 are very similar at large radii.
Comparison between Bruzual & Charlot BC95 (dashed line) and Leitherer et al. Starburst 99 (solid line) models. Shown are the (UB,BI) colors for an instantaneous starburst with solar metallicity, a Salpeter IMF, a lower mass cutoff of 0.1M⊙, and upper mass cutoffs of 125M⊙ in the former and 100M⊙ in the latter. Although similar in gross behavior, the Starburst99 model predicts consistently redder (BI) colors during the early phase of the burst as a result of nebular emission. The tick marks indicate the age of the starburst in Log(years).
Comparison between Starburst 99 models for 0.05, 1, and 2 solar metallicities (i.e., Z=0.001, 0.02, and 0.04). The near-solar metallicity models are very similar, while the low metallicity model has consistently bluer colors. The tick marks indicate the age of the starburst in Log(years). Note that this figure has a different scale than Figure 6.
Observed ((UB, BI) colors for warm (closed circles) and cool (open circles) ULIG nuclear regions, derived from the observations in Table 3 and the photometry in Paper I and Surace (1998). The known QSOs I Zw 1, Mrk 1014, and IRAS 07598+6508 have been excluded. Also shown are the LH99 starburst model (solid line) and the BC95 starburst (dotted line) and continuous star formation (dashed-dotted line) models. The tick marks indicate the age of the starburst in Log(years). To illustrate the effects of dust reddening also plotted are a reddening vector (solid arrow) corresponding to A 1 magnitude of foreground dust extinction, as well as the effects of mixed stars and dust in units of total V-band optical depth 0, 5, 10, and 15 magnitudes. The derived colors are generally consistent with a young (100 Myr) starburst, regardless of the evolutionary or reddening model.
Same as Figure 8, but for double and single nucleus ULIGs. Squares represent those ULIGs with double nuclei but which do not have separate data points due to the limted spatial resolution at U′ .
Figures 1 & 2 are images and are available in JPEG format from this preprint archive.
| Name | RA | DEC | z | Log LiraaAs given by Kim & Sanders (1998), except I Zw 1 and Mrk 463 which are taken from Sanders et al. (1988b) | Exp. Time | Nucleus | Spectral Class |
|---|---|---|---|---|---|---|---|
| (J2000.0) | L☉ | sec. | |||||
| I Zw 1 | 00:53:34.9 | 12:41:36.2 | 0.061 | 11.87 | 2400 | S | QSO |
| IRAS 010032238 | 01:02:49.8 | 22:21:56.3 | 0.118 | 12.24 | 360 | S | Wolf-Rayet |
| Mrk 1014 | 01:59:50.1 | 00:23:41.5 | 0.163 | 12.53 | 3240 | S | QSO |
| IRAS 051892524 | 05:21:01.5 | 25:21:46.7 | 0.042 | 12.07 | 6720 | S | Sy 2 |
| IRAS 07598+6508 | 08:04:30.5 | 64:59:52.8 | 0.149 | 12.46 | 4000 | S | QSO |
| IRAS 08572+3915 | 09:00:25.4 | 39:03:54.2 | 0.058 | 12.11 | 5040 | D | LINER |
| IRAS 120710444 | 12:09:45.1 | 05:01:13.7 | 0.129 | 12.35 | 3200 | S | Sy 2 |
| Mrk 231 | 12:56:14.2 | 56:52:26.1 | 0.042 | 12.50 | 1680 | S | QSO |
| Pks 1345+12 | 13:47:33.5 | 12:17:24.5 | 0.122 | 12.28 | 3360 | D | Sy 2 |
| Mrk 463 | 13:56:02.7 | 18:22:18.3 | 0.051 | 11.77 | 3240 | D | Sy 1 |
| IRAS 15206+3342 | 15:22:37.9 | 33:31:36.6 | 0.125 | 12.18 | 3480 | S | Sy 2 |
| Name | RA | DEC | z | Log LiraaAs given by Kim & Sanders (1998), Kim (1995) and Sanders et al. (1988a) | Exp. Time | NucleusbbS=single, D=double | Spectral Class |
|---|---|---|---|---|---|---|---|
| (J2000.0) | L☉ | sec. | |||||
| IRAS 000910738 | 00:11:43.2 | 07:22:07.8 | 0.119 | 12.19 | 2880 | S | HII |
| IRAS 011992307 | 01:22:21.4 | 22:51:59.5 | 0.156 | 12.26 | 7200 | D | HII |
| UGC 5101 | 09:35:51.7 | 61:21:11.3 | 0.039 | 12.01 | 4500 | S | Sy 1.5 |
| IRAS 12112+0305 | 12:13:46.1 | 02:48:41.4 | 0.072 | 12.21 | 3240 | D | LINER |
| Mrk 273 | 13:44:42.1 | 55:53:12.7 | 0.038 | 12.10 | 4000 | S | Sy 2 |
| IRAS 143481447 | 14:37:38.7 | 15:00:22.8 | 0.082 | 12.28 | 3240 | D | LINER |
| IRAS 15250+3609 | 15:26:59.4 | 35:58:37.5 | 0.055 | 12.00 | 2520 | S | LINER |
| IRAS 224911808 | 22:51:49.3 | 17:52:23.5 | 0.078 | 12.08 | 3480 | D | LINER |
| IRAS 23365+3604 | 23:39:01.3 | 36:21:09.8 | 0.064 | 12.10 | 4320 | S | LINER |
| Name | AperturebbAperture radii are given where applicable. “Nucleus” values are in most cases for a circular aperture 2.5 kpc in diameter with appropriate aperture corrections. | mU | UB | Log Lν | |
|---|---|---|---|---|---|
| ″ | L⊙(3410Å) | ||||
| IRAS 000910738 | Total | 18.8 | 0.4 | 9.5 | |
| I Zw 1 | Total | 13.7 | 0.8 | 11.0 | |
| IRAS 010032238 | Total | 17.9 | 0.6 | 9.9 | |
| IRAS 011992307 | Total | 18.1 | 0.3 | 10.0 | |
| SW Nucleus | 3.5 | 18.9 | 0.5 | 9.7 | |
| NE Nucleus | 3.5 | 20.1 | 0.2 | 9.2 | |
| Mrk 1014 | Total | 14.7 | 1.2 | 11.4 | |
| Nucleus | 0.5 | 14.9 | 1.5 | 11.3 | |
| IRAS 051892524 | Total | 15.6 | 0.0 | 9.9 | |
| Nucleus | 1.5 | 16.2 | 0.2 | 9.6 | |
| IRAS 07598+6508 | Total | 13.9 | 1.0 | 11.6 | |
| IRAS 08572+3915 | Total | 16.7 | 0.1 | 9.7 | |
| SE Nucleus | 1.1 | 19.2 | 0.3 | 8.7 | |
| NW Nucleus | 1.1 | 19.6 | 0.2 | 8.6 | |
| 4 | 1.0 | 21.1 | 0.2 | 7.9 | |
| 5 | 1.0 | 21.2 | 0.0 | 7.9 | |
| UGC 5101 | Total | 16.0 | 1.1 | 9.6 | |
| Nucleus | 1.6 | 19.1 | 1.2 | 8.2 | |
| IRAS 120710444 | Total | 17.7 | 0.5 | 10.0 | |
| IRAS 12112+0305 | Total | 16.5 | 0.5 | 10.0 | |
| N Nucleus | 1.6 | 18.7 | 0.4 | 9.1 | |
| S Nucleus | 1.6 | 23.2 | 1.6 | 7.3 | |
| 1 | 1.6 | 19.3 | 0.2 | 8.9 | |
| 3 | 1.6 | 19.0 | 0.9 | 9.0 | |
| Mrk 231 | Total | 14.1 | 0.3 | 10.5 | |
| Nucleus | 1.5 | 14.8 | 0.3 | 10.2 | |
| 10/11/12/14/irA | 17.9 | 0.2 | 8.9 | ||
| 5/6 | 18.8 | 0.1 | 8.6 | ||
| Mrk 273 | Total | 15.1 | 0.4 | 10.0 | |
| Nucleus | 1.7 | 17.2 | 0.1 | 9.2 | |
| S knot | 1.7 | 17.9 | 0.3 | 8.8 | |
| W knot | 1.7 | 17.8 | 0.4 | 8.9 | |
| Pks 1345+12 | Total | 17.8 | 0.8 | 9.9 | |
| Mrk 463 | Total | 14.8 | 0.6 | 10.4 | |
| E Nucleus | 1.3 | 16.5 | 0.9 | 9.7 | |
| W Nucleus | 1.3 | 16.8 | 0.5 | 9.5 | |
| 1/2/3/4 | 1.3 | 19.1 | 0.5 | 8.7 | |
| 5/6 | 1.3 | 19.8 | 0.6 | 8.4 | |
| 7 | 1.3 | 20.6 | 0.3 | 8.1 | |
| 8/9/10 | 1.3 | 20.8 | 0.6 | 8.0 | |
| IRAS 143481447 | Total | 16.9 | 0.4 | 9.9 | |
| NE Nucleus | 3.0 | 18.7 | 0.1 | 9.2 | |
| SW Nucleus | 3.0 | 18.0 | 0.2 | 9.5 | |
| IRAS 15206+3342 | Total | 16.2 | 0.6 | 10.6 | |
| E half | 1.3 | 16.5 | 0.9 | 10.4 | |
| W half | 1.3 | 18.1 | 0.4 | 9.8 | |
| IRAS 15250+3609 | Total | 16.2 | 0.0 | 9.9 | |
| Nucleus | 1.2 | 17.0 | 0.6 | 9.6 | |
| IRAS 22491-1808 | Total | 17.2 | 0.7 | 9.8 | |
| W. Nucleus,2,3 | 1.5 | 18.1 | 0.1 | 9.4 | |
| IRAS 23365+3604 | Total | 16.8 | 0.7 | 9.8 | |
| Nucleus | 1.0 | 19.2 | 0.3 | 8.8 | |
| 1 | 1.0 | 19.8 | 0.1 | 8.6 | |
| 2 | 0.5 | 20.7 | 0.8 | 8.2 | |
Note. — Knot identification numbers refer to those in Surace et al. (1998) and Surace (1998), and should be referenced as SSVVM(1998):Number or Surace(1998):Number.
| Name | mid-IRbbW=warm, C=cold, as defined in the text. | Single/Double Nucleus | TailsccAs detected at optical/near-infrared wavelengths (Surace et al. 1998,2000). Knots are as detected at U′ in the extended tail regions seen at I-band (Surace et al. 1999,2000). | Knots in Tails |
|---|---|---|---|---|
| IRAS 011992307 | C | D | Y | N |
| IRAS 08572+3915 | W | D | Y | Y |
| IRAS 143481447 | C | D | Y | Y |
| Pks 1345+12 | W | D | Y | N |
| Mrk 463 | W | D | Y | Y |
| IRAS 12112+0305 | C | D | Y | Y |
| IRAS 224911808 | C | D | Y | Y |
| IRAS 051892524 | W | S | Y | N |
| Mrk 1014 | W | S | Y | Y |
| IRAS 15206+3342 | W | S | N | N |
| Mrk 231 | W | S | Y | N |
| IRAS 00091-0738 | C | S | Y | N |
| IRAS 23365+3604 | C | S | Y | N |
| UGC 5101 | C | S | Y | N |
| Mrk 273 | C | S | Y | N |
| IRAS 15250+3609 | C | S | Y | N |
| IRAS 12071-0444 | W | S | Y | N |
| IRAS 01003-2238 | W | S | N | N |
| I Zw 1 | W | S | Y | Y |
| IRAS 07598+6508 | W | S | N | N |