A spectroscopic study of NGC 6251 and its companion galaxies
Abstract
Measurements of the velocities of galaxies thought to be associated with the giant radio galaxy NGC 6251 confirm the presence of a poor cluster with a systemic redshift of and a line-of-sight velocity dispersion of km s-1. This suggests a cluster atmosphere temperature of , which is not enough to confine the radio jet by gas pressure. The core of NGC 6251 shows strong emission lines of [O III] and H + [N II], but there is no evidence for line emission from the jet (detected in optical continuum by Keel (1988)).
keywords:
galaxies: clusters – galaxies: distances and redshifts – galaxies: individual: NGC 62511 Introduction
NGC 6251 is an mB = (de Vaucouleurs et al. 1991) giant E2 radio galaxy known for its remarkable radio jet, which is aligned (within a few degrees) from pc to Mpc scales (see Readhead, Cohen & Blandford 1978, Perley, Bridle & Willis 1984 and Jones et al. 1986 for pc-scale observations, kpc-scale observations, and both, respectively). Keel (1988) detected the radio jet in optical continuum emission and found that the spectrum was unusually steep. Arguments that the galaxy contains a supermassive black hole with mass (Young et al. 1979) were recently supported by HST observations of the nuclear gas and dust disc on a scale of a few pc (Ferrarese & Ford 1999). NGC 6251 has been described as relatively isolated, but loosely associated with the Zwicky cluster Zw 1609.0+8212.
This cluster, which Zwicky (1968) described as ‘medium compact’ and ‘near’ with a population of 260, was found by Gregory & Connolly (1973) to have two main concentrations. One of them is A2247, listed as a separate cluster by Abell (1958). Like NGC 6251, it lies on the Eastern boundary of Zw 1609.0+8212. Its systemic velocity is 11670 km s-1 (Sargent, Readhead & de Bruyn 1982) and its interest lies mainly in the fact that it contains a striking chain of galaxies. The Western part of the Zwicky cluster surrounds IC 1143. The three galaxies which Gregory & Connolly (1973) ascribed to this cluster segment have velocities close to 6500 km s-1. NGC 6251 appears to depart from this velocity by km s-1, and Prestage & Peacock (1988) concluded that the local galaxy density is so low that any atmosphere would more likely be associated with the galaxy than the cluster.
Birkinshaw & Worrall (1993) observed NGC 6251 with the ROSAT PSPC and detected a spatially unresolved X-ray concentration, containing about 90% of the 0.1–2 keV flux and coincident with the radio core. The remaining 10% of the flux appeared to originate from an extended emission component, probably a gaseous atmosphere with a scale of 3′ (130 kpc)111In this paper we adopt a Hubble constant = 50 km s-1 Mpc-1. FWHM. They obtained a satisfactory fit to the PSPC radial profile by superposing a point source and an isothermal -model. The limited number of counts from the modelled extended emission did not allow a useful gas temperature measurement to be made. However, Birkinshaw & Worrall showed that for the outer parts of the kpc-scale radio jet to be confined by atmospheric pressure, a gas temperature of keV is required. Feature A (the brightest part of the jet, only 10′′– 40′′ or 7 – 29 kpc from the nucleus) can be confined by a gas temperature of keV. The galaxy’s internal stellar velocity dispersion of km s-1 measured by Heckman, Carty & Bothun (1985a) suggests that the stellar gravitational field cannot hold an atmosphere this hot. In this paper, we demonstrate the existence of a cluster associated more strongly with NGC 6251 than Zw 1609.0+8212 based on velocities for 13 galaxies including IC 1143, and we use the velocity dispersion of this cluster to estimate the temperature of the cluster atmosphere. We discuss the consequences for pressure confinement of NGC 6251’s jet.
2 Observations and data reduction
| Object | Name | Coordinates (2000) | Exp.(s) | Date observed | |
|---|---|---|---|---|---|
| R.A. | Dec. | ||||
| 1 | NGC 6251 | 1800 | 22 Sept. 1992 | ||
| 2 | — | 900 | |||
| 3 | NGC 6252 | 600 | |||
| 4 | Zw 367-010 | 900 | 23 Sept. 1992 | ||
| 5 | UGC 10581 | 450 | |||
| 6a | UGC 10464a | 450 | |||
| 6b | UGC 10464b | ||||
| 7 | Zw 367-015 | 600 | |||
| 8 | UGC 10431 | 600 | |||
| 9 | UGC 10604 | 600 | |||
| 10 | Zw 367-016 | 600 | |||
| 11a | UGC 10471a | 600 | |||
| 11b | UGC 10471b | ||||
| 12 | IC 1143 | 300 | |||
| 13 | IC 1139 | 300 | |||
| Slit Position | range | Exp. time | Date observed | Comments |
|---|---|---|---|---|
| Angle (∘) | (Å) | (s) | ||
| 115.3 | 4874–5526 | 1800 | 22 Sept. 1992 | along jet |
| H,[O III], Mgb | ||||
| 115.3 | 6274–6926 | 1800 | along jet | |
| H, [N II] | ||||
| 25.3 | 4874–5526 | 1800 | 23 Sept. 1992 | perpendicular to jet |
| H,[O III], Mgb | ||||
| 25.3 | 6274–6926 | 1800 | perpendicular to jet | |
| H, [N II] | ||||
Observations of the galaxies listed in Table 1 were carried out on the nights of 1992 September 22 and 23, using the Red Channel spectrograph on the Multiple Mirror Telescope (MMT). All images were obtained on a CCD (binned 2/1) with pixels using a long slit of dimensions 180′′. Low-resolution spectra were taken with a 300 line mm-1 grating, which had a useable range of 2560 Å centred on 6000 Å and had spatial and wavelength dispersions of and 3.2 Å per pixel, respectively. A resolution of 10 Å (FWHM) was obtained in this instrument configuration.
The galaxies listed in Table 1 are numbered in order of increasing distance from NGC 6251 (which is object 1). Our sample (which is not complete or magnitude-limited) includes two galaxies with double cores, objects 6 and 11. Although in both cases the two nuclei are listed separately (and labelled a and b), the average redshifts were used as single measurements in subsequent cluster-related calculations, as they are clearly bound systems.
In addition, high-resolution spectra of NGC 6251 were obtained (see Table 2) with a 1200 line mm-1 grating, resulting in a wavelength range of 652 Å and a dispersion of 0.9 Å per pixel. Spectra centred on 5200 Å and 6600 Å were obtained along the radio jet (at a position angle of ) and perpendicular to it (P.A. = ). The resolution of these spectra was 2–3 Å (FWHM). The objective of these observations was to search for emission lines in the optical knots detected in continuum by Keel (1988), and measure the rotation velocity and direction for the stars and gas in the galaxy.
The reduction and analysis of our data were carried out using the Image Reduction and Analysis Facility (IRAF). The CCD images were de-biased, trimmed and flat-fielded using the CCDPROC task. Cosmic ray hits and bad lines or columns on the CCD were removed by interpolating across the smallest dimension of the affected regions with the FIXPIX routine. For the low-resolution case, where only a nuclear one-dimensional spectrum was required, the spectra were sky-subtracted using the BACKGROUND task, then wavelength-calibrated using HeNeAr comparison spectra, traced and extracted with the APEXTRACT package.
The data reduction in the high-resolution case was somewhat complicated by the fact that information in the spatial direction was to be preserved, so that the core spectrum could not simply be traced along the geometrically distorted two-dimensional image. A good alignment (subsequently found to be accurate to typically a few tenths of a pixel) of the dispersion axis and spatial axis with the CCD’s columns and lines, respectively, was carried out using the LONGSLIT package. HeNeAr calibration lines and the trace of the galaxy nucleus were used to fit a two-dimensional geometrical rectification function to the data. This correction was then applied to the image, and 1-D spectra at varying offsets from the core of the galaxy were subsequently extracted.

Figure 1 is an un-fluxed spectrum of the core of NGC 6251 from our low-resolution data.
3 Redshifts
3.1 Measurements
Seven of the fifteen spectra showed emission lines which enabled redshifts to be determined. Table 3 shows which lines were used and the resultant heliocentric velocities. The error bars take account of the scatter of the velocities calculated from the various lines, as well as the errors on the individual line wavelengths. Due to a slight defocussing effect which is particularly noticeable in the emission lines, an error of 10% of the FWHM of the line is included in these latter errors.
We measure the absorption redshifts of the galaxies by the standard method of cross-correlating their stellar spectra with the stellar absorption-line spectrum of an object of known redshift (Tonry & Davis 1979). The cross-correlation was carried out over the wavelength range 5000–5450 Å and 5950–6200 Å (including the Mgb and Na D features while avoiding poorly subtracted night sky lines around 5600 Å) using the IRAF task FXCOR in the RV package.
The template used for the cross-correlation was a very high signal-to-noise spectrum of NGC 7619 obtained from a 600s exposure (with the 300 line mm-1 grating) during the 1992 September 22 observing run. NGC 7619 is a E2 galaxy with a velocity of km s-1 (Huchra et al. 1983). More recent velocities for NGC 7619 (e.g. de Vaucouleurs et al. 1991, Huchra et al. 1995) are in reasonable agreement, so that any systematic error introduced into our results by the choice of template velocity is likely to be less than a few tens of km s-1.
The cross-correlation velocities of the galaxies in our sample are shown in Table 4.
| Object | Emission lines used | ||
|---|---|---|---|
| (km s-1) | |||
| 1 | [O III] 4958, [O III] 5007, [O I] 6300 | 7276 | 75 |
| [N II] 6584 | |||
| 4 | [O III] 4958, [O III] 5007, [N II] 6563 | 6930 | 75 |
| H, [N II] 6584 | |||
| 6a | [O III] 4958, [O III] 5007, [N II] 6563 | 7723 | 47 |
| H, [N II] 6584 | |||
| 7 | [O III] 4958, [O III] 5007, H, | 4141 | 41 |
| [N II] 6584, [S II] 6716, [S II] 6731 | |||
| 8 | [N II] 6563, H, [N II] 6584 | 7635 | 63 |
| 10 | H, [N II] 6584 | 16648 | 51 |
| 11a | H, H, [N II] 6584 | 7128 | 54 |
| Object | Distance from NGC 6251 | |||||||||
| (km s-1) | (km s-1) | (arcmin) | (Mpc) | |||||||
| 1 | 7459 | 22 | 0.0249 | 0.0001 | 260 | 0.67 | 0 | 0 | ||
| 2 | 6913 | 56 | 0.0231 | 0.0002 | 1.21 | 0.052 | ||||
| 3 | 7240 | 46 | 0.0242 | 0.0002 | 46 | 0.11 | 2.33 | 0.101 | ||
| 4 | 7001 | 38 | 0.0234 | 0.0001 | 21.1 | 0.911 | ||||
| 5 | 7223 | 44 | 0.0241 | 0.0001 | 30 | 0.08 | 21.3 | 0.919 | ||
| 6a | 7797 | 43 | 0.0260 | 0.0001 | 567 | 1.46 | 22.3 | 0.964 | ||
| 6b | 7748 | 43 | 0.0258 | 0.0001 | ||||||
| 7 | 4224 | 140 | 0.0138 | 0.0004 | — | — | 33.0 | 1.42 | ||
| 8 | — | — | 432 | 1.11 | 46.8 | 2.02 | ||||
| 9 | 7554 | 56 | 0.0252 | 0.0002 | 353 | 0.91 | 51.8 | 2.24 | ||
| 10 | — | — | — | — | 52.4 | 2.26 | ||||
| 11a | 7158 | 102 | 0.0239 | 0.0003 | 58.7 | 2.54 | ||||
| 11b | 7154 | 52 | 0.0239 | 0.0002 | ||||||
| 12 | 6548 | 40 | 0.0218 | 0.0001 | 121 | 5.21 | ||||
| 13 | 6616 | 71 | 0.0221 | 0.0002 | 123 | 5.29 | ||||
a average velocity of bound binary system used in velocity dispersion calculation
b not cluster members ( km s-1)
c the weak continuum did not allow a good cross-correlation to be carried out
d the peculiar velocity is calculated from the emission velocity
3.2 Comparison of emission and absorption redshifts
Comparing the velocities obtained from emission lines (Table 3) and absorption features (Table 4), it is evident that, although the results are all consistent within the errors, there is a systematic km s-1 (leaving out NGC 6251, which will be considered separately). This could be due to the slight defocussing effect described in section 3. Alternatively it could indicate that the adopted velocity of the template galaxy NGC 7619 is a slight over-estimate (see section 2). Making a correction of 65 km s-1 to the of object 8 (the only emission velocity used in the velocity dispersion calculation) has a negligible effect on the systemic velocity and on .
Part of the unusually high discrepancy between the emission and absorption redshifts for NGC 6251 can be ascribed to this systemic error. The remaining km s-1 difference is in agreement with the results of Ferrarese & Ford (1999), who also find the emission lines to be at a significantly lower velocity than the absorption features. Adding up the gaussian constituents of their fits to the H + [N II] system over all their () HST apertures produces an emission line spectrum which is remarkably similar in shape and position to our nuclear ( aperture) spectrum.
3.3 Comparison of velocities with the literature
The redshifts of several of the galaxies observed here have also been measured by other authors. They are compared to our results in Table 5. There is considerable discord among the velocities, with the most severe disagreement arising when comparing our values to those published in the 1970s and early 1980s.
Of the five galaxies showing serious discrepancies with published values, one (source 7) has consistent absorption and emission redshifts in this paper. We have a very high-quality spectrum for object 3, and the cross-correlation with the template galaxy yielded a high Tonry & Davis ‘R’ factor (an indication of the reliability of the resulting redshift). The coordinates given by Richter & Huchtmeier (1991) for object 8 are 2′ away from the correct position, and Sargent et al. (1982) indicate that they are unsure of the accuracy of their velocity measurement for source 10; in both of these cases, we suspect that target misidentification in the earlier observations may be the reason for the different redshift values.
| Object | This paper | Published values | Reference | ||
|---|---|---|---|---|---|
| km s-1 | km s-1 | ||||
| 1 | 7459 | 22 | 7400 | 22 | Zcat 95 |
| 6900 | 42 | RC3 91 | |||
| 7380 | 100 | SRdB 82 | |||
| 7294 | 60 | SO 81 | |||
| 6900 | 600 | MO 79 | |||
| 3 | 7240 | 46 | 6510 | 100 | SRdB 82 |
| 4 | 7001 | 38 | 6840 | 100 | SRdB 82 |
| 6 | 7773 | 30 | 7789 | 24 | SHDYFT 92 |
| 7710 | 100 | SRdB 82 | |||
| 7 | 4224 | 140 | 17010 | 100 | SRdB 82 |
| 8 | 7621 | 61 | 1774 | — | RH 91 |
| 9 | 7554 | 56 | 7320 | 100 | SRdB 82 |
| 20208 | 184 | GC 73 | |||
| 10 | 16644 | 6 | 7590 | 100 | SRdB 82 |
| 11 | 7156 | 57 | 6930 | 100 | SRdB 82 |
| 12 | 6548 | 40 | 6395 | 143 | GC 73 |
a references:
| Zcat 95 | Huchra et al., 1995, CfA Redshift Catalogue, |
|---|---|
| Harvard-Smithsonian Center for Astrophysics | |
| SHDYFT 92 | Strauss et al., 1992, ApJS, 83, 29 |
| RC3 91 | de Vaucouleurs et al., 1991, Third Reference |
| Catalogue of Bright Galaxies, Springer Verlag: | |
| New York | |
| RH 91 | Richter & Huchtmeier, 1991, A&AS, 87, 425 |
| SRdB 82 | Sargent et al., 1982, unpublished |
| SO 81 | Shuder & Osterbrock, 1981, ApJ, 250, 55 |
| MO 79 | Miley & Osterbrock, 1979, PASP, 91, 257 |
| GC 73 | Gregory & Connolly, 1973, ApJ, 182, 351 |
b mean velocity of two core components, as previous authors did not take account of the double nucleus
c This value is placed between brackets in the SRdB 82 paper, indicating that the authors are not entirely confident about it.
4 Cluster systemic redshift and velocity dispersion
We used the cross-correlation results in Table 4 to compute the systemic redshift and the velocity dispersion of the cluster of galaxies using the method of Danese, De Zotti & di Tullio (1980) and as described by Werner, Worrall & Birkinshaw (1999).
The mean velocity of the cluster was found to be km s-1, equivalent to a redshift . The one-dimensional line-of-sight velocity dispersion km s-1, yields a three-dimensional physical velocity dispersion of km s-1.
Such a low velocity dispersion suggests that the cluster is poor. A comparison with the correlation between and Abell richness class R (e.g. Danese et al. 1980) indicates , corresponding to a population .
As the results in Table 4 indicate, NGC 6251 has a peculiar velocity of km s within the cluster. It is generally believed that giant elliptical radio galaxies dominating clusters are more or less at rest relative to the cluster’s systemic velocity. Although this is consistent at the two sigma level with the data above, there is a reason that the peculiar velocity of NGC 6251 given in Table 4 may be an overestimate. Considering the projected distances of objects 12 and 13 from the rest of the cluster ( 5 Mpc), their comparatively large peculiar velocities (), and their closeness to one another in position and velocity, it seems likely that they are part of the physically-distinct IC 1143 group, and that they should be removed from the velocity dispersion calculations. This leads to a significantly higher systemic velocity for the cluster, km s-1 () with km s-1. In this case, NGC 6251 is one of the slowest-moving members of the cluster with a peculiar velocity of 128 107 km s-1.
5 The dynamics of NGC 6251
Heckman et al. (1985b) measured the rotation curves of several radio-loud and radio-quiet elliptical galaxies to test theories that the rotation axis might coincide with the radio axis in powerful radio galaxies (log 24 W Hz-1). They present rotation curves for NGC 6251 in position angles of and and conclude that the galaxy rotates about an axis at P.A. with a velocity of km s-1.
We measured rotation curves for two position angles, 25.3∘ and 115.3∘ (Table 2), the latter being aligned with the jet. The results of the slit in P.A. = 25.3∘ suggest a slow rotation of the order of 50 km s-1 about the jet, consistent with Heckman et al.’s result in P.A. = 27∘. The velocities along the jet were inconclusive. Deeper observations are required to obtain sufficient signal-to-noise in the outer parts of the galaxy (at a radius 8′′ or 6 kpc) if more precise information on the rotation axis or velocity than that found by Heckman et al. is to be obtained.
6 Line emission along the radio jet?
The jet of the powerful radio galaxy M87 has been detected at optical wavelengths, and many authors report imaging and spectroscopic studies (see Keel 1988 and references therein). Keel subsequently detected optical continuum emission from the NGC 6251 jet, and his B-, V- and R-band fluxes of feature A (10′′– 40′′ or 7 – 29 kpc from the nucleus) imply a spectrum much steeper than M87 or other similar jets.
Our observations were not deep enough to reveal significant continuum emission from feature A, but we searched for line emission from [O III], H and [N II]. No emission lines in the jet were found, at an upper limit (for H) of erg cm-2 s-1 for a range of line widths of Å, respectively. Poor weather prevented us from obtaining the planned, much deeper, exposures.
7 Discussion
7.1 NGC 6251 and Zw 1609.0+8212
Considering our redshifts in the context of the two subsystems that make up cluster Zw 1609.0+8212 (see section 1), it is clear that our sample does not include any members of the subcluster separately listed as A2247 ( km s-1), and situated in the Eastern part of the Zwicky cluster, South-East of NGC 6251. Objects 12 and 13 appear to belong to a slightly closer group or small cluster on the Western edge of Zw 1609.0+8212 and we have accordingly argued for their removal from the velocity dispersion calculations in section 4. Objects 7 and 10 have redshifts unlike those of other objects in the sample, and appear to be more or less isolated field galaxies. This leaves us with 8 companion galaxies (two with double nuclei) near the velocity of NGC 6251, and these seem to form a third sub-cluster within the limits of Zw 1609.0+8212. It is clear that not all the brightest galaxies within Zwicky’s boundary are physically associated.
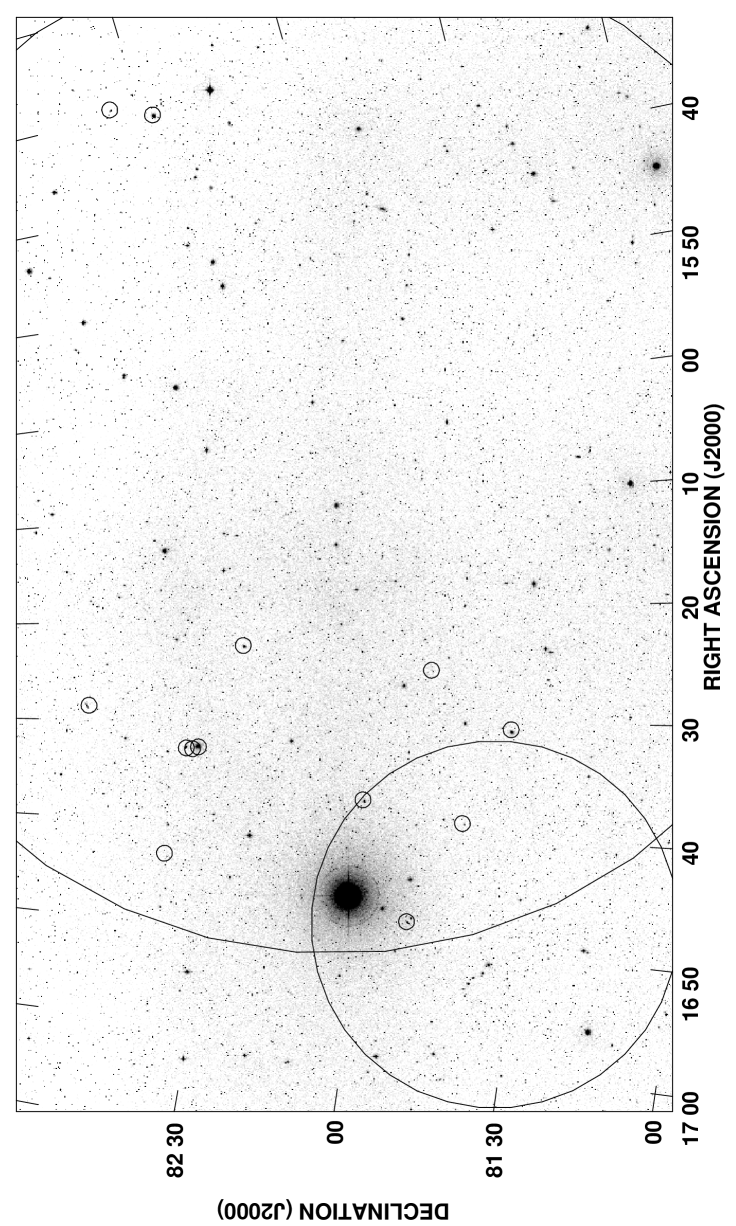
Figure 2 shows the positions of our sources, as well as rough outlines of clusters A2247 and Zw 1609.0+8212.
7.2 Velocity dispersion and X-ray temperature
The one-dimensional velocity dispersion of a cluster of galaxies is related to the X-ray gas temperature of the cluster atmosphere (Lubin & Bahcall 1993; Bird, Mushotzky & Metzler 1995; Girardi et al. 1995). The higher velocity dispersion reported in section 4 corresponds to an X-ray temperature of . The alternative velocity dispersion of km s-1 derived for the cluster without IC 1139 and IC 1143 (which we argue are part of a separate group) suggests a lower gas temperature of .
Comparing this temperature of 0.7 keV with the extrapolated relation of Arnaud & Evrard (1999), we find that it corresponds to a bolometric X-ray luminosity ergs s-1, or ergs s-1 in the band 0.2–1.9 keV. Worrall & Birkinshaw (1994) estimate ergs s-1 for gas within a 3′ (130 kpc) radius. Given the parameters of their -model fit, this correponds to a total luminosity of ergs s-1 for the whole cluster, which is in good agreement with our velocity dispersion via the and relations.
The predicted temperature for the velocity dispersion also agrees with two-component spectral fits based on ROSAT PSPC data (Birkinshaw & Worrall 1993), within the rather large uncertainties. It is clear that the gas that can be confined in this cluster is too cool for static pressure confinement of the radio jet at distances between 5 and 200 kpc from the core.
8 Conclusions
In this paper we have shown that:
-
1.
there is a poor cluster of galaxies associated with NGC 6251; it is one of at least three distinct and not necessarily related sub-clusters of Zw 1609.0+8212;
-
2.
the temperature of the cluster atmosphere inferred from the velocity dispersion measurement is not high enough to provide static pressure confinement of any part of the kpc-scale radio jet (at distances of 5 to 200 kpc from the core) according to the lower limits on jet pressure calculated by Birkinshaw & Worrall (1993);
-
3.
a tentative rotation curve perpendicular to the direction of the jet agrees with that measured by Heckman et al. (1985b); and
-
4.
there is no evidence for [O III], H, or [N II] line emission at feature A on the jet, where Keel (1988) found optical continuum emission.
Better optical spectra of NGC 6251 are needed to probe deeper for line emission and to confirm the tentative dynamical results presented in section 6. Forthcoming X-ray observations should measure the temperature of the cluster atmosphere, predicted to be 0.5-2.0 keV, based on our measurements of the cluster velocity dispersion.
Acknowledgments
Observations reported in this paper were obtained at the Multiple Mirror Telescope Observatory, a facility operated jointly by the University of Arizona and the Smithsonian Institution.
Second Digitized Sky Survey (DSS2) image obtained from the ESO/ST-ECF Archive (http://archive.eso.org/dss/dss).
References
- [1] Abell G.O. 1958, ApJS, 3, 211
- [2] Arnaud M., Evrard A. E., 1999, MNRAS, 305, 631
- [3] Bird C.M., Mushotzky R.F., Metzler C.A. 1995, ApJ, 453, 40
- [4] Birkinshaw M., Worrall D. M., 1993, ApJ, 412, 568
- [5] Danese L., De Zotti G., di Tullio G., 1980, A&A, 82, 322
- [6] de Vaucouleurs G., de Vaucouleurs A., Corwin, Jr. H. G., Buta R. J., Paturel G., Fouque P., 1991, Third Reference Catalogue of Bright Galaxies, Springer Verlag: New York
- [7] Ferrarese L., Ford H. C., 1999, ApJ, 515, 583
- [8] Girardi M., Fadda D., Giuricin G., Mardirossian F., Mezzetti M., Biviano A., 1996, ApJ, 457, 61
- [9] Gregory S. A., Connolly, L. P., 1973, ApJ, 182, 351
- [10] Heckman T. M., Carty T. J., Bothun G. D., 1985a, ApJ, 288, 122
- [11] Heckman T. M., Illingworth G. D., Miley G. K., van Breugel W. J. M., 1985b, ApJ, 299, 41
- [12] Huchra J., Davis M., Latham D., Tonry J., 1983, ApJS, 52, 89
- [13] Huchra J., Geller M., Clemens C., Tokarz S., Michel A., The CfA Redshift Catalogue, Version June 1995, Harvard-Smithsonian Center for Astrophysics
- [14] Jones D. L. et al., 1986, ApJ, 305, 684
- [15] Lubin L.M., Bahcall, N.A. 1993, ApJ, 415, L17
- [16] Keel W. C., 1988, ApJ, 329, 532
- [17] Miley G. K., Osterbrock D. E., 1979, PASP, 91, 257
- [18] Perley R. A., Bridle A. H., Willis A. G., 1984, ApJS, 54, 291
- [19] Prestage R. M., Peacock J. A., 1988, MNRAS, 230, 131
- [20] Readhead A. C. S., Cohen M. H., Blandford R. D., 1978, Nature, 272, 131
- [21] Richter O.-G., Huchtmeier W. K., 1991, A&AS, 87, 425
- [22] Shuder, J. M., Osterbrock D. E., 1981, ApJ, 250, 55
- [23] Sargent W. L. M., Readhead A. C. S., de Bruyn A. G., 1982, unpublished
- [24] Strauss M. A., Huchra J. P., Davis M., Yahil A., Fisher K. B., Tonry J., 1992, ApJS, 83, 29
- [25] Tonry J., Davis M., 1979, AJ, 84, 1511
- [26] Werner P. N., Worrall D. M., Birkinshaw M., 1999, MNRAS, 307, 722
- [27] Worrall D. M., Birkinshaw M., 1994, ApJ, 427, 134
- [28] Young P. J., Sargent W. L. W., Kristian J., Westphal J. A., 1979, ApJ, 234, 76
- [29] Zwicky F. E., 1968, Catalogue of Galaxies and of Clusters of Galaxies, vol. VI, California Institute of Technology: Pasadena