Constraints on dark matter physics from dwarf galaxies through galaxy cluster haloes
Abstract
One of the predictions of the standard cold dark matter model is that dark haloes have centrally divergent density profiles. An extensive body of rotation curve observations of dwarf and low surface brightness galaxies shows the dark haloes of those systems to be characterized by soft constant density central cores. Several physical processes have been proposed to produce soft cores in dark haloes, each one with different scaling properties. With the aim of discriminating among them we have examined the rotation curves of dark matter dominated dwarf and low surface brightness galaxies and the inner mass profiles of two clusters of galaxies lacking a central cD galaxy and with evidence of soft cores in the centre. The core radii and central densities of these haloes scale in a well defined manner with the depth of their potential wells, as measured through the maximum circular velocity. As a result of our analysis we identify self-interacting cold dark matter as a viable solution to the core problem, where a non-singular isothermal core is formed in the halo center surrounded by a Navarro, Frenk, & White profile in the outer parts. We show that this particular physical situation predicts core radii in agreement with observations. Furthermore, using the observed scalings, we derive an expression for the minimum cross section () which has an explicit dependence with the halo dispersion velocity (). If is the mass of the dark matter particle: .
keywords:
galaxies: formation - galaxies: haloes - clusters: haloes - cosmology: theory - dark matter1 Introduction
The predictions of the cold dark matter (CDM) models successfully account for several observational facts such as the distribution of matter on large scales, the uniformity of the cosmic microwave radiation and its small temperature anisotropies, and the measured values of the cosmological parameters. However, on small scales the predictions seem to be in conflict with observations suggesting that modifications to the standard scenario should be introduced. One of the problems of the CDM theory is that the inner density profile of the virialized haloes is too steep with respect to what is inferred from rotation curves of dwarf spiral galaxies (Moore 1994; Flores & Primack 1994; Burkert 1995). In fact it is well known that these galaxies are systems strongly dominated by dark matter, so that their rotation curves are good tracers of the dark halo gravitational potential. A similar situation is expected for low surface brightness (LSB) galaxies (de Blok & McGaugh 1997), (although the observational evidence of a soft core in these cases has been challenged by some authors e.g., van den Bosch et al 1999; Swaters, Madore Trewhella 2000). Similarly, Hernández Gilmore (1998) showed that the HI rotation curves of both LSB and normal large galaxies can be characterized by a significant soft core inner region. The Tully-Fisher relation can be also better predicted by galaxy formation models when a density profile shallower than the CDM one is used (Firmani Avila-Reese 2000; Mo Mao 2000). On the galaxy cluster scale the presence of shallow halo cores is highly uncertain because of the small amount of data available. However, from strong lensing observations of the cluster CL0024+1654, Tyson, Kochansky Dell’Antonio (1998) making a mass map of unprecedented resolution have revealed the presence of a soft core in conflict with the predictions of numerical simulations.
Recently several attempts have been made in order to produce soft cores by a manipulation of the power spectrum of fluctuations. Moore and co-workers (1999b) have tested the effects of introducing a lower cut-off in the power spectrum leading to a halo formation scenario tending towards a monolithic collapse, obtaining final density profiles actually steeper than the one found by Navarro, Frenk, & White (1997, hereafter NFW). However, a lower cut-off in the power spectrum with presence of some tangential velocity dispersion is able to produce haloes with shallow cores (Avila-Reese, Firmani Hernández 1998). Hogan & Dalcanton (2000) introduced the notion of a limiting phase-space density for dark matter as a way to restrict the volume density dark matter particles can attain. An alternative scenario by Peebles (2000) proposes a scalar field dark matter treated as an ideal fluid, in which a suppression of the small scales in the power spectrum is an intrinsic property of the theory. In addition, a model of repulsive dark matter has recently been discussed by Goodman (2000). Spergel & Steinhardt (2000) have proposed collisional CDM as an alternative solution to soft core formation. Several papers have appeared investigating this idea (Hannestad 1999) and the relevance of its astronomical implications (Ostriker 1999). The case in which a very large particle scattering cross-section is assumed was studied within the hierarchical formation picture using fluid dynamical techniques (Moore et al. 2000; Yoshida et al. 2000). In this case dark matter behaves like a non- dissipative fluid that can shock heat producing haloes with singular isothermal cores. If a weaker self-interaction is working between particles during the merger history of the haloes, then core expansion due to a gravothermal instability is expected, as shown with a thermodynamical approach by Firmani and co-authors (2000). Numerical N-body simulations modified to investigate a weak self-interaction have also shown this effect (Burkert 2000).
Another controversial question regarding standard hierarchical structure formation models is that the predicted abundance of galactic subhaloes is an order of magnitude higher than the number of satellites actually observed within the Local Group (Klypin et al. 1999; Moore et al. 1999a). A substantial advance in understanding of this question was made by Moore et al. (2000) and Yoshida et al. (2000). They find that, due to self-interaction, the predicted galactic subhalo number decreases, even if in Yoshida et al. (2000) the decrease appears rather moderate. Interestingly, Moore et al. (2000) point out that in a cosmological picture in which self-interaction is working, ram-pressure could be more effective in producing stripping and viscous drag than tidal forces and dynamical friction. However, treating self-interacting CDM as a fluid with very strong cross section these authors never find soft cores. A more conservative solution to the satellite question, but unrelated to the core problem has been suggested by Bullock et al. (2000).
Given the multiplicity of proposed solutions that have appeared in answer to the core question, we carry out an analysis of the available observational data, in order to identify the proper mechanism for producing soft cores. Taking into account the comparison with observations we conclude that self-interacting CDM appears the most viable solution to produce soft cores. We point out two limiting cases between which dark matter self-interaction may generate isothermal cores: when the cross section is sufficiently large to thermalize the entire halo, and when a minimum cross section allows self-interaction to yield thermal equilibrium only in the core region. In the following section we present the analysis of the observational data, in section 3 we show the density profiles derived from CDM models incorporating manipulations of the power spectrum of the primeval fluctuation field. In section 4 the implications of collisional dark matter are investigated, for the strong and minimum cross section cases. Our conclusions are presented in section 5. The cosmological model we use is flat with matter density , cosmological constant and expansion rate km s-1 Mpc-1 (Saha et al. 1999).
2 Halo core scaling laws from observations
Analysis of the inner halo profile is difficult for most galaxies because of the ambiguities in the estimate of the stellar mass-to-light () ratio and the resulting dynamical contribution of the stellar component to the observed rotation velocities. A further complication is due to the fact that the halo inner density profile is affected by the gravitational pull of the baryonic matter. For these reasons, the best candidates to study galactic dark haloes are dwarf and LSB galaxies, i.e. galaxies which are dark matter dominated. The rotation curves of LSB galaxies derived from radio observations are rather uncertain in the innermost region because of beam smearing (van den Bosch et al. 1999). High-resolution rotation curves, however, have been obtained in for five LSB galaxies (Swaters et al. 2000). These rotation curves rise more steeply in the inner parts than the ones obtained by HI observations. Our analysis is based on a sample of galaxies (i) strongly dominated by dark matter and (ii) with accurately measured rotation curves. The sample consists of six dwarf galaxies, nine LSB galaxies, and two low-luminosity disk galaxies (see Table 1 and the references therein). On galaxy cluster scale, we shall use the mass distribution for the cluster CL0024+1654 derived from strong lensing techniques (Tyson et al. 1998), and for the cluster CL0016+16 derived from weak lensing studies (Smail et al. 1995). In the former case, the spatial resolution attained is high, while in the latter case the observational uncertainty in the central regions is very large. In both cases the inner mass distribution is soft, there is no a massive cD galaxy and one can assume that both clusters are dark matter dominated.
We shall infer from observations the behaviour of the halo core radius and of the central density with the halo maximum circular velocity (the gravitational potential well). All the data we use have been taken from the literature but the parameters we adopt have been estimated from our analysis.
By fitting the observed rotation curves of the sample galaxies after subtraction of the disk contribution to the rotation curve allows us to fit the two parameters of a non-singular isothermal model, and , where is the one-dimensional velocity dispersion. The central density is then: . The properties of the sample objects are listed in Table 1. In the various columns we have: the name, the maximum circular velocity in km/s, the core radius in kpc, the central density in /pc3, and the references used.
It is important to realize that a present day rotation curve is not only the result of an initial dark halo structure, but is a consequence of the process of disk formation, which as it will be shown, can alter the inner shapes of galactic rotation curves. Two effects contribute to changing the density distribution of a dark halo during disk formation, both relevant only in the central regions, precisely where the problem of the existence or absence of a soft core arises. Firstly, as a result of disk formation, the baryonic component contraction makes the baryons in the central regions approximately as dynamically relevant as the dark matter. Secondly, the contraction of the baryons alters the total mass distribution in the inner regions, forcing the dark halo to adjust to the now modified gravitational potential. These two points are essentially well known, and have been treated in standard disk galaxy formation models, e.g. Fall & Efstathiou 1980, Flores et al. 1993; Dalcanton et al. 1997; Firmani & Avila-Reese 2000 and Hernandez & Gilmore 1998 who show explicitly the relevance of the above effects even in the central regions of LSB systems. A detailed modeling of the sample of five galaxies by Swaters et al. (2000) allows us to quantify this possibility, and to asses the evidence supporting shallow cores at this region of the LSB galactic distribution. With such a modeling we can also estimate the uncertainties of our other data. For each of these galaxies we use a simple disk formation model where a fraction of the original halo mass is turned into an exponential disk having the disk scale length of the observed galaxy. The gravitational pull suffered by the inner regions of the initial dark halo is calculated using an hypothesis of adiabatic invariance for the orbits of the dark particles, and the final rotation curve calculated taking into account the modified halo and the contribution of the exponential disk (Hernández Gilmore 1998). The parameters of this disk formation model were optimized using the full observed rotation curves, together with an imposed Tully-Fisher relation (Firmani Avila-Reese 2000) and the observed disk scale radius of the galaxies in question. In this way we solved for the values of F which best yield a final rotation curve. We have modeled these galaxies using two different dark halo structures, namely a NFW profile and a King profile. The analytic NFW profile is with the scale radius corresponding to the scale at which the logarithmic slope is -2. Since and are correlated and they depend only on the mass, the density profiles of haloes can be described by a one-parameter family of models, where the parameter is the mass. The King density profile has the form: , with the central density and the core radius (the radius at which the density is roughly ). The form parameter is , being the relative gravitational potential and the linear velocity dispersion in the center. We adopt the same formalism of Binney Tremaine assuming for f the same function displayed in their Fig.4-9.
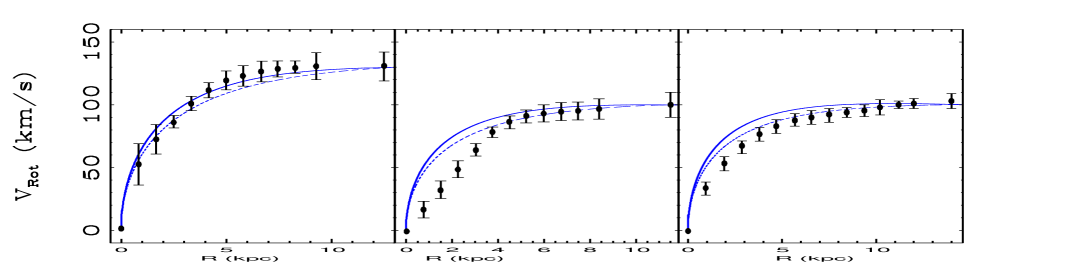
Fig. 1 shows the rotation curves of F568-1, F568-3 and F574-1, in the 1st, 2nd and 3rd panels, respectively (dots with error bars). The dashed curves give the unique CDM NFW halo which has a maximum velocity matching that of the observations, for each galaxy. Panel (1) refers to that galaxy from Swaters et al. (2000) for which the NFW profile fits best. Panel (2) gives the opposite case, where the NFW profile fails completely to reproduce the data. For the remaining three galaxies only marginal agreement between the NFW model and the rotation curves is possible; a representative case of them is given in panel (3).
Due to the disk formation processes modifying the initial halo, however, the comparison made through the dashed curves is far from being a fair one. More representative of a hypothetical reality of NFW profiles is the comparison shown by the continuous curves and the data points. In this case we take the unique CDM NFW profile which after disk formation has the required asymptotic velocity of the observed galaxies. In this case we see that whilst for F568-1 in panel (1) the fit remains good, in the other two cases no agreement is possible, and the NFW option must be rejected.
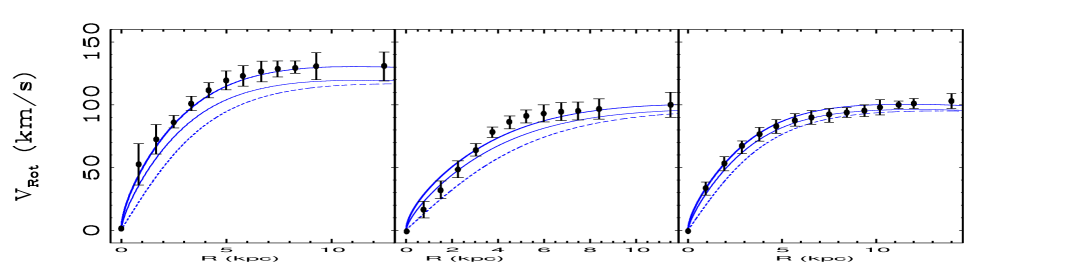
In Fig. 2 we repeat the analysis of Fig. 1, but starting from a non-singular isothermal halo taken as a King sphere with a form parameter that will be determined by the best fit to the observations. The data points remain as in the previous case. The thick continuous curves give the model that after disk formation has the required asymptotic velocity and the proper shape. As it can be seen, the entire sample in this case is quite accurately fitted by the non-singular dark halo taken. The thin continuous curves give the contribution to the final rotation curve due to the dark halo, after being modified by the disk formation. This shows that the final dark halo does indeed dominate the resulting rotation curve, with the exponential disk giving only a minor contribution. The dashed lines give the rotation curve of the initial dark halo, before disk formation took place. This last is given to show the effects of the gravitational pull suffered by the dark haloes as a result of the concentration of the baryons during disk formation. A comparison of the dashed thin curves and then of the thin continuous and thick ones, shows that the two effects which process an initial halo into a final rotation curve are sufficient to alter the conclusions one draws about the existence or not of soft cores. A very naive direct comparison of a NFW model to the final rotation curves might mislead to an acceptance of that profile; a more detailed look at the problem confirms the necessity of initial dark haloes having constant density cores. For both the Fig. 1 and 2 fits, we have found values for the baryon fraction of in which range our conclusions remain unaffected; the resulting King form parameter is .
For the cluster CL0024+1654 (Tyson et al. 1998) and have been computed transforming the non-singular isothermal density profile to a surface density distribution, and then fitting this distribution to the one deduced from lensing analysis. We have obtained the following value for the core radius: kpc. Concerning the central density, we have derived /pc3, but taking into account that strong lensing could overestimate the real value of the central density by up to a factor (Wu et al. 1998), we take /pc3. The value of the maximum circular velocity is estimated assuming , where is a measure of the extent of the virialized region defined as the radius within which the average density is times the background density, and is the virial mass within . We use and Mpc (Bonnet et al. 1994). For the galaxy cluster CL0016+16 we have only an estimate of the central density with large error bars. It is therefore difficult to provide an estimate of the core radius owing to the large observational uncertainties.
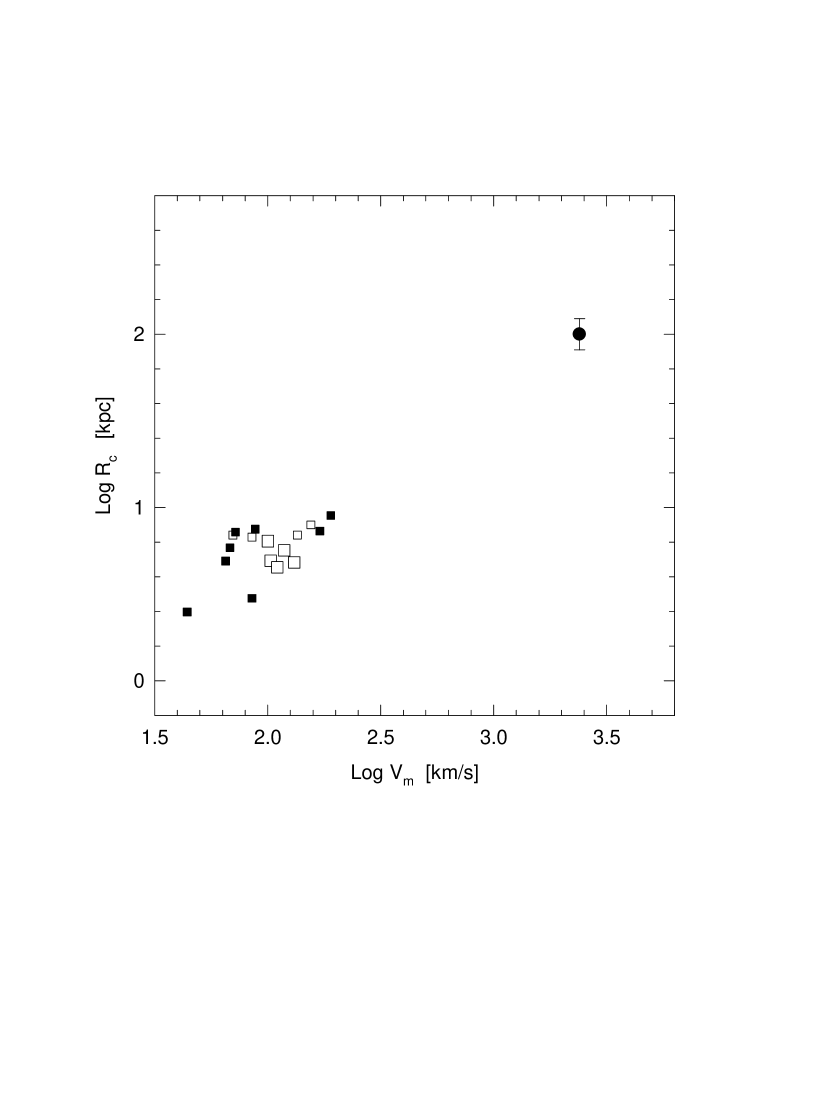
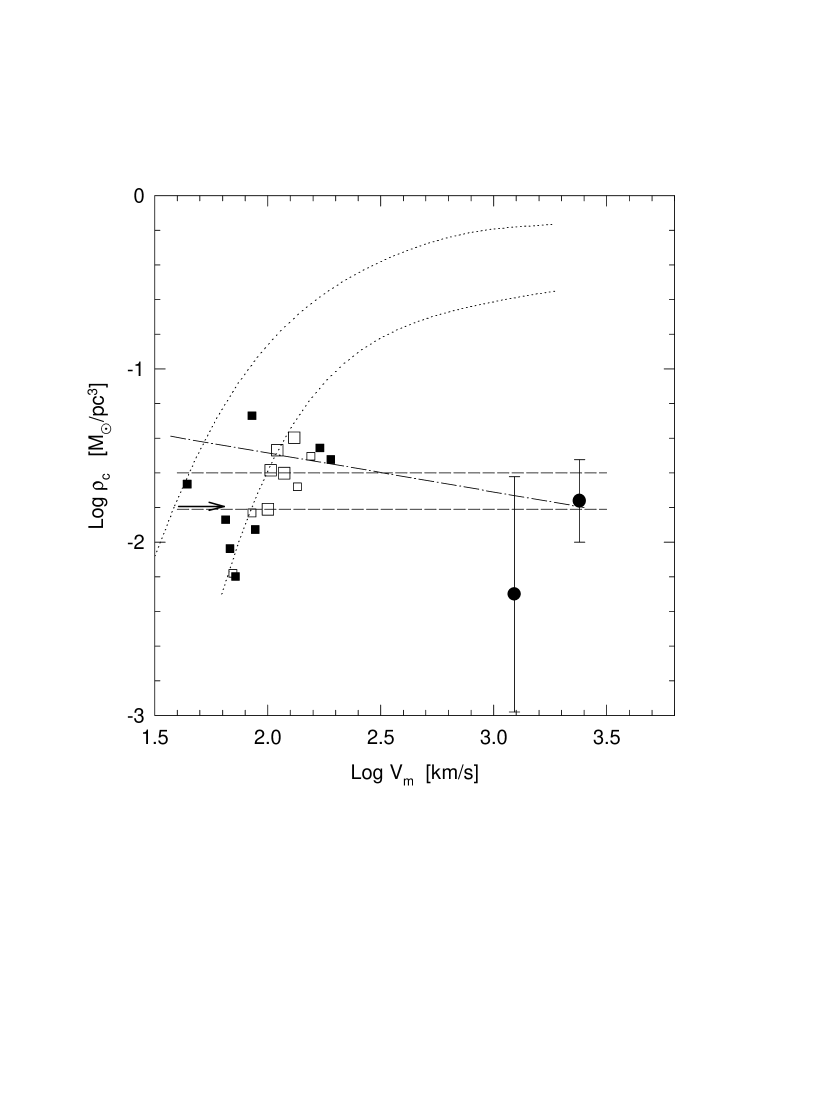
In Fig. 3 we plot vs. for our sample of dwarfs (filled squares), LSB galaxies (empty squares), and the CL0024+1654 cluster (filled circle). Although with some scatter, Fig. 3 shows that scales as . In Fig. 4, vs. is plotted for the same objects of Fig. 3. The arrow shows a fiducial value derived for a sample of LSB galaxies (de Block McGaugh 1997). As can be clearly seen from Fig. 4, the halo central density does not correlate with the halo size. Although with a large dispersion, one can say that the central density of the haloes falls close to /pc3.
The core radius and central density obtained after a careful decontamination process of Swaters et al. (2000) data (big empty squares) are again in the range of our estimates described previously for the larger body of data, showing in fact a somewhat reduced dispersion. This leads us to expect that if sufficient information were available on the systems of our larger data set, a more detailed reconstruction of their parameters would similarly lead to a reduced scatter and not show any systematic offsets.
| (km/s) | (kpc) | (/pc3) | Ref. | |
|---|---|---|---|---|
| DDO105 | 88 | 7.5 | (3) | |
| DDO154 | 44 | 2.5 | 0.028 | (1) |
| DDO170 | 65 | 5 | (2) | |
| NGC3109 | 70 | 5.7 | 0.014 | (4) |
| NGC5585 | 85 | 2.8 | 0.08 | (6) |
| IC2574 | 70 | 6.5 | 0.01 | (5) |
| F563-v2 | 110 | 4.52 | 0.034 | (8) |
| F568-1 | 131 | 4.81 | 0.04 | (8) |
| F568-3 | 100 | 6.4 | 0.016 | (8) |
| F568-v1 | 118 | 5.66 | 0.025 | (8) |
| F571-8 | 135 | 7 | 0.024 | (7) |
| F574-1 | 103 | 4.92 | 0.026 | (8) |
| F583-1 | 85 | 6.8 | 0.01 | (7) |
| F583-4 | 70 | 7 | 0.007 | (7) |
| UGC5999 | 155 | 7.4 | 0.024 | (7) |
| 531-G22 | 190 | 9 | 0.03 | (9) |
| 533-G4 | 170 | 7.3 | 0.04 | (9) |
| CL0024+1654 | 2400 | (10) |
(1) Carignan Purton 1998; (2) Lake et al. 1990;
(3) quoted by Moore 1994; (4) Jobin Carignan 1990;
(5) Martimbeau et al. 1994; (6) Cote et al. 1991;
(7) de Block McGaugh 1997; (8) Swaters et al. 2000;
(9) Borriello Salucci 2000;(10) Tyson et al. 1998.
Fig. 1-4 show basic properties of the nature of dark haloes, albeit the scatter seen, which theory must address. In a previous work we have shown that a possible physical mechanism capable of yielding the observed scale invariance for the halo central density (Fig. 4) is the self-interaction of the cold dark particles (Firmani et al. 2000). Next section is dedicated to a review of other processes that have been suggested for producing shallow cores, which however, can be ruled out because of their disagreement with the scale invariant behaviour of the halo central density.
3 Collisionless CDM models
The hierarchical CDM scenario of structure formation successfully explains most of the main properties of the local and high-redshift universe. However, this scenario does not allow the presence of soft cores in the dark haloes, a point of conflict with the observations. Here we explore some general alternatives for solving this conflict, without going much into the detailed physical mechanisms.
A cut-off in the power spectrum of fluctuations at some scale, which avoids the formation of small dense substructures could be expected to yield soft cores. Such a cut-off appears naturally in warm dark matter scenarios where dark matter particles remain relativistic until relatively late times.
In this section our goal is to show that a manipulation of the power spectrum of the primeval density fluctuation field fails in producing haloes with both soft cores and nearly constant central densities, over the entire mass sampled in Fig.4.
Recently Moore and co-workers (1999) using N-body techniques have simulated CDM haloes taking a lower cut-off in the primeval power spectrum of the fluctuation field as in a warm dark matter universe. In this case virialized haloes with steep density profiles are formed with an asymptotic central slope . From our point of view this result is basically related to the lack of particle angular momentum. In a similar vein, Huss and co-workers (1999) have investigated several structure formation scenarios ranging from hierarchical clustering to spherical radial collapse as a function of the velocity dispersion, using N-body simulations. For steep initial overdensity profiles they never find virialized haloes with a shallow core. However, for spherical collapse with presence of high velocity dispersion, this authors find a final profile which is slightly shallower than NFW. Avila-Reese and co-workers (1998) studied the effects of a lower cut-off in the power spectrum with the addition of some thermal energy. They find a NFW profile with a central shallow core, however the scaling properties of the model do not agree with the observations of dwarf and LSB galaxies.
We stress that a particle tangential velocity dispersion component (angular momentum) could play a key role in producing soft cores. Hence, we have analyzed extensively the question investigating the implications of a lower cut-off in the power spectrum of the cosmic fluctuations with the the contribution of some tangential velocity dispersion. We have performed a quantitative study with dark matter profiles obtained by using a semi-numerical method (Avila-Reese et al. 1998, for details) that allows us the calculation of spherically symmetric virialized structures starting from an arbitrary mass aggregation history (MAH). The virialized profile of the dark halo is obtained from a generalized secondary infall model including non-radial motions for the dark matter particles (tangential velocity dispersion) and taking into account dynamical matter redistributions through an adiabatic invariance hypothesis. The only free-parameter of the method is the orbital perihelion to aphelion ratio which is a measure of the thermal energy related to the tangential velocity dispersion of particles. The parameter is rather important in establishing the central density profile, since it determines the approaching of each particle to the center. We set this orbital parameter to the same value provided by N-body simulations: , and for a CDM model we obtain mass distribution profiles of virialized structures in agreement with results of numerical simulations (see also Ghigna et al. 1998).
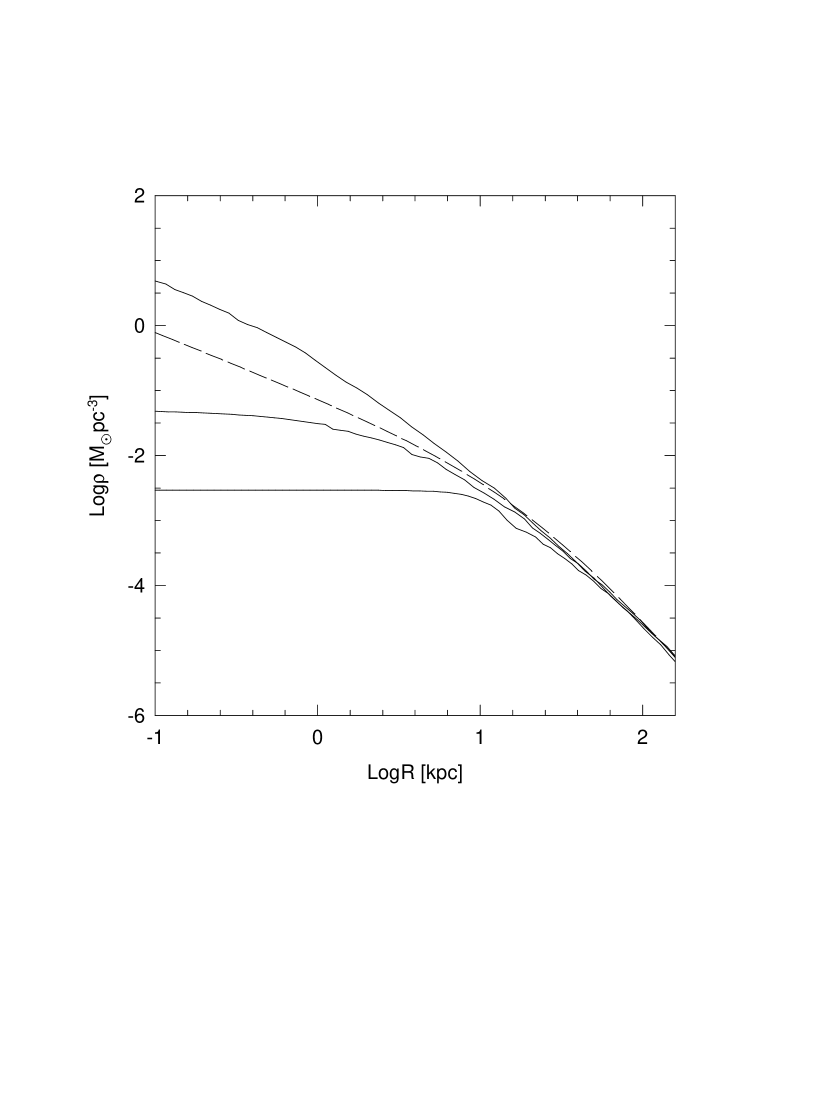
Fig. 5 shows the density profile of a halo assuming obtained with a cut-off in the power spectrum for masses lower than and for the upper,the middle and lower curve, respectively; the dashed line is the NFW profile. It is interesting to note that when increases, a soft core appears. With decreasing giving a more radial motion for the halo particles, the density profile appears to converge to Moore et al.’s result.
In Fig. 4 we show the central densities of haloes as a function of their maximum rotation velocities, dotted curves, as predicted by the halo structure resulting from a cut-off in the power spectrum at (upper dotted curve) and at (lower dotted curve) both with . As shown by the plot, only the soft cores of galactic haloes (LSBs and dwarfs) are reproduced by the model, with the best fit being for a very high mass cut-off at . The model with the value of fixed above, does not predict a scale invariant central density. One might propose an alternative model where increases with mass, however, haloes with masses much larger than the cut-off mass assemble most of their mass hierarchically and for this case, even with , the formation of significant soft cores is not predicted. On the other hand, the value of , which in the hierarchical case is accounted by the inhomogeneous collapse is not easy to justify for haloes formed monolithically. Although in a warm dark matter scenario particles have a residual thermal velocity dispersion, these velocity are not enough large as to produce . Summarizing, in a warm dark matter scenario, haloes near the cut-off scale can be shallower than the CDM ones, but for larger haloes the invariance of the central density with mass is not predicted. This conclusion was recently confirmed using cosmological N-body simulations (Colìn, Avila-Reese Valenzuela 2000).
Exploring an alternative approach we have computed halo density profiles truncating the hierarchical halo mass aggregation histories at a fixed formation redshift, . In this process we assume that the halo mass fraction accumulated up to in a CDM mass aggregation history actually collapses at . In this monolithic collapse we assume the same orbital parameter as above, , while the residual mass is aggregated at the normal hierarchical rate. The aim of this experiment is to show that there is a correlation between the observed central density and core formation redshift of haloes. In Fig. 4 we show the halo central densities as a function of the maximum circular velocity as derived by a mass aggregation history starting from (upper dashed curve) and (lower dashed curve) and evolving until now with the same average aggregation history derived from the hierarchical scenario. The result shows a surprising coincidence between this model and observations. In light of this result, a central scale invariant dark density could be explained if both galaxy and cluster dark cores collapsed at . It is interesting to note that most of distant observed QSOs and galaxies are at this redshift. Although naively attractive, a physical process that allowed the monolithic collapse of structures at and not before or after this epoch scarcely appears plausible.
Finally, Hogan & Dalcanton (2000) proposed the existence of a limiting phase-space density for dark matter, which would have been fixed at the epoch of creation. They explore extensively the cosmological origins and implications for this assumption, and conclude that it can be accepted or rejected depending upon whether observations confirm the halo scalings this hypothesis implies. On purely dimensional arguments we can estimate the scalings the maximum volume density of dark matter would show in this situation as follows: the hypothesis of a limiting phase -space density,
yields,
where is the dark matter particle mass. At constant we immediately obtain,
which is the scaling property derived by Hogan & Dalcanton (2000) for this assumption. An identification of with the core density of dark matter haloes implies a steep scaling of with , again in conflict with the observational data shown in Fig. 4. An agreement of this approach with the observations requires .
4 Collisional CDM models
The success of CDM models at explaining most properties of the universe on large scale suggests a viable solution to the core problem assuming a self-interacting CDM without dissipative properties as recently proposed by Spergel Steinhardt (1999). The core-less NFW density profile, result of the hierarchical process of accretion of haloes via merging of smaller structures, shows a velocity dispersion (temperature) that increases outwards (Cole & Lacey 1996; Fukushige Makino 1997). Consequently, supposing that CDM particles are self-interacting, heat transfer towards the central region triggers a thermalization process in the dark haloes, avoiding the formation of a cuspy NFW profile. Since gravitational systems have a negative specific heat capacity, heat transfer inwards leads to a cooling of the core, amplifying the temperature gradient. Thus, the heat transfer inwards increases, making this a runaway process. The expansion of the core is based on this physical process if dark matter particles are collisional. This mechanism is similar to the post-collapse gravothermal instability that characterizes the dynamic evolution of the core in globular clusters (Bettwieser & Sugimoto 1984). During this process a minimum central density is reached after a thermalization time.
The core expansion may halt because particle-particle interactions become negligible once the core density decreases in such a way that thermal conduction no longer applies. On the other hand, if self-interaction is stronger, then an isothermal state could be established along the entire halo. In one more extreme case the core collapse phase (gravothermal catastrophe) is possible. Once the velocity distribution of the particles reaches a constant velocity dispersion under the effects of collisions the result is a central non-singular isothermal density profile. Any further tendency towards the core gravothermal catastrophe may be avoided by the competition between: 1) mass and energy aggregation determined by the halo merging history and 2) a thermalization by self-interaction. The mass and the energy aggregation tends to recover a NFW density profile (with the corresponding heat transfer inwards) while the self-interacting process tries to establish thermal equilibrium.
We argue that the thermalization process could be the physical mechanism to explain the presence of shallow cores in dark haloes. The goal of this work is to analyze the final density profiles of virialized haloes in two opposite cases: 1) when a global thermal equilibrium is reached resulting in a totally thermalized halo well-fitted by a King model; 2) when the self-interaction is less effective leading to a local thermal equilibrium. These cases are two opposite situations in which dark matter self-interaction may generate non-singular isothermal cores compatible with observations. The first case requires a self-interaction cross section sufficiently large in order to reach a global thermal equilibrium while in the second, a minimal cross-section is necessary to induce the thermal equilibrium only in the core region.
The possibility that a stronger self-interaction is working has to be excluded. Such extreme assumption may lead the core to the gravothermal catastrophe making the cusp problem worse. The case of very strong cross section was studied by Moore and co-workers (2000) and Yoshida and co-workers (2000) making use of N-body simulations and treating the dark matter as a hydrodynamical fluid. Both works show that in these limits dark haloes would develop singular isothermal density profiles which are not in agreement with the observations.
4.1 King model scaled to CDM haloes
A global thermal equilibrium is reached when the self-interaction cross section is large enough in order for the characteristic time scale of collisions across the overall halo to be shorter than the halo lifetime. This is the case of a very efficient self-interaction that in a Hubble time leads halo particles to assume a Maxwellian velocity distribution and to a virialized halo density profile well fitted by a King model.
We have used the King profile in a cosmological context. For a given halo mass, we use the King sphere model with the corresponding total potential energy predicted by the mass aggregation history of the hierarchical theory. In this sense the King model has to be considered cosmological. Being the King model depending on three parameters: , and P, and since the mass and the potential energy of the halo introduce two conditions, one parameter can be freely fixed, e.g. .
According to Fig. 4, we assume that does not depend on mass. So, given the mass, the potential energy and the central density, the core radius is univocally determined. In Fig.6 the dotted curves overlaid to the observations represent core radii obtained adopting a King profile with the central density fixed to values: /pc3 (upper curve); /pc3 (middle curve) and /pc3 (lower curve). Vertical dotted lines are the virial masses increasing by a factor of ten from to from left to right.
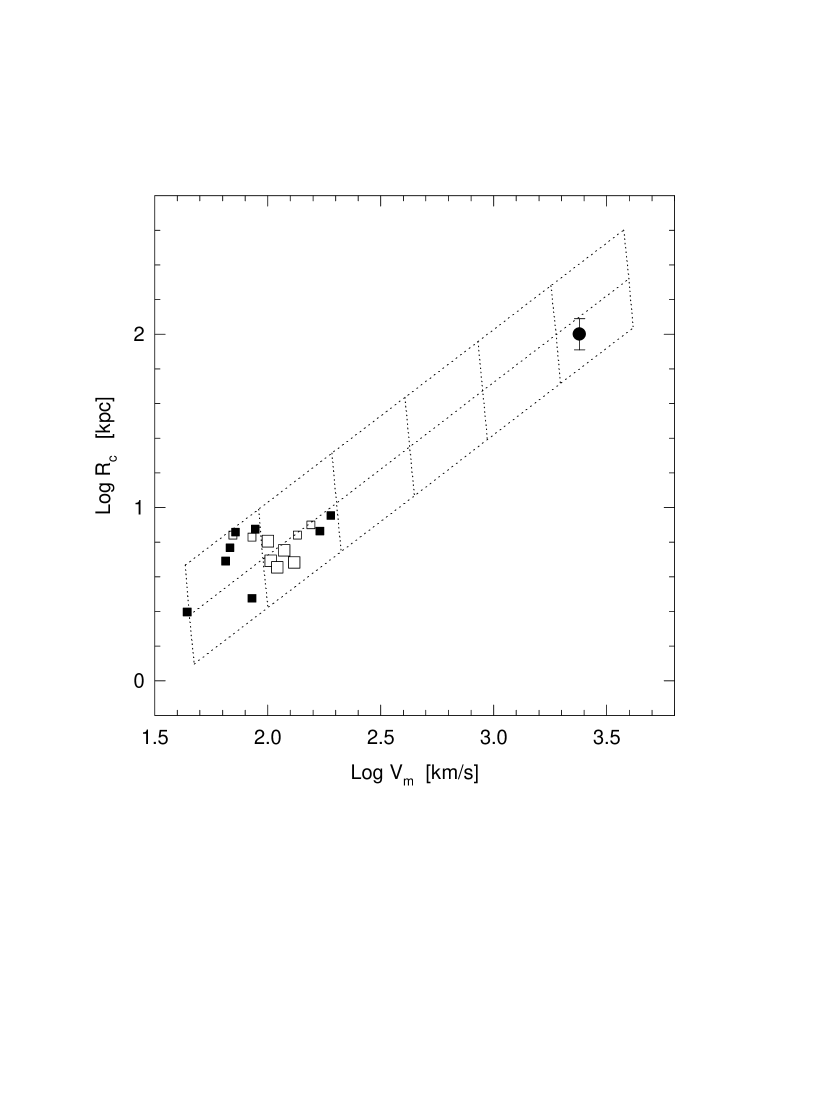
In that figure one sees that a good agreement with observations is obtained for the scaled King models with /pc3. The figure shows that the King model is successful in reproducing halo core radii for the clusters of galaxies; on galactic scales the coincidence between predictions and the observed trend seems even better.
For each scaled King model we have computed the average form parameter , and 9 for the upper, middle and lower curves in Fig. 6, respectively. This detail seems interesting because the case of maximum entropy for a King profile corresponds to a value for the form parameter , just when the halo central density is close to the value of /pc3. From this point of view one could conclude that most galaxies and galaxy cluster are close to the state of maximum entropy.
In this sense, the King model is capable of predicting the halo central density scale invariance.
The expected halo central density behaviour is showed with the point-dashed line in Fig.4 .
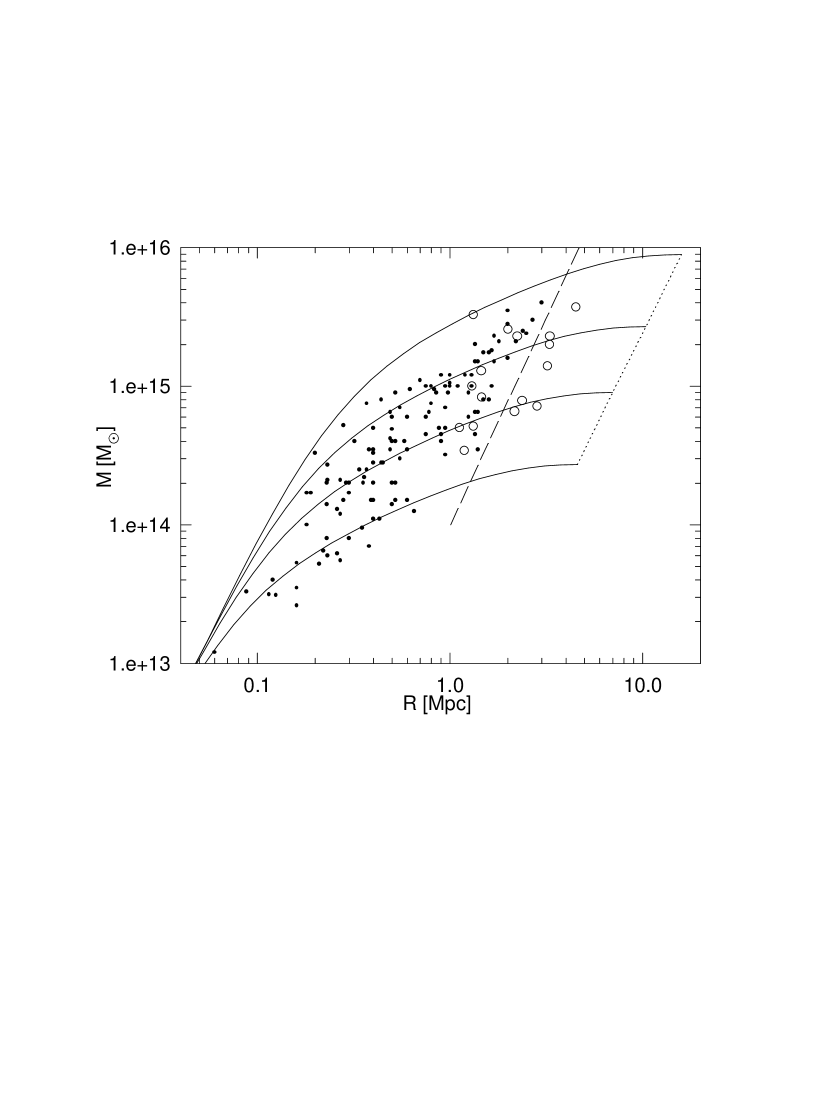
Always with the purpose of testing the prediction capabilities of the cosmological King model, we have investigated how realistic is a King configuration for the dark mass distribution in galaxy clusters. We have compared mass profiles for clusters of galaxies derived by weak lensing data to the predictions of the King model, with the same mass and energy provided by the hierarchical halo aggregation history and P=8.5 In Fig.7, the dark mass distributions expected in a -dominated universe are shown with solid lines while points are for mass profiles of 29 clusters derived from a published sample (Wu et al. 1998). With solid lines we show the predicted mass profiles for haloes with the following virial masses: (lower line); (upper line). No relevant discrepancy appears for the mass profile of clusters, in particular for objects with a moderate dispersion velocity. This result is in agreement with the analysis of the outer part of galaxy clusters made using lensing techniques as inferred by several authors, inspite of their having used the singular isothermal sphere model (Williams et al. 1999; Clowe et al. 2000). The correlation between and derived within the hierarchical picture is plotted in Fig.7 with a long-dashed line. Obviously, the criterion used to define the virial radius for a cosmological King profile is the same as in the hierarchical framework. The open circles drawn in the figure represent virial masses of observed clusters as inferred by Carlberg (1996), while King radii (dotted curve) are indicated to complete the picture.
The crucial shortcoming of this model is that if a thermal equilibrium is reached over the entire halo, we should expect that haloes will be spherical for an extensive region. This prediction strongly disagrees with observations of anisotropies for dark mass distribution of the cluster MS21137-23, over nearly kpc, as argued by Miralda-Escudé (2000).
In summary, a cosmological King mass profile as an idealized model to represent a thermal equilibrium extended to the overall halo appears promising in predicting a thermal equilibrium of maximum entropy and producing halo central densities with a scale invariant property. Taking into account that a strong self-interaction is not needed to generates shallow cores, but these may be produced even when thermalization is limited to the halo inner region. We find it more realistic and likewise interesting to investigate this alternative possibility.
4.2 A non-singular NFW profile
Of great interest is the case when particle collisions induce thermal equilibrium limited to the region of the shallow cores. This represents the physical situation when a minimal cross section is given. From a theoretical point of view in this case, the central core is thermalized and results in a non-singular isothermal sphere while in the outer part of the halo the behaviour is provided by the hierarchical theory of halo merger history represented by a NFW profile. This is the situation in which the thermalization process has a low efficiency and identifies a region limited by a thermal radius, . This length is not necessarily equal to the core radius and as we will see latter may be half as large.
With the intention of a more quantitative study of this physical situation we have calculated a profile representative of a local thermalization in the inner region of the halo. We assume a mass density distribution characterized by NFW profile in the outer part linked to a non-singular isothermal sphere in the core (see Binney Tremaine, table 4-1). Starting from the hydrostatic equilibrium equation the profile is obtained constraining two fitting conditions: the continuity of the mass density distribution and of the pressure, in passing from the NFW profile to the isothermal sphere. The advantage of such non-singular NFW profile is that it represents the most economical approach.
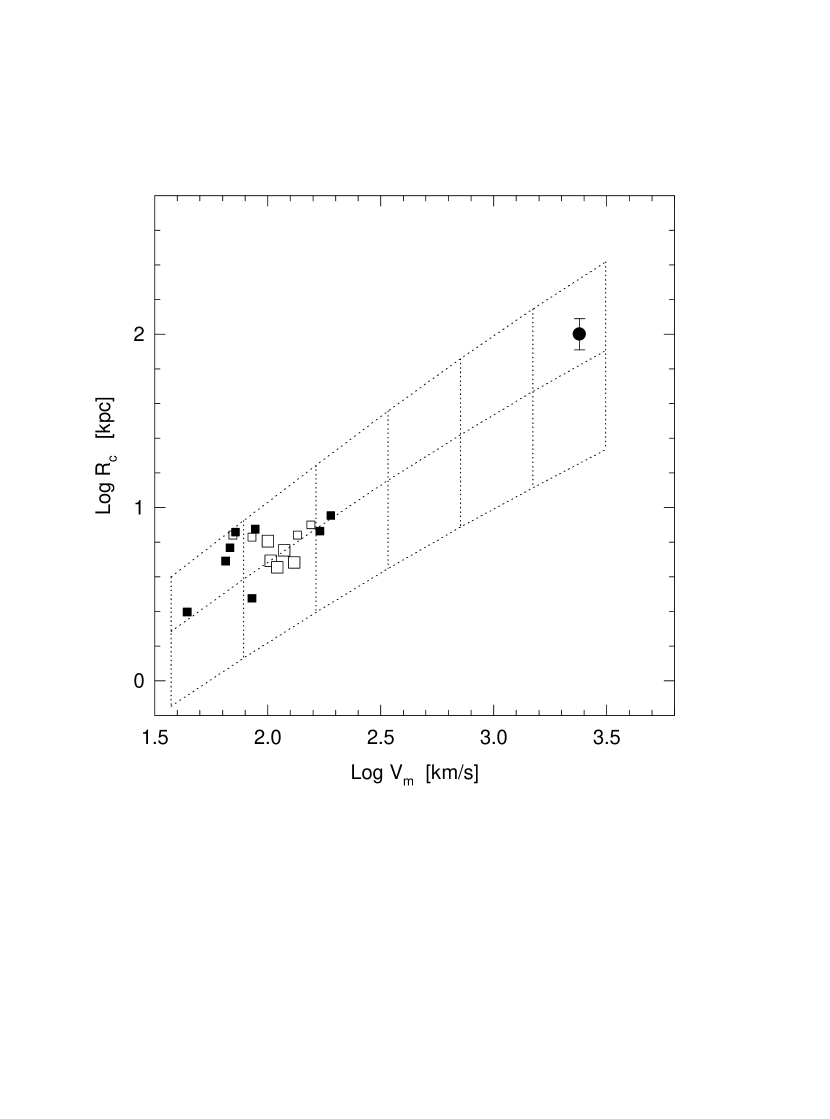
We have run the model of non-singular NFW profiles in a universe fixing the mass and the central density, hence, we derive univocally the core radius predicted by the model in order to compare it to the observations. In Fig.8 the dotted curves overlaid to the observations represent core radii obtained adopting such a profile with the central density fixed to values: /pc3 (upper curve); /pc3 (middle curve) and /pc3 (lower curve). Vertical dotted lines are the virial masses increasing by a factor of ten from to from left to right. The agreement with the observations appears good. It is likewise interesting to note that the presence of soft cores as a result of weakly self-interacting CDM, is supported by Burkert (2000) using a numerical Monte-Carlo N-body simulation. In this case a Hernquist profile is assumed as initial condition for the virialized halo and it is shown that in a Hubble time self-interaction leads to the formation of a non-singular isothermal core. The difference between the two approaches is that in our model the system is not assumed isolated. The isothermal soft core is surrounded by a NFW density profile in the outer part of the halo where mass and thermal energy are continuously injected as a result of the hierarchical halo mass aggregation history. The halo characterized by the NFW profile acts as a renewing thermal bath feeding the core region.
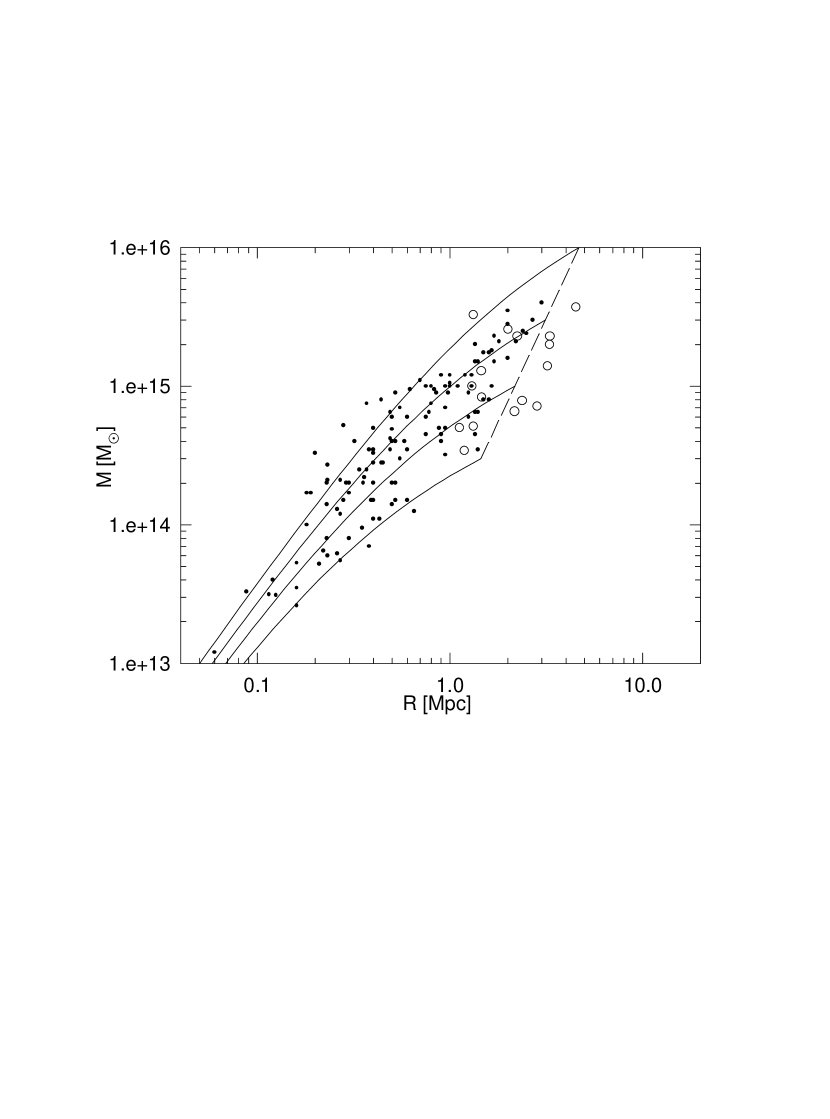
With the same procedure used in the previous section we have investigated whether the mass profiles derived by weak lensing data in the outer part of galaxy cluster haloes may agree with the predictions of this non-singular NFW profile in a hierarchical scenario. Computing the mass profiles for non-singular NFW haloes in a -dominated universe with /pc3, Fig.9 compares directly the predictions of the model (solid lines) to the mass profiles for 29 clusters derived by weak lensing in a published sample (points)(Wu et al. 1998). Models are computed for the same mass range listed above: . In this case the agreement with the observations appears a little better than for the King model analysed in the previous section. The correlation between and derived within the hierarchical picture is also plotted in Fig.9 as a long-dashed line. A good agreement between the theoretical curves and estimates of virial masses of observed clusters (open circles) as inferred by Carlberg (1996) is clearly seen.
Now, by adopting this model we are able to investigate the thermal radius . This length is not necessarily equal to the core radius. In CL0024+1654 we predict a core radius roughly of kpc but the thermal radius within which the thermalization is working is shorter, nearly kpc. This implies that the core is spherical for a few dozen of kiloparsec; beyond this radius the thermalization does not work and anisotropies will dominate. This is consistent with Miralda-Escudé (2000) who finds evidence of elliptical rather than spherical potentials on scales of the order of kpc, as for instance in MS21137-23.
The great advantage offered by assuming a local thermal equilibrium is that it allows to estimate the self-interaction cross-section directly from the observational data. If is the dark particle number density , the cross section and the dispersion velocity, assuming in the core a collision time close to the Hubble time, we derive:
| (1) |
with the mass of the dark matter particle and the central density. Even if we ignore the nature of such dark matter particles it is important to point out that our model of self-interaction is characterized by a cross section that depends on the halo dispersion velocity i.e., as in other classical physical interactions the cross section is a function of the particle energy. It is important to point out that if one assumes constant (or equivalently constant), then the halo core radius will scale with v as , as proposed by Miralda-Escudé (2000). This predicted trend is not favored by the present observational picture, even though some uncertainty is present. Assuming as a diminishing function of the dispersion velocity allows the self-interaction theory to predict: , in agreement with observations.
During the refereeing of this paper, Yoshida et al. (2000) and Davé et al. (2000) have carried out cosmological N-body simulations for a self-interacting CDM model with a constant cross-section. In a more recent study (Firmani, D’Onghia Chincarini 2000), using an original cosmological code based on the collisional Boltzmann equation, we have confirmed that self-interaction creates in the halo a non-singular isothermal core, the outer region remaining as a NFW profile. Assuming we have proved that a nearly central density scale invariance is reproduced. Further, a study of Wyithe et al. (2000) appeared strengthening the idea of a cross-section inversely proportional to the collisional velocity.
We wish to point out that when self-interaction induces the local thermal equilibrium with the cross-section given above, one of the implications of the model is a core formation more efficient on galactic than on cluster scales.
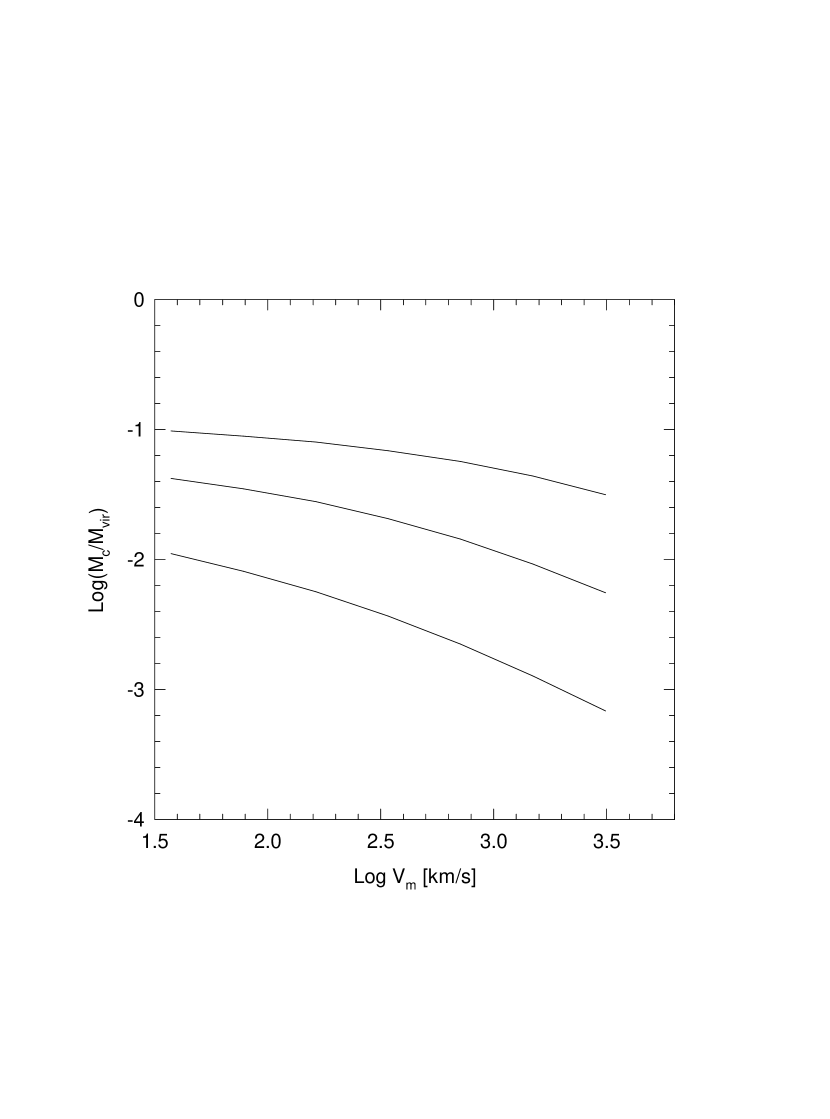
In Fig.10 we show the expected core mass fractions () as a function of the maximum circular velocity derived adopting the profile with the central density fixed to values: /pc3 (upper curve), /pc3 (middle curve) and /pc3 (lower curve). As shown by the plot, the core mass fraction decreases for more massive haloes as an intrinsic property of the model. In light of the cross section value inferred by observations, it could be interesting to explore the abundance of galactic subhaloes making use of numerical simulations and adopting a weak self-interacting cross section in order to investigate the role of the ram pressure in disrupting satellites in dark haloes.
5 Conclusions
We have examined the observed rotation curves of dark matter dominated dwarf and LSB galaxies and included the mass density profiles of two clusters of galaxies lacking the gravitational contribution of a central cD. All these objects show density profiles with evidence of soft cores. Assuming an isothermal sphere model, we have found two scaling properties for haloes from galactic to cluster sizes: a linear increase of the core radius with increasing maximum rotation velocity of the haloes, and a halo central density which remains invariant with respect to the mass. The difficulty in explaining the observed scaling trends of soft cores (in particular a scale invariant central density) by a manipulation of the primeval density fluctuation field led us to assume a self-interaction process as an attractive physical solution to the core problem. We have investigated two opposite physical situations corresponding to a global and a local thermal equilibrium, respectively. These options are two limiting cases between which dark matter self-interaction may generate soft cores compatible with the observations. In particular, a global thermal equilibrium for haloes, reached for a self-interaction cross section sufficiently large, is capable of predicting a scale invariant central density and would indicate that the observed haloes are approaching the stable equilibrium state of maximum entropy. Unfortunately, in this model the spherical shape of haloes will be rather extended, in disagreement with lensing data for clusters of galaxies.
However, the most attractive case that we have found is when a local thermal equilibrium is induced only in the halo inner region. This model yields a good agreement between the observed core radii and the theoretical predictions over the entire range sampled. In light of this coincidence with the observational data it was possible to derive inductively an estimate for the self-interaction cross section.
We stress the importance of confirming the presence of dark halo soft cores at cluster scales through high resolution mass maps using strong lensing techniques, which probe directly into the inner regions of galaxy clusters. Extending the availability of high-quality galactic rotation curve observations in the dwarf and LSB region remains equally important.
6 Acknowledgments
We are grateful to S. Gelato for stimulating discussions.
ED thanks Fondazione CARIPLO for financial support.
References
- [1] Avila-Reese V., Firmani C., Hernández X., 1998, ApJ, 505, 37
- [2] Avila-Reese V., Firmani C., Klypin A., & Kravtsov A.V., 1999, MNRAS, 310, 527
- [3] Bettwieser E., Sugimoto D., 1984, MNRAS, 208, 493
- [4] Binney J Tremaine S., 1989, “Galactic Dynamics”, ed. Princeton Series
- [5] Borriello A. Salucci P.,2000, MNRAS, submitted (astro-ph/0001082)
- [6] Bonnet H., Mellier Y., Fort B., 1994, ApJ, 427, 83
- [7] Bullock J., Kravtsov A. Weinberg D.H, 2000, ApJ, submitted (astro-ph/0002214)
- [8] Burkert A., 1995, ApJ, 477, L25
- [9] Burkert A., 2000, ApJ, submitted (astro-ph/0002409)
- [10] Carlberg R.G., Yee H.K.C., Ellingson E., Abraham R., Gravel P., Morris S., Pritchet C.J., 1996, ApJ, 462,32
- [11] Carignan C., Purton C., 1998, ApJ, 506, 125
- [12] Clowe D., Luppino G., Kaiser N, Gioia I., 2000, ApJ, submitted (astro-ph/0001356)
- [13] Cole S. & Lacey C., 1996, MNRAS, 281, 716
- [14] Colín P., Avila-Reese V., Valenzuela O., 2000, ApJ, in press
- [15] Cóte S., Carignan C., Sancisi R., 1991, AJ, 102, 904
- [16] Dalcanton J., Spergel D.N., Summers F.J., 1997, ApJ, 482, 659
- [17] Davé R., Spergel D., Steinhardt P.J., Wandelt B., 2000, ApJ, submitted (astro-ph/0006218)
- [18] de Blok W.J.G., McGaugh S. S., 1997, MNRAS, 290, 533
- [19] Jobin M., Carignan C., 1990, AJ, 100, 648
- [20] Fall S.M., Efstathiou G., 1980, MNRAS, 193, 189
- [21] Firmani C. Avila-Reese, 2000, MNRAS, 315, 457
- [22] Firmani C., D’Onghia E., Avila-Reese V., Chincarini G., Hernández X., 2000, MNRAS, 315, L29
- [23] Firmani C., D’Onghia E. Chincarini G., 2000, ApJL, submitted
- [24] Flores, R., Primack, J. R., Blumenthal, G.R., Faber, S.M., 1993, ApJ, 412, 443
- [25] Flores R., Primack J.R., 1994, ApJ, 427, L1
- [26] Fukushige T. Makino J., 1997, ApJ, 477, L9
- [27] Ghigna S., Moore B., Governato F., Lake G., Quinn T., Stadel J., 1998, MNRAS, 300, 146
- [28] Goodman J., 2000, preprint (astro-ph/0003018)
- [29] Hannestad S., 1999, preprint (astro-ph/9912558)
- [30] Hernández X., Gilmore G., 1998, MNRAS, 294, 595
- [31] Hogan C. Dalcanton J., 2000, preprint (astro-ph/0002330)
- [32] Huss A., Jain B. Steinmetz M., 1999, ApJ, 517, 64
- [33] Klypin A., Kravtsov A.V., Valenzuela O., Prada F., 1999, ApJ, 522, 82
- [34] Lake G., Schommer R.A., van Gorkom J.H., 1990, AJ, 99, 547
- [35] Martimbeau N., Carignan C., Roy, J.R., 1994, AJ, 107, 543
- [36] Miralda-Escudé J., 2000, ApJ, submitted (astro-ph/0002050)
- [37] Mo H.J., Mao, S., 2000, MNRAS, in press
- [38] Moore B., 1994, Nature, 370, 629
- [39] Moore B., Ghigna S., Governato F., Lake G., Quinn T., Stadel J. Tozzi P., 1999a, ApJ, 524, L19
- [40] Moore B., Quinn T., Governato F., Stadel J., Lake G., 1999b, MNRAS, submitted (astro-ph/9903164)
- [41] Moore B., Gelato S., Jenkins A., Pearce F.R., Quilis V., 2000, ApJ, submitted (astro-ph/0002463)
- [42] Navarro J., Frenk C.S., White S.D.M., 1997, ApJ, 490, 493
- [43] Ostriker J.P, 1999, preprint (astro-ph/9912548)
- [44] Peebles P.J.E., 2000, preprint (astro-ph/0002495)
- [45] Saha A., Sandage A., Tammann G.A., Labhardt L., Macchetto F.D., Panagia N., 1999, ApJ, 522, 802
- [46] Smail I., Ellis R., Fitchett M.J., Edge A.C., 1995, MNRAS, 273, 277
- [47] Spergel D.N., Steinhardt P.J., 1999, PRL, in press, (astro-ph/9909386)
- [48] Swaters R.A, Madore B.F, Trewhella M., 2000, ApJ, in press (astro-ph/0001277)
- [49] Tyson J.A., Kochanski G.P., Dell’Antonio I.P., 1998, ApJ, 498, L107
- [50] van den Bosch F., Robertson B.E, Dalcanton J.J, de Blok W.J.G. 1999, AJ, 119, 1579
- [51] Williams L.L.R, Navarro J.F, Bartelmann M., 1999, ApJ, 527, 535
- [52] Wu X.P., Chiueh T., Fang L.Z., Xue Y.J., 1998, MNRAS, 301, 861
- [53] Yoshida N., Springel V., White S.D.M., Tormen G., 2000, ApJ submitted (astro-ph/0002362)
- [54] Yoshida N., Springel V., White S.D.M., Tormen G., 2000, ApJ submitted (astro-ph/0006134)
- [55] Wyithe, J.S.B., Turner E.L., Spergel, D.N., 2000, ApJ submitted (astro-ph/0007354)