Broad iron lines in Active Galactic Nuclei
Abstract
An intrinsically narrow line emitted by an accretion disk around a black hole appears broadened and skewed as a result of the Doppler effect and gravitational redshift. The fluorescent iron line in the X-ray band at 6.4 – 6.9 keV is the strongest such line and is seen in the X-ray spectrum of many active galactic nuclei and, in particular, Seyfert galaxies. It is an important diagnostic with which to study the geometry and other properties of the accretion flow very close to the central black hole. The broad iron line indicates the presence of a standard thin accretion disk in those objects, often seen at low inclination. The broad iron line has opened up strong gravitational effects around black holes to observational study with wide-reaching consequences for both astrophysics and physics.
1 Introduction
In recent years, observations with both ground-based and space-based instruments have led to realization that most, if not all, nucleated galaxies harbor a massive black hole at their center (Kormendy & Richstone 1995; Magorrian et al. 1998). While many of these black holes appear to be relatively isolated, some fraction accrete significant amounts of material from the surrounding galaxy. The angular momentum of the incoming material leads to the formation of a flattened rotating disk — the accretion disk. The gravitational potential energy of material flowing through the accretion disk is converted into radiative (i.e. electromagnetic) and kinetic energy. These powerful and compact energy sources, observed in approximately 1–10% of galaxies are termed active galactic nuclei (AGN). AGN are also observed to be copious X-ray emitters. These X-rays are thought to originate from the innermost regions of an accretion disk around a central supermassive black hole. Since the accretion disk itself is expected to be an optical/UV emitter, the most likely mechanism producing the X-rays is inverse Compton scattering of these soft photons in a hot and tenuous corona that sandwiches the accretion disk. Thus, in principle, the study of these X-rays should allow the immediate environment of the accreting black hole as well as the exotic physics, including strong-field general relativity, that operates in this environment to be probed.
This review discusses how, in the past decade, X-ray astronomy has begun to fulfill that promise. Guided by observations with the Ginga, ASCA, RXTE and BeppoSAX satellites, there is a broad concensus that X-ray irradiation of the surface layers of the accretion disk in a class of AGN known as Seyfert 1 galaxies gives rise to fluorescent K emission line of cold iron via the process of “X-ray reflection”. Since this line is intrinsically narrow in frequency, the observed energy profile of the line is shaped by both special relativistic (i.e. Doppler shifting) and general relativistic (i.e. gravitational redshifting and light bending) effects into a characteristic skewed profile predicted over a decade ago (Fabian et al 1989) and first clearly seen in ASCA data (Tanaka et al 1995). Since these lines are typically broadened to a full-width half maximum of or more, they are often referred to as “broad iron lines”. After discussing the physical processes responsible for the production of these spectral signatures, we will summarize the current observational status of broad iron line studies. We will show how current observations are already addressing the nature of the accretion disk within a few gravitational radii of the black hole. Observations of the broad iron line also provide valuable insights into the physical differences behind AGN of differing luminosities and type. Finally, we discuss and attempt to predict the results that will emerge from high throughput X-ray spectroscopy with XMM–Newton, Constellation-X and XEUS. We argue that these future data will provide unprecedented constraints on the spacetime geometry near the black hole (thereby measuring the spin of the black hole), well as the physical nature of the accretion disk.
2 The basics of the broad iron line
2.1 Line production
A substantial amount of the power in AGN is thought to be emitted as X-rays from the accretion disk corona in active or flaring regions. Thermal Comptonization (i.e. multiple inverse Compton scattering by hot thermal electrons; Zdziarski et al. 1994) of soft optical/UV disk photons by the corona naturally gives rise to a power-law X-ray spectrum. The flares irradiate the accretion disk which is relatively cold resulting in the formation of a “reflection” component within the X-ray spectrum. A similar component is produced in the Solar spectrum by flares on the solar photosphere (Bai & Ramaty 1978), in X-ray binaries by irradiation of the stellar companion (Basko 1978) and in accreting white dwarfs.
The basic physics of X-ray reflection and iron line fluorescence can be understood by considering a hard X-ray (power-law) continuum illuminating a semi-infinite slab of cold gas. When a hard X-ray photon enters the slab, it is subject to a number of possible interactions: Compton scattering by free or bound electrons111Whether the electrons are bound or free is of little consequence for X-rays above 1 keV incident on gas mostly composed of hydrogen (Vainshtein et al 1983)., photoelectric absorption followed by fluorescent line emission, or photoelectric absorption followed by Auger de-excitation. A given incident photon is either destroyed by Auger de-excitation, scattered out of the slab, or reprocessed into a fluorescent line photon which escapes the slab.

Figure 1 shows the results of a Monte Carlo calculation which includes all of the above processes (Reynolds 1996; based on similar calculations by George & Fabian 1991). Due to the energy dependence of photoelectric absorption, incident soft X-rays are mostly absorbed, whereas hard photons are rarely absorbed and tend to Compton scatter back out of the slab. The reflected continuum is therefore a factor of about below the incident one. Above energies of several tens of kilovolts, Compton recoil reduces the backscattered photon flux. These effects give the reflection spectrum a broad hump-like shape. In addition, there is an emission line spectrum resulting primarily from fluorescent K lines of the most abundant metals. The iron K line at is the strongest of these lines. For most geometries relevant to this discussion, the observer will see this reflection component superposed on the direct (power-law) primary continuum. Under such circumstances, the main observables of the reflection are a flattening of the spectrum above approximately 10 keV (as the reflection hump starts to emerge) and an iron line at .
The fluorescent iron line is produced when one of the 2 K-shell (i.e. ) electrons of an iron atom (or ion) is ejected following photoelectric absorption of an X-ray. The threshold for the absorption by neutral iron is 7.1 keV. Following the photoelectric event, the resulting excited state can decay in one of two ways. An L-shell () electron can then drop into the K-shell releasing 6.4 keV of energy either as an emission line photon (34 per cent probability) or an Auger electron (66 per cent probability). (This latter case is equivalent to the photon produced by the transition being internally absorbed by another electron which is consequently ejected from the ion.) In detail there are two components to the K line, K at 6.404 and K at 6.391 keV, which are not separately distinguished in our discussion here. There is also a K line at 7.06 keV and a nickel K line at 7.5 keV is expected.
For ionized iron, the outer electrons are less effective at screening the inner K-shell from the nuclear charge and the energy of both the photoelectric threshold and the K line are increased. (The line energy is only significantly above 6.4 keV when the M-shell is lost, i.e. FeXVII and higher states.) The fluorescent yield (i.e. the probability that a photoelectric absorption event is followed by fluorescent line emission rather than the Auger effect) is also a weak function of the ionization state from neutral iron (FeI) upto FeXXIII. For Lithium-like iron (FeXXIV) through to Hydrogen-like iron (FeXXVI), the lack of at least 2 electrons in the L-shell means that the Auger effect cannot occur. For He- and H-like iron ions the line is produced by the capture of free electrons, i.e. recombination. The equivalent fluorescent yield is high and depends on the conditions (see Matt, Fabian & Reynolds 1997).
The fluorescent yield for neutral matter varies as the fourth power of atomic number , for example being less than one half per cent for oxygen. Predicted equivalent widths for low lines are given in Matt et al (1997). Fluorescent X-ray spectroscopy is a well-known, non-invasive way to determine the surface composition of materials in the laboratory, or even of a planetary surface.
For cosmic abundances the optical depth to bound-free iron absorption is higher than, but close to, the Thomson depth, The iron line production in an X-ray irradiated surface therefore takes place in the outer Thomson depth. This is only a small fraction of the thickness (say 1 to 0.1 per cent) of a typical accretion disk and it is the ionization state of this thin skin which determines the nature of the iron line.
The strength of the iron line is usually measured in terms of its equivalent width with respect to the direct emission. (The equivalent width is the width of the continuum in, say eV, at the position of the line which contains the same flux as the line. Its determination is not entirely straightforward when the line is very broad.) It is a function of the geometry of the accretion disk (primarily the solid angle subtended by the “reflecting” matter as seen by the X-ray source), the elemental abundances of the reflecting matter, the inclination angle at which the reflecting surface is viewed, and the ionization state of the surface layers of the disk. We will address the last three of these dependences in turn.
2.1.1 Elemental abundance
Elemental abundances effect the equivalent width of the iron line both through the amount of iron that is present to fluoresce, and the absorption of the line photons by L-shell photoelectric absorption of iron and K-shell photoelectric absorption of lower- elements. These competing effects, together with the fact that the edge is saturated (i.e. most incident photons just above the photoelectric edge are absorbed by iron ions), leads to a roughly logarithmical dependence on abundance. For example, using the cosmic abundance values from Anders & Grevesse (1982), the equivalent width as a function of the iron abundance is given by
| (1) | |||||
| (2) |
where
| (3) | |||||
| (4) | |||||
| (5) |
where refers to cosmic abundances (Matt, Fabian & Reynolds 1997).
2.1.2 Inclination angle
As the inclination angle at which the disk is viewed is increased, the observed equivalent width is depressed due to the extra absorption and scattering suffered by the iron line photon as it leaves the disk surface at an oblique angle. Ghisellini, Haardt & Matt (1994) find that
where , being the angle between the line-of-sight and the normal to the reflecting surface.
2.1.3 Ionization of the disk surface

X-ray irradiation can photoionize the surface layers of a disk (Ross & Fabian 1993; Ross, Fabian & Young 1999). As discussed above, the fluorescent line that the illuminated matter produces depends upon its ionization state. A useful quantity in this discussion is the ionization parameter
where is the X-ray flux received per unit area of the disc at a radius , and is the comoving electron number density: it measures the ratio of the photoionization rate (which is proportional to ) to the recombination rate (proportional to ). The iron line emission for various ionization parameters has been investigated by Matt et al (1993, 1996). They found that the behaviour split into four regimes depending on the value of (also see Fig. 2).
-
i.
ergs cm s-1: The material is weakly ionized. X-ray reflection from the accretion disk produces a cold iron line at 6.4 keV. Since the total photoelectric opacity of the material is large even below the iron edge, the Compton backscattered continuum only weakly contributes to the observed spectrum at 6 keV, and the observed iron K-shell absorption edge is small. This regime is termed ‘cold’ reflection, since the reflection spectrum around the energy of the iron-K features resembles that from cold, neutral gas.
-
ii.
100 ergs cm s ergs cm s-1: In this intermediate regime, the iron is in the form of FeXVII-FeXXIII and there is a vacancy is the L-shell () of the ion. Thus, these ions can resonantly absorb the corresponding K line photons. Successive fluorescent emission followed by resonant absorption effectively traps the photon in the surafec layers of the disk until it is terminated by the Auger effect. Only a few line photons can escape the disk leading to a very weak iron line. The reduced opacity below the iron edge due to ionization of the lower- elements leads to a moderate iron absorption edge.
-
iii.
500 ergs cm s ergs cm s-1: In this regime, the ions are too highly ionized to permit the Auger effect. While the line photons are still subject to resonant scattering, the lack of a destruction mechanism ensurs that they can escape the disk and produces a ‘hot’ iron line at . There is a large absorption edge.
-
iv.
ergs cm s-1: When the disk is highly ionized, it does not produce an iron line because the iron is completely ionized. There is no absorption edge.
Note that ionization of the reflector paradoxically causes the observed iron edge to strengthen at moderate values of . This is because the edge is saturated in reflection from a cold absorber, as is absorption at lower energies where oxygen and iron-L are the main absorbers. Ionization of oxygen and iron leads to the iron-K edge being revealed, and so apparently becoming stronger, as the reflected flux below the edge increases.
The Matt et al. (1993, 1996) calculations assume a fixed density structure in the atmosphere of the accretion disk. Nayakshin, Kallman & Kazanas (1999) have relaxed this assumption and included the effect of thermal instability in the irradiated disk atmosphere. In their solutions, the cold dense disk that produces the X-ray reflection features is blanketed with an overlying low-density, highly ionized, region. For weak irradiation, the ionized blanket is thin and does not affect the observed spectrum. However, for strong irradiation, the ionized blanket scatters and smears the ionized reflection features. In their models, it can be difficult to produce highly ionized iron lines in reflection — the effect of increasing ionization is to dilute the ‘cold’ reflection signature. The extent of this effect will depend on the Compton temperature of the radiation field.
2.2 The profile of the broad iron line

The iron K line is intrinsically a rather narrow line. Hence, we can use broadening of the line to study the dynamics of the accretion disk. The line profiles is shaped by the effects of Doppler shifts and gravitational redshifting. Figure 3 demonstrates these effects at work in a schematic way. In a non-relativistic disk, each radius of the disk produces a symmetric double-horned line profile corresponding to emission from material on both the approaching (blue-shifted) and receding (red-shifted) side. The inenr regions of the disk, where the material is moving the fastest, produce the broadest parts of the line. Near a black hole, where the orbital velocities of the disk are mildly relativistic, special relativistic beaming enhances the blue peak of the line from each radius (second panel of Fig. 3). Finally, the comparable influences of the transverse Doppler effect (i.e. “moving clocks run slowly”) and gravitational redshifting (i.e. “clocks near black holes run slowly”) shifts the contribution from each radius to a lower energy. Summing the line emission from all radii of the relativistic disk gives a skewed and highly broadened line profile. It has been suggested by Pariev & Bromley (1998) that turbulence in the accretion disk may also significantly broaden the line. While a detailed assessment of this possibility must await future magneto-hydrodynamic disk simulations, it seems unlikely that the turbulent velocity field in a thin accretion disk will be large enough to broaden the line.


Some fully relativistic model line profiles are plotted in Figs. 4 and 5. In Fig. 4, we show the line profile from an accretion disk in orbit around a non-rotating black hole (described by the Schwarzschild metric). The line is assumed to be emitted from an annulus of the disk extending between 6 and 30 from the black hole, where is the standard gravitational radius. It is seen that the high energy “bluewards” extent of the line is a strong function of the inclination of the disk. In fact, the blue extent of the line is almost entirely a function of the inclination, thereby providing a robust way to measure the inclination of the disk. On the other hand, the redward extent of the line is a sensitive funcion of the inner radius of the line emitting annulus. In Fig. 5, we show model iron lines from a Schwarzschild black hole and a rapidly rotating black hole (described by a near extremal kerr metric). In this figure, we have made the assumption that the line emission extends down to the innermost stable orbit of the acretion disk. For these purposes, the principal difference between these two space-time geometries is the location of the innermost stable orbit (and hence the inner edge of the line emission) — this critical radius is at in the Schwarzschild case, and in the extremal kerr case.
Model line profiles are given in the Schwarzschild case by Fabian et al (1989) and for the maximal Kerr (spinning black hole) case by Laor (1991). Iron lines in extreme kerr metrics are also computed by Bromley, Miller & Pariev (1998), and Martocchia, Karas & Matt (2000). These last two sets of authors have presented diagnostics that can be used by observers who wish to avoid full spectral fitting of complex relativistic models. The formalism of computing relativistic line profiles is also discussed by Fanton et al. (1997).
2.3 Observations of broad iron lines

The X-ray reflection spectrum was first clearly seen by the Japanese X-ray observatory Ginga (Pounds et al 1990; Matsuoka et al 1990). The CCD detectors on board the Advanced Satellite for Cosmology and Astrophysics (ASCA) were the first X-ray spectrometers to provide sufficient spectral resolution and sensitivity for investigating the profile of the iron line in detail. The first clear example of a broad skewed iron line came from a long ASCA observation of the Seyfert 1 galaxy MCG–6-30-15 (Fig. 6; Tanaka et al 1995). The sharp drop seen at about 6.5 keV both demonstrates the good spectral resolution of the CCD detector and, as discussed above, constrains the inclination of the disk to be about 30 degrees. If the inclination were greater then this blue edge to the line moves to higher energies (as seen in the broad iron line of the Seyfert 2 galaxy IRAS 18325–5926, Iwasawa et al 1996a). The redward extent of the line constraints the inner radius of the emission to be 7 rgand the overall shape means that most of the line emission is peaked within 20 rg.
Nandra et al. (1997a) and Reynolds (1997) used ASCA data to study the iron line in over 20 Seyfert 1 galaxies and found that most are significantly broader than the instrumental resolution. In a typical ASCA observation of an AGN, the signal-to-noise ratio of the detected iron line is insufficient to study the line beyond simply measuring that it is broad. To combat this problem, Nandra et al. (1997a) have summed together the data from many AGN to produce an average iron line profile. They find that the average line has clear extension to low energies. To the extent that individual sources can be studied, the inferred inclinations of the accretion disks are clustered around 30 deg, indicating some bias to the selected galaxies. Such a bias is expected within the context of the “unified model” of Seyfert galaxies (Antonucci 1993). In brief, the unified model states that Seyfert galaxies possess an obscuring torus on scales larger than the accretion disk. When one views the central regions of the AGN along a line of sight that is not blocked by the torus, one seens a type-1 Seyfert galaxy. Otherwise, one would see a type-2 Seyfert galaxy. If the accretion disk and tori are co-aligned (as might be expected on the basis of dynamical models; Krolik & Begelman 1988), and the tori have an average opening angle of 30–40 degrees, then we would naturally expect a bias in the measured disk inclinations in a sample of Seyfert 1 galaxies.
It should be noted that, in some cases, results on the inclination of the disk implied from the broad iron line and orientations of the systems inferred from the other techniques, e.g., ionization cone, radio jet, broad line clouds etc., differ from each other (e.g., Nishiura, Murayama & Taniguchi 1998). The prime example is NGC4151, for which the iron line suggests the inner accretion disk to be almost face-on (Yaqoob et al 1996) whilst the other observations point to an edge-on system. The recent suggestion by Wang et al. (1999) that a significant proportion of the iron line in NGC4151 is scattered into our line-of-sight by an electron scattering disk atmosphere may explain this discrepancy. Also, such a difference in geometry depending on scales of interest may be expected due to warping of the accretion disk or a multiple merger (e.g., NGC1068, Bland-Hawthorn & Begelman 1997). Iron lines from warped accretion disks have been studied theoretically in some detail by Hartnoll & Blackman (2000). In other objects the inclination inferred from the iron line agrees with the classification of the object (e.g. MCG–5-23-16; Weaver, Krolik & Pier 1998).

The observed iron line profiles in active galaxies are not necessarily solely from the accretion disk. Absorption and extra emission may alter the iron line emitted by the accretion disk. Nandra et al (1999) reported detection of an absorption feature at about 5.7 keV imposed on the broad iron line profile obtained from a long observation of NGC3516 (see Fig. 7). They suggest that this feature is due to K resonant line scattering by highly ionized iron (with an intrinsic energy of 6.9 keV). The redshift of the absorption feature has been interpreted as evidence for matter infalling onto a black hole. However, gravitational redshifting of resonant absorption which could occur when the line photons are passing through the hot corona above the disk can also account for the observed feature if it occurs close to the black hole (Ruszkowski & Fabian 2000).
The iron line profiles observed in some Seyfert galaxies, especially Compton-thin Seyfert 2s (or those classified as Seyfert 1.8 or 1.9 in optical), have significant contribution of a narrow line component originating from matter far away from a the central black hole, e.g., a molecular torus (Weaver & Reynolds 1998). Such a narrow component would become clear if a primary X-ray source had faded away as has been seen in NGC2992 (Weaver et al 1996) and NGC4051 (Guainazzi et al 1998), since light travel times puts a fundamental limit on how rapidly line emission from the torus can respond to the central source. The iron line variability observed in NGC7314 (Yaqoob et al 1996) is exactly what is expected from a line consisting of a broad component originating from the accretion disk and a torus line. In this source, the broad iron line responds to changes in the primary power-law X-ray flux, while a narrow line component is found to be constant. It is interesting to note that this composite nature is not always found in Seyfert 1 galaxies. Any contribution of a stable, narrow line component in MCG–6-30-15 has been found to be very small (Iwasawa et al 1996; 1999). This might suggest that, in comparison to Seyfert 2 galaxies, Seyfert 1 galaxies have tori that have either smaller optical depths or smaller geometric covering factors.

Not all bright Seyfert 1 galaxies have iron lines so broad that the disk is required to extend down to the marginally stable orbit (i.e. ). IC4329a is found to have a relatively narrow line (Done et al 2000) which can be modelled with a disk of inner radius of about . The disk within this radius may either be missing or highly ionized.
Rapid X-ray variability in active galaxies predicts the iron line also to vary in response to the continuum with a small time lag. The light crossing time for 10 rgin a black hole with a mass of is about 500 s, which is much shorter than an integration time required for ASCA to collect enough line photons to perform a meaningful measurement in X-ray bright AGN ( ). It means that no reverberation effects in the line can be detected with ASCA. We will return to reverberation effects in Section 5.
Despite the inability of current detectors to measure reverberation, significant and complex variations of the iron line in profile as well as intensity have been observed in the Seyfert 1 galaxy MCG–6-30-15 (see Fig. 8; Iwasawa et al 1996b). During the first long observation of this galaxy in 1994, a line profile with unusually strong blue peak was found in a time interval of a bright flare whilst the line showed a very-broad, red-wing dominated profile during a deep minimum period. In this very-broad state, line emission from within 6 rg is required to explain the line profile and width. Possible theoretical interpretations of this are discussed in Section 4. A succession of large flares on the approaching side of the disk could produce the blue-peak dominated line profile, although it can also be explained if the line is produced predominantly at large radii ( rg). It is worth noting that this bright flare showed a continuum spectral evolution similar to that seen in a shot in a Galactic black hole candidate, e.g., Cyg X-1 (Negoro et. al 1995).
Another peculiar line shape seen in a brief period ( hr) of a flare during the 1997 long observation of MCG–6-30-15 also requires a large redshift within 6 rg. The blue wing of this line is, this time, shifted well below 6 keV and no significant line was detected around 6.4 keV. A possible explanation is that the line production occurred either in a thin annulus at 4 rg or a small patch at 2.5 rg on the approaching side of the disk (Iwasawa et al 1999).
Detailed studies of the RXTE data on the iron line variability in MCG–6-30-15 have presented a puzzling problem; most of the line flux appears to be constant in spite of strong continuum changes (Lee et al 1999; Reynolds 2000: see also studies of NGC5548 by Chiang et al 1999 and of the Galactic Black Hole Candidate Cygnus X-1 by Revnivtsev, Gilfanov & Churazov 1999). There should therefore be some self-regulating mechanism to produce a constant line flux, which has yet to be understood. However, a separate investigation of the broad red-wing and narrow core of the iron line for the 1994 observation (Iwasawa et al 1996) has revealed interesting behaviours of each component. The narrow core remains constant on time scales shorter than s but follows the continuum variations on longer time scales ( s). In contrast, the broad red-wing appears to follow the continuum on the short time scales. This is consistent with a line produced from a relativistic disk (see also Blackman 1999). Also puzzling is an anti-correlation between the reflected fraction and the equivalent width of the iron line measured in MCG–6-30-15 (Lee et al 2000) and NGC5548 (Chiang et al 2000).
3 Alternative models for a broad line
The claim that iron line studies are probing the region within a few gravitational radii of the black hole is a bold one, and should be tested against other models at every opportunity. Furthermore, the internal consistencies of the accretion disk hypothesis must be critically examined. Given the quality of data, the July-1994 MCG6-30-15 line profile has become a testbed for such comparisons.
Fabian et al. (1995) examined many alternative models including lines from mildly relativistic outflows, the effect of absorption edges on the observed spectrum, and broadening of the line via comptonization. Fabian et al. found that none of these models were viable alternatives for the MCG6-30-15 line profile. The idea of producing the broad line via Comptonization has been revived recently by Misra & Kembhavi (1997) and Misra & Sutaria (1999). They argue that the spectrum initially consists of a narrow iron line superposed on a power-law continuum and that Comptonization in a surrounding cloud with optical depth produces the broad line. The Comptonizing cloud must be both cold ( in order to predominately downscatter rather than upscatter the line photons), and fully-ionized (since no strong iron absorption edges are seen in the continuum spectrum). The cloud is kept fully ionized and yet cool by postulating that the continuum source has a very luminous optical/UV component.
There are strong arguments against such a model. Since the power-law continuum emission also passes through any such Comptonizing cloud, one would observe a break in the continuum spectrum at . Such a break is not observed in the BeppoSAX (Guainazzi et al. 1999) or RXTE data (Lee et al. 1999) for MCG–6-30-15 (see Misra 1999). Also, both continuum variability (which is seen on timescales as short as 100 s) and ionization arguments limit the size of the Comptonizing cloud in MCG–6-30-15 to . The essence of this ionization argument is that the ionization parameter at the outer edge of the cloud (which, for a fixed cloud optical depth, scales with cloud size as ) must be sufficiently high that all abundant metals, including iron, are fully ionized (Fabian et al. 1995; Reynolds & Wilms 2000). In the case of MCG–6-30-15, these constraints on the cloud size turn out to so tight that the postulated optical/UV component required to Compton cool the cloud would violate the black body limit (Reynolds & Wilms 2000). Comptonization moreover provides a poor fit (Ruszkowski & Fabian 2000). Hence, we consider the Comptonization model for the broad iron line not to be viable.
In another alternative model, Skibo (1997) has proposed that energetic protons transform iron in the surface of the disk into chromium and lower metals via spallation which then enhances their fluorescent emission (see Fig. 1). With limited spectral resolution, such a line blend might appear as a broad skewed iron line. This model suffers both theoretical and observational difficulties. On the theoretical side, high-energy protons have to be produced and slam into the inner accretion disk with a very high efficiency (Skibo assumes for this process alone). On the observational side, it should be noted that the broad line in MCG–6-30-15 (Tanaka et al 1995) is well resolved by the ASCA SIS (the instrumental resolution is about 150 eV at these energies) and it would be obvious if it were due to several separate and well-spaced lines spread over 2 keV. There can of course be doppler-blurring of all the lines, as suggested by Skibo (1997), but it will still be considerable and require that the redward tails be at least 1 keV long.
Finally it is worth noting that the line profile indicates that most of the Doppler shifts are due to matter orbiting at about 30 degrees to the line of sight. The lack of any large blue shifted component rules out most models in which the broad line results from iron line emission from bipolar outflows or jets. What we cannot determine at present is the geometry in more detail. For example, we cannot rule out a ‘blobby’ disk (Nandra & George 1994). We do, however, require that any corona be either optically-thin or localized, in order that passage of the reflection component back through the corona does not smear out the sharp features. (Note though that an optically-thick corona over the inner regions of a disc would explain the lack of an iron line from that region.)
4 What happens inside 6 rg: Kerr black holes
Circular particle orbits around a black hole are only stable outside the radius of marginal stability, . Within this radius, it is normally assumed that the material plunges ballistically into the black hole. The location of depends on the black hole spin, decreasing from 6 rg for a static Schwarzschild black hole () to 1.235 rg for prograde orbits around a maximally spinning Kerr black hole (). Thus the inner edge of a Keplerian accretion disk will be at . In the standard model the X-ray emission from the accretion disk takes place in a (possibly patchy) disk-hugging corona above the (almost) Keplerian part of the disk. The material inflowing within cannot support a corona and is assumed to receive an insignificant fraction of the X-ray illumination. In such models fluorescent line emission is expected to extend in only as far as .


As discussed previously the degree of redshifting seen in the iron line is an indication of how close the line emitting region extends to the black hole. During a deep minimum in the X-ray light curve of the 1994 ASCA observation of MCG–6-30-15 the iron line was seen to broaden and shift to lower energies (see Fig. 8). The only way to have such significantly redshifted line flux is for the source of emission to move within the innermost stable orbit for a static Schwarzschild black hole (i.e. 6 rg). The line is well fit by the profile of a maximally spinning Kerr black hole leading to the tentative conclusion that the line was the first spectroscopic evidence for a Kerr black hole (Iwasawa et al 1996). (It was tentative because of the difficulty in measuring the continuum precisely at that time due to an increase in the strength of the warm absorber; Otani et al 1996). Later work by Dabrowski et al (1997) quantified the spin of the black hole required to produce such highly redshifted emission to exceed 95 per cent of its maximal value. The equivalent width of the line also increased dramatically (by a factor of 3–4) during this deep-minimum.
Of course, the black hole spin cannot change on such short timescales. It seems, instead, that the pattern of X-ray illumination across the disk must change in the sense that it becomes more concentrated that average during the deep minimum. Since such a dramatic change in illumination pattern is unlikely to occur just by chance, some structural change in the X-ray emitting corona is inferred. A plausible correspondence of the accretion disk thermal timescale, and the timescale on which the source enters the deep-minimum, may suggest that such structural changes are mediated by thermal instabilities in the accretion disk or accretion disk corona. An unsolved problem of this model is that one would expect the continuum level to increase significantly (rather than suffer the observed decrease) when the emission is originating from the energetically-dominant, innermost regions of the accretion disk.


Reynolds & Begelman (1997) have pointed out that although the inner edge of the accretion disk around a Schwarzschild (i.e. non-rotating) black hole is at 6 rg the accretion flow does not immediately become optically thin at smaller radii, and may remain optically thick almost all the way down to the horizon. If this it is illuminated in the right manner, ionized iron fluorescence from this region can give rise to an extremely broad and highly redshifted iron line very similar to that observed during the deep minimum (see Fig. 9). In this model, the illuminating source is assumed to be a point source located on the symmetry axis of the accretion disk. The change in line profile, line equivalent width, and continuum level are explained by assuming that the X-ray source changes its height above the accretion disk with approximately constant luminosity. However, the modelling of Reynolds & Begelman (1997) did not account for the Compton reflected continuum which would be expected to accompany the line. Young, Ross & Fabian (1998) have computed both the line and continuum spectrum expected from such a model. Within the density of the infalling material drops rapidly and it becomes photoionized by the X-ray illumination, generating a large iron absorption edge (see Fig. 10). Preliminary indications suggest that such an edge may not be present in the data, although detailed spectral fitting has yet to be performed in order to address this issue. While the situation with current data remains ambiguous, searching for these type of spectral features in future XMM–Newton data may allow us to unambiguously determine the spin of the black hole in MCG–6-30-15 and other objects.
The detailed nature of the accretion flow within 6 rg of a Schwarzschild black hole is likely to be a lot more complicated than we have assumed in the above discussion. Magnetic fields within the innermost stable orbit may be rapidly amplified until their energy density is comparable to the rest-mass energy density of the accretion flow (Krolik 1999), and hence will be dynamically significant. Such strong field enhancement within the radius of marginal stability may lead to the creation of an “inner” X-ray emitting corona (note that Lee et al. 2000 have argued for an inner, highly variable, X-ray corona on the basis of the observed RXTE variability). The presence of magnetic fields may also exert a torque on the inner edge of the disk (usually assumed to have a zero-stress boundary condition) thereby increasing the outward flow of angular momentum and the efficiency of the disk (Agol & Krolik 2000; although also see Paczyński 2000 for an opposing view). If there is appreciable line fluorescence from within the radius of marginal stability, reverberation mapping (discussed below) may allow this region to be mapped out in detail.
5 Reverberation
The rapid X-ray variability of many Seyfert galaxies leads us to believe that the primary X-rays are emitted during dramatic flare-like events in the accretion disk corona. When a new flare becomes active, the hard X-rays from the flare will propagate down to the cold disk and excite iron fluorescence. Due to the finite speed of light, the illumination from the flare sweeps across the disk, and the reflected X-rays act as an ‘echo’ of this flare. Such flaring will cause temporal changes in the iron line profile and strength due to the changing illumination pattern of the disk and, more interestingly, time delays between the observed flare and the its fluorescent echo. This latter effect is known as reverberation.
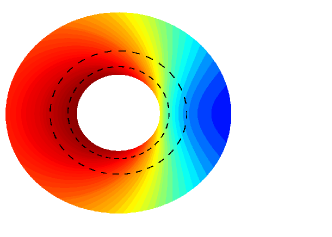
In principal, reverberation provides powerful diagnostics of the space-time geometry and the geometry of the X-ray source. When attempting to understand reverberation, the basic unit to consider is the point-source transfer function, which gives the response of the observed iron line to an X-ray flash at a given location. As a starting point, one could imagine studying the brightest flares in real AGN and comparing the line variability to these point-source transfer functions in an attempt to measure the black hole mass, spin and the location of the X-ray flare. By studying such transfer functions, it is found that rapidly rotating black holes possess a characteristic reverberation signature. In the case where the fluorescing part of the accretion disk extends down to the radius of marginal stability of a near-extremal kerr black hole, the instantaneous iron line profile displays a low-energy bump which moves to lower-energies on a timescale of . This feature corresponds to highly redshifted and delayed line emission that originates from an inwardly moving ring of illumination/fluorescence that asymptotically freezes at the horizon (see Reynolds et al. 1999 and Young & Reynolds 2000 for a detailed discussion of this feature).
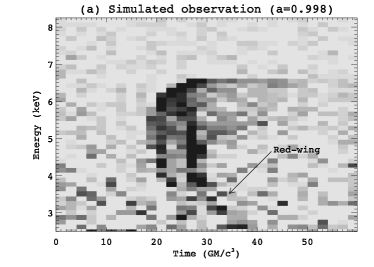
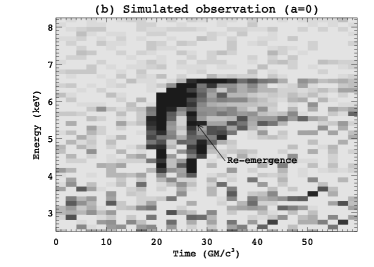
The primary observational difficulty in characterizing iron line reverberation will be to obtain the required signal-to-noise. One must be able to measure an iron line profile on a timescale of , where we have normalized to a central black hole mass of . This requires an instrument with at least the collecting area of XMM–Newton, and probably Constellation-X. Figure 11 shows that Constellation-X can indeed detect reverberation from a bright AGN with a mass of . Furthermore, the signatures of black hole spin may well be within reach of Constellation-X (Young & Reynolds 2000). Although these simulations make the somewhat artificial assumption that the X-ray flare is instantaneous and located on the axis of the system, it provides encouragement that reverberation signatures may be observable in the foreseeable future.
Of course, the occurrence of multiple, overlapping flares will also hamper the interpretation of iron line reverberation. In the immediate future, the most promising (although observationally expensive) approach will be to observe a bright source while it undergoes a very large flare. (Although the current data show little evidence in general for correlated behaviour of the continuum and iron line, as mentioned in Section 2.3, changes in the line are seen during some of the largest flares and dips in MCG–6-30-15.) Assuming that the single flare temporarily dominates the flux from the source, we might expect the point source transfer function to be an adequate description of the reverberation. Ultimately, reconstruction techniques for extracting reverberation signatures from overlapping flares should be explored.
6 Other types of black hole systems
As outlined in the preceding discussion, most of the progress in the field of broad iron line observations has been for type-1 Seyfert galaxies. In this section, we briefly discuss X-ray reflection diagnostics of other types of black hole systems.
6.1 Quasars
There is no evidence of an iron line or any reflection features in the spectra of most luminous quasars (Nandra et al 1995; 1997). The equivalent width of the iron line is observed to decrease with increasing luminosity as one moves from the Seyfert 1 regime () to the quasar regime, a phenomenon termed the ‘X-ray Baldwin effect’ (Iwasawa & Taniguchi 1993; Nandra et al 1995). It has been suggested that the accretion disk becomes increasingly ionized. This might be due to the most luminous objects possessing accretion rates closer to the Eddington limit. One puzzling aspect of this explanation is that the disk must jump from being ‘cold’ to being completely ionized otherwise we would observe instances of intermediate ionization in which the iron in the surface layers of the disk is H or He-like and the equivalent width of the line is even larger (Fig. 2 with ). There should also be a large absorption edge that is not seen. As mentioned in Section 2.1, a thermal instability in the surface layers of the disk (Nayakshin et al 1999) may lead to the formation of a highly ionized blanket and circumvent this problem.
The absence of reflection features can also be explained if the fluorescing accretion disk subtends less than as seen from the illuminating X-ray source, e.g. if the fluorescing accretion disk truncates at a few tens of Schwarzschild radii. A transition to an advection dominated accretion flow (ADAF), which is hot and optically-thin, would produce such a geometry. However, such structures can only exist at small acretion rates. Together with the fact that most of the energy in such a structure is advected into the black hole, ADAFs are expected to be much less luminous than most quasars. A more likely possibility is that, as an object approaches its Eddington limit, the region of the disk that is radiation pressure dominated moves further out, causing the surface layers of the disk to become more tenuous and highly ionized. The formation of a super-Eddington accretion disk in which much of the radiative energy is trapped in the accretion flow may also be relevant to quasars.
Curiously, one of the most luminous low redshift quasars, PDS 456, shows significant features at the iron-K energies (Reeves et al 2000). The features appear as a deep ionized edge and a possible broad line, and are modelled as either an ionized reflector (disk), or less likely as a strong highly ionized warm absorber.
6.2 Low luminosity AGN
Most massive black holes in the local universe are accreting at rates that are much lower than those found in AGN. If the accretion is so small as to render the black hole undetectable, the galaxy is termed a quiescent galaxy. Slightly higher accretion rates will lead to the classification as a low luminosity AGN (LLAGN).
The nature of black hole accretion when the accretion rates are very low is a topic of active research. It was realized by several authors that when the accretion rate is low (relative to the Eddington rate), an accretion disk may switch into a hot, radiatively-inefficient mode (Ichimaru 1977; Rees 1982; Narayan & Yi 1994; Narayan & Yi 1995). In essence, the plasma becomes so tenuous that the timescale for energy transfer from the protons to the electrons (via Coulomb interactions) becomes longer than the inflow timescale. The energy remains as thermal energy in the protons (which are very poor radiators) and gets advected through the event horizon of the black hole. These are the so-called Advection Dominated Accretion Flows (ADAFs). ADAFs are to be contrasted with ‘standard’ radiatively-efficient accretion disks in which the disk remains cool and geometrically thin all of the way down to the black hole (Shakura & Sunyaev 1973; Novikov & Thorne 1974). Broad iron line studies of LLAGN provide a potentially important probe of the physics of accretion when the accretion rate is low — the iron line traces only the radiatively-efficient portions of the disk since ADAFs are far too hot to produce fluorescent iron line emission.
Observationally, LLAGN have proven difficult to study due to the fact that they are X-ray faint. In addition, their X-ray spectra are typically complex with non-nuclear spectral components (such as starburst regions and/or thermal emission from hot gas) rivalling the nuclear component (e.g. see Ptak 1997). One of the best studied LLAGN resides in the nearby galaxy NGC 4258 (M 106). A short ASCA observation of this galaxy hinted at the presence of an iron line (Makishima et al. 1994). However, it took a deep ASCA observation to unambiguously detect the line and allow a detailed study (Reynolds, Nowak & Maloney 2000). It was found that the line in NGC 4258 is fairly weak (with an equivalent width of about 100 eV) and narrow (with a FWHM of less than ). Reynolds et al. (2000) argue that this line does indeed originate from the accretion disk, implying that the X-ray emitting corona has a size greater than . The contrast between the iron lines found in NGC 4258 and its higher luminosity Seyfert cousins is consistent with an ADAF scenerio for LLAGNs. However, the observational results are not yet conclusive. If the iron line seen in NGC 4258 comes from material not associated with the accretion disk (such as a distant torus that is misaligned with the almost edge-on accretion disk so as not to obscure the central engine from our view), then the data are consistent with the presence of a “Seyfert-like” broad iron line. See Reynolds et al. (2000) for further details.
While it is significantly more luminous than NGC 4258, the well studied active nucleus in the galaxy NGC 4051 is also often classified as a LLAGN. This object display a classic relativistic iron line indicating the presence of a radiatively-efficient accretion disk in this object (Guainazzi et al. 1996). Wang et al. (1999) have recently discovered interesting temporal variability in this iron line which displays opposite trends to the variability found in MCG–60-30-15 — both the equivalent width and energy width of the line positively correlate with the source flux.
6.3 Radio-loud AGN
It has long been known that most AGN can be readily characterized as being radio-loud (i.e. with relativistic radio jets) or radio-quiet (i.e. with no well-defined radio jets). One of the greatest mysteries in the field of AGN research is the physical mechanism underlying this division. A first step in solving this puzzle is to compare and contrast the central engine structures of radio-quiet and radio-loud AGN. Since they originate from deep within the central engine, X-rays are a good tool for probing any such differences.
Radio-loud AGN are rarer, and hence typically fainter, that their radio-quiet counterparts. Furthermore, many of the best candidates for study are found in clusters of galaxies and it can be difficult to observationally distinguish AGN emission from thermal cluster emission. For these reasons, the quality of te observational constraints is rather poorer in the case of radio-loud AGN as compared with radio-quiet sources. Having stated those caveats, there does appear to be a difference between the X-ray properties of radio-loud nuclei and radio-quiet nuclei. Broad iron lines, and the associated Compton reflection continua, are generally weak or absent in the radio-loud counterparts (Eracleous, Halpern & Livio 1996; Woźniak et al. 1997; Reynolds et al. 1997; Sambruna, Eracleous & Mushotzky 1999; Grandi et al 1999; Eracleous et al 2000). This effect might be due to the swamping of a normal ‘Seyfert-like’ X-ray spectrum by a beamed jet component (similar to the swamping of optical emission lines in a blazar spectrum). Alternatively, the inner disk might be in a physical state incapable of producing reflection signatures (such as an ADAF or some similarly hot state). Future observations with XMM–Newton should be able to distinguish these possibilities by searching for very weak broad components to the iron line.
6.4 Galactic Black hole Candidates
Smeared edges with little evidence of line emission have been observed in the spectra of Galactic Black Hole Candidates (GBHC) (Ebisawa et al 1996). These observations can be explained if the surface of the disk is moderately ionized with a mean ionization parameter of a few hundred (Fig. 2 with ; Ross, Fabian & Brandt 1996). As discussed in Section 2.1, for this relatively narrow range of ionization parameters line photons are resonantly trapped and eventually lost as Auger electrons. Hence, the X-ray reflection produces very little line emission but an appreciable absorption edge. Sharp features will be smeared as a result of the Doppler and relativistic effects, and this blurring has possibly been detected in the spectrum of Cygnus X–1 (Done & Zycki 1999). Similar spectra but with broader emission and absorption features are produced for higher values of the ionization parameter , which appear to match those seen in GBHC. The smearing in this instance is due to the line photons being generated a few Thomson scattering depths into the disk (the very outermost layers are completely ionized) and being Compton scattered on leaving it.
An interesting correlation has been claimed by Zdziarski, Lubiǹski & Smith (1999) between the reflection fraction seen in accreting black holes (AGN or GBHC) and the spectra index. Sources with flat spectra tend to have a low reflection fraction. Models involving large central holes in the disc, or ionized discs, may explain the correlation, as may mild relativistic motion, thus beaming, of the continuum radiation (Beloborodov 1999; see also Reynolds & Fabian 1997).
It is currently difficult to discriminate between models in which a cold disk truncates at a few tens of Schwarzschild radii (e.g. Gierliński et al 1997) and models in which an ionized disk extend in to the innermost stable orbit (Young et al 2000) since both provide good fits to present data. Future observations will hopefully resolve these issues.
7 Summary
In this section we summarize some of the key points of this review.
-
X-ray continuum. The hard X-ray continuum in AGN and GBHCs is thought to be produced in active or flaring regions in a corona above the accretion disk. Thermal electrons multiply inverse Compton scatter optical and UV photons from the disk to X-ray energies. The hard X-ray power law that results irradiates the accretion disk and produces a “reflection” component in the spectrum.
-
Reflection component. The reflection component causes the observed spectrum to flatten above 10 keV as Compton recoil reduces the backscattered flux and also results in a strong iron fluorescence line at approximately 6.4 keV. The precise energy and strength of the line depend on a number of factors such as the iron abundance, the inclination of the disk and its ionization state. An ionized disk may also produce a strong iron absorption edge.
-
Iron line profile. The line profile is determined by Doppler shifts and relativistic boosting due to the motion of the disk and the gravitational redshifting of the black hole. This produces a broad, skewed line profile. Since the line originates from the innermost regions of the accretion disk, these effects are very pronounced. From observations of the line profile the black hole spin and the inclination angle of the accretion disk may be determined. In most Seyfert 1 galaxies (i.e. AGN in which we can view the accreting black hole directly) the accretion disk is inclined at about 30∘ to the observer. This is consistent with the standard model in which the Seyfert nucleus is surrounded by an optically thick torus with an opening angle of 30–40∘.
-
Observations. The iron line was first clearly detected by Ginga and a line profile subsequently resolved by ASCA confirming the broad and skewed shape expected from an accretion disk around a Schwarzschild black hole. RXTE has been able to study the line and continuum variability on much shorter timescales, although with reduced energy resolution.
-
Black hole spin. The radius of the smallest stable circular orbit around the black hole decreases with the spin of the black hole. Since the line profile is sensitive to the innermost radius of fluorescent emission this may be used (with some assumptions about the astrophysics of this region) to estimate the spin of the black hole. With present time-averaged observations, however, such measurements may be ambiguous as alternative models with very different values for the black hole spin may produce almost identical line profiles.
-
Alternative models for the production of the broad iron line. Models for the broad iron line that do not require a black hole accretion disk appear to fail. In particular the line width cannot be entirely due to Comptonization. Hybrid models in which both Comptonization and Doppler/gravitational effects produce the line profile are heavily constrained.
-
Variability. Rapid X-ray continuum variability is observed in most AGN and the iron line is expected to vary in response to this with a short time lag. Whilst these timescales are too short to be probed with present instruments, significant and complex iron line variability has been observed. Curiously, the line flux is seen to remain constant whilst the continuum changes, and there appears to be an anti-correlation between the reflected fraction and the equivalent width of the line. In another study the reflected fraction and the photon index of the power law are correlated, both for an individual object, and between different objects (including both AGN and GBHC). Such observations need to be explained, especially since they appear contrary to our simple model of reflection. Flux-correlated changes in the ionization state of the disk may explain some of these facts.
-
Reverberation mapping. The rapid X-ray variability is associated with the activation of new flares in the corona above the accretion disk. X-ray reverberation mapping is the technique of using observations of the iron line response, or “echo”, to sudden changes in the continuum to study the accretion disk and black hole. In principle this may be used to determine the geometry of the X-ray emission and the black hole spin and mass. Such observations will be within the capabilities of the next generation of X-ray observatories.
-
Other classes of object. Iron lines are observed in other classes of object in addition to Seyfert galaxies. In quasars the strength of the iron line decreases with increasing luminosity. This may be because the more luminous sources accreting closer to the Eddington limit and more highly ionized. The observation of iron lines in LLAGN may determine whether the accretion with low rates is an ADAF or a thin disk. Weak iron lines have also been seen in LLAGN suggesting their low accretion rate flows are thin disks as opposed to geometrically thick ADAFs. In radio loud AGN, broad iron lines and reflection humps are weak or absent, perhaps because the reflection signature is swamped by a beamed continuum. All of these require further detailed observations. In GBHC the accretion disk is ionized and the reflection spectra show smeared absorption and emission feature, and there is debate as to the precise nature of the accretion flow within a few tens of Schwarzschild radii of the black hole.
Over the past decade observations of the broad iron line have provided an unprecedented probe of the region within a few tens of Schwarzschild radii of the black hole event horizon. The next generation of X-ray observatories, beginning with XMM–Newton, will address many of the puzzling questions we have, and significantly enhance our understanding of these enigmatic objects.
Acknowledgements
We thank Mateusz Ruszkowski for comments on the manuscript. ACF thanks the Royal Society for support. CSR appreciates support from Hubble Fellowship grant HF-01113.01-98A. This grant was awarded by the Space Telescope Institute, which is operated by the Association of Universities for Research in Astronomy, Inc., for NASA under contract NAS 5-26555.
References
- (1) Agol E., Krolik J. H., 2000, ApJ, 528, 161
- (2) Anders E., Grevesse N., 1989, Geochim. Cosmochim. Acta, 53, 197
- (3) Antonucci R., 1993, ARA&A, 31, 473
- (4) Antonucci R., Hurt T., Agol E., 1996, ApJ, 456, L25
- (5) Bai T., Ramaty R., 1978, ApJ, 219, 705
- (6) Basko M. M., 1978, ApJ, 223, 268
- (7) Begelman M. C., Bland-Hawthorn J., 1997, Nat, 385, 22
- (8) Beloborodov A., 1999, ApJ, 510, 123
- (9) Blackman E., 1999, MNRAS, 306, L25
- (10) Bromley B. C., Miller W. A., Pariev V. I., 1998, Nat, 391, 54
- (11) Chen K., Halpern J.P., Fillipenko A.V., 1989, ApJ, 339, 742
- (12) Chiang J. et al., 2000, ApJ, 528, 292
- (13) Dabrowski, Y. et al., 1997, MNRAS, 288, L11
- (14) Done C., Życki, P.T., 1999, MNRAS, 305, 457
- (15) Done C., Madejski G, M., Zycki P., 2000, ApJ, in press (astro-ph/0002023)
- (16) Ebisawa K., Ueda Y., Inoue H., Tanaka Y., White N.E., 1996, ApJ, 467, 419
- (17) Eracleous M., Halpern J. P., Livio M., 1996, ApJ, 459, 89
- (18) Eracleous M., Sambruna R. M., Mushotzky R. F., ApJ, in press (astro-ph/0002265)
- (19) Fabian A.C., Nandra K., Reynolds C.S., Brandt W.N., Otani C., Tanaka Y., Inoue H., Iwasawa K., 1995, MNRAS, 277, L11
- (20) Fabian A.C., Rees M.J., Stella L., White N.E., 1989, MNRAS, 238,729
- (21) Fanton C., Calvano M., de Felice F., Cadez A., 1997, PASJ, 49, 159
- (22) George I.M., Fabian A.C., 1991, MNRAS, 249, 352
- (23) Ghisellini G., Haardt F., Matt G., 1994, MNRAS, 267, 743
- (24) Gierliński M., Zdziarski A.A., Done C., Johnson W.N., Ebisawa K., Ueda Y., Haard F., Philps B.F., 1997, MNRAS, 288, 958
- (25) Grandi P et al., 1999, A&A, 343, 33
- (26) Guainazzi M., Mihara T., Otani C., Matsuoka M., 1996, PASJ, 48, 781
- (27) Guainazzi M. et al., 1998, MNRAS, 301, L1
- (28) Guainazzi M. et al., 1999, A&A, 341, L27
- (29) Guilbert P.W., Rees M.J., 1988, MNRAS, 233, 475
- (30) Hartnoll S. A., Blackman E. G., 2000, MNRAS, in press.
- (31) Ichimaru S., 1977, ApJ, 214, 840
- (32) Iwasawa K., Taniguchi Y., 1993, ApJ, 413, L15
- (33) Iwasawa, K. , Fabian A.C., Mushotzky R.F., Brandt W.N., Awaki H., Kunieda H., 1996a, MNRAS, 279, 837
- (34) Iwasawa, K. et al., 1996b, MNRAS, 282, 1038
- (35) Kormendy J., Richstone D., 1995, ARA&A, 33, 581
- (36) Krolik J. H., 1999, ApJ, 515, L73
- (37) Krolik J. H., Begelman M. C., 1988, ApJ, 329, 702
- (38) Laor, A., 1991, ApJ, 376, 90
- (39) Lee J., Fabian A. C., Reynolds C. S., Brandt W. N., Iwasawa K., 2000, MNRAS, submitted
- (40) Lee J., Fabian A. C., Brandt W. N., Reynolds C. S., Iwasawa K., 1999, MNRAS, 310, 973
- (41) Lightman A.P., White T.R., 1988, ApJ, 233, 57
- (42) Magorrian J., et al., 1998, AJ, 115, 2285
- (43) Makishima K. et al., 1994, PASJ, 46, L77
- (44) Martocchia A., Matt G., 1996, MNRAS, 282, L53
- (45) Martocchia A., Karas V., Matt G., 2000, MNRAS, 312, 817
- (46) Matsuoka M., Piro L., Yamauchi M., Murakami T., 1990, ApJ, 361, 400
- (47) Matt G., Fabian A.C., Reynolds C.S., 1997, MNRAS, 281, 175
- (48) Matt G., Fabian A.C., Ross R.R, 1996, MNRAS, 280, 823
- (49) Matt G., Fabian A.C., Ross R.R., 1993, 262, 179
- (50) Matt, G., Perola, G.C., Piro L., 1991, AaA, 247, 25
- (51) Misra R., 1999, IUCAA preprint 32/99.
- (52) Misra R., Kembhavi A. K., 1998, ApJ, 499, 205
- (53) Misra R., Sutaria F. K., 1999, ApJ, 517, 661
- (54) Mushotzky R.F., Fabian A.C., Iwasawa K., Kunieda H., Matsuoka M., Nandra K., Tanaka Y., 1995, MNRAS, 272, L9
- (55) Nandra K., et al 1995, MNRAS, 276, 1
- (56) Nandra K., George I.M., 1994, MNRAS, 267, 974
- (57) Nandra K., George I.M., Mushotzky R.F., Turner T.J., Yaqoob T., 1997a, ApJ, 477, 602
- (58) Nandra K., George I.M., Mushotzky R.F., Turner T.J., Yaqoob Y., 1997b, ApJ, 488, 91
- (59) Nandra K., Mushotzky R.F., Yaqoob T., George I.M., Turner T.J., 1997c, MNRAS, 284, L7
- (60) Nandra K., George I. M., Mushotzky R. F., Turner T. J., Yaqoob T., 1999, ApJ, 523, L17
- (61) Narayan R., Yi I., 1995, ApJ, 452, 710
- (62) Narayan R., Yi I., 1994, ApJ, 428, L13
- (63) Nayaksin S., Kazanas D., Kallman T. R., 2000, ApJ, submitted (astro-ph/9909359)
- (64) Negoro H., Kitamoto S., Takeuchi M., Mineshige S., 1995, ApJ, 452, L49
- (65) Nishiura S., Murayama T., Taniguchi Y., 1998, ApJ, 492, L25
- (66) Novikov I. D., Thorne K. S., 1973, in Black Holes, eds C. DeWitte & B. S. DeWitte (Gordon and Breach Science Publicaters, New York), P.344
- (67) Otani C. et al., 1996, PASJ, 48, 211
- (68) Paczyński B., 2000, ApJ, submitted
- (69) Pariev V. I., Bromley B. C., 1998, ApJ, 508, 590
- (70) Pounds K.A., Nandra K., Stewart G.C., George I.M., Fabian A.C., 1990, Nature, 344, 132
- (71) Ptak A., 1997, PhD thesis, Univ. of Maryland
- (72) Rees M. J., 1982, in Riegler G., Blandford R. D., eds, The Galactic Center, Am. Inst. Phys., New York, p.166.
- (73) Reeves J.N., et al., 2000, MNRAS, 312, L17
- (74) Revnivtsev M, Gilfanov M., Churazov E, 1999, A&A, 347, L23
- (75) Reynolds C. S., 1996, Ph.D thesis, Univ. of Cambridge.
- (76) Reynolds C. S., Iwasawa I., Crawford C. S., Fabian A. C., 1998, MNRAS, 299, 410
- (77) Reynolds C. S., 2000, ApJ, in press (astro-ph/9912001)
- (78) Reynolds C. S., Nowak M. A., Maloney P. R., 2000, ApJ, in press (astro-ph/0004068)
- (79) Reynolds C. S., Wilms J., 2000, ApJ, in press (astro-ph/9912120)
- (80) Reynolds, C.S., 1997, MNRAS, 286, 513
- (81) Reynolds, C.S., Ward, M.J., Fabian A.C., Celotti A., 1997, MNRAS, 291, 403
- (82) Reynolds, C.S., Begelman, M.C., 1997, ApJ, 488, 109
- (83) Reynolds, C.S. Young A.J., Begelman M.C., Fabian A.C., 1998, ApJ submitted
- (84) Ross, R.R., Fabian, A.C., 1993, MNRAS, 261, 74
- (85) Ross, R.R., Fabian, A.C., Brandt W.N., 1996, MNRAS, 278, 1082
- (86) Ross R. R., Fabian A. C., Young A. J., 1999, MNRAS, 306, 461
- (87) Ruszkowski M., Fabian A. C., 2000, MNRAS, in press (astro-ph/9912321)
- (88) Ruszkowski M., Fabian A. C., 2000, MNRAS, submitted
- (89) Sambruna R. M., Eracleous M., Mushotzky R. F., 1999, ApJ, 526, 60
- (90) Shakura N. L., Sunyaev R. A., 1973, A&A, 24, 337
- (91) Skibo, J.G., 1997, ApJ, 478, 522
- (92) Tanaka, Y. et al., 1995, Nature, 375, 659
- (93) Turner T.J., George I.M., Nandra K., Mushotzky R.F., 1998, ApJ, 493, 91
- (94) Wang J., Zhou Y., Wang T., 1999, ApJ, 523, L129
- (95) Weaver K. A., Nousek J., Yaqoob T., Mushotzky R. F., Makino F., Otani C., 1996, ApJ, 458, 160
- (96) Weaver K. A., Krolik J. H., Pier E. A., 1998, ApJ, 498, 213
- (97) Weaver K. A., Reynolds C. S., 1998, ApJ, 503, L39
- (98) Woźniak P. R., Zdziarski A. A., Smith D., Madejski G. M., Johnson W. N., 1998, MNRAS, 299, 449
- (99) Yaqoob T., Serlemitsos P. J., Turner T. J., George I. M., Nandra K., 1996, ApJ, 470, L27
- (100) Young A. J., Reynolds C. S., 2000, ApJ, 529, 101
- (101) Young A.J., Ross R.R., Fabian A.C., 1998, MNRAS, 300, L11
- (102) Young A.J., Fabian A.C., Tanaka Y., Ross R.R., 2000, MNRAS, submitted
- (103) Zdziarski A.A., et al 1994, MNRAS, 269, L55
- (104) Zdziarski A.A., Lubiński P., Smith D.A., 1999, MNRAS, 303, 117