601 Campbell Hall, Berkeley CA 94720, USA 22institutetext: Institute of Astronomy, Madingley Road, Cambridge CB3 0HA, UK
email: bunker@ast.cam.ac.uk 33institutetext: Jet Propulsion Laboratory, California Institute of Technology, MS 169-327, Pasadena CA 91109, USA 44institutetext: Steward Observatory, University of Arizona, Tucson AZ 85721, USA 55institutetext: Astrophysics Department, 1 Keble Road, Oxford OX1 3RH, UK 66institutetext: Kitt Peak National Observatory, 950 N. Cherry Ave., Tucson AZ 85726, USA 77institutetext: Department of Physics & Astronomy, The John Hopkins University, Baltimore MD 21218, USA
Stellar Populations and Galaxy Morphology at High Redshift
Abstract
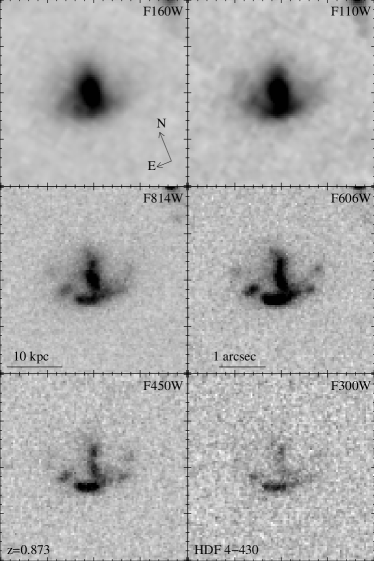
In this article we investigate the morphology and stellar populations of high-redshift galaxies through multi-waveband HST imaging and ground-based spatially-resolved spectroscopy. We study the redshift evolution of galaxy morphology in the Hubble Deep Field, using the deep IDT-NICMOS near-infrared HST imaging coupled with spectroscopic and photometric redshifts. Using the multi-waveband data to compare the appearance of galaxies at the same rest-frame wavelengths reveals that morphological -corrections (the change in appearance when viewing high- objects at shorter rest-frame wavelengths) are only important in a minority of cases, and that galaxies were intrinsically more peculiar at high redshift. One example of significant morphological -corrections is spiral galaxies, which often show more pronounced barred structure in the near-infrared than in the optical. Therefore, the apparent decline in the fraction of barred spirals at faint magnitudes in the optical HDF may be due to band-shifting effects at the higher redshifts, rather than intrinsic evolution.
Using such features as the age-sensitive Balmer4000 Å break, the spatially-resolved colours of distant galaxies in optical/near-infrared imaging can also be used to study their component stellar populations. We supplement this with deep Keck/LRIS spectroscopy of two extended sources: a chain galaxy at (HDF 4-555.1, the “Hot Dog” – the brightest -drop Lyman-break galaxy in the HDF) and a pair of gravitationally lensed arcs behind the cluster Abell 2390. The absence of measurable rotation across the chain galaxy implies that it is unikely to be a disk viewed edge on. With the resolution enhancement from lensing, we detect stellar populations of different ages in the arcs. The Ly- emission powered by the HII regions is spatially offset from the star-forming knots in these arcs, possibly as a result of resonant scattering by neutral hydrogen.
1 Introduction
Until recently, the study of the most distant galaxies was very restricted: unresolved ground-based imaging gave measurements of the global colours; noisy spectra revealed AGN- or starburst-driven emission lines; and WFPC 2 imaging with the Hubble Space Telescope (HST) showed the shape of high-redshift galaxies in their unfamiliar rest-frame ultraviolet light. However, our knowledge has radically increased through the light-gathering power of the Keck telescopes, and the availability of the near-infrared NICMOS camera on HST. Deep Keck spectra showing the rest-ultraviolet continuum and stellar- and ISM-absorption features in galaxies (e.g., Steidel et al. 1996b; Pettini et al. 2000) has opened the door to spectroscopic study of stellar populations in the distant Universe. A complementary approach to exploring the composition of high-redshift objects comes from multi-waveband HST imaging from the ultraviolet to the near-infrared, which provides the resolution necessary to study their spatially-resolved stellar populations.
Morphology offers a window on the evolutionary status of galaxies. However, because of band-shifting effects, the interpretation of the shape of galaxies hinges on knowledge of their redshifts and spectral energy distributions (SEDs). In this article we explore this through high resolution optical/near-infrared imaging and deep spectroscopy of distant galaxies. To resolve the issue of whether the peculiar galaxies which dominate the number counts at faint magnitudes are the counterparts of local irregulars or whether their morphological peculiarity is due mainly to band-shifting effects at high redshift, an unbiased study of the rest-frame optical morphological properties is demanded, where the effects of dust and recent star formation are less dominant than in the rest ultraviolet. In Section 2 we address this by analysing the IDT-NICMOS images of the northern Hubble Deep Field (HDF). In Section 3 we present a case study of the brightest galaxy in the HDF. This example, HDF 4-555.1 (known as the “Hot Dog”), is a highly elongated system and is sufficiently extended to allow resolved ground-based spectroscopy, which we have obtained with Keck/LRIS (Oke et al. 1995). We use a similar approach to explore the stellar populations in a pair of gravitationally-lensed arcs behind the cluster Abell 2390, which is described in Section 4. Throughout, we assume a cosmology where , and , unless otherwise stated. All magnitudes in this paper are with respect to the AB system (Oke & Gunn 1983) where .
2 Galaxy Morphology and its Redshift Evolution
With ground-based seeing, the study of galaxy morphology was restricted to redshifts of no more than a few tenths. The advent of HST, and its resolution of 0.1\arcsec, has revolutionized this field. Results from projects such as the HST Medium Deep Survey (MDS, Griffiths et al. 1994ab) have shown that at faint magnitudes () an increasing fraction of galaxies do not conform to the traditional categories (e.g., Glazebrook et al. 1995; Driver et al. 1995). The first Hubble Deep Field (Williams et al. 1996) dramatically pushed this study to even lower fluxes, tracing sub- galaxies to high redshift. The optical images of the HDF show that by , the conventional Hubble sequence no longer provides an adequate description of many or most galactic systems (Abraham et al. 1996; Driver et al. 1998). Indeed, at higher redshifts we may be seeing new classes of galaxy emerge with no local counterpart, such as the ‘chain galaxies’ (Section 3 and Cowie, Hu & Songaila 1995) and ‘tadpoles’ (van den Bergh et al. 1996).
Some of these faint sources are intrinsically under-luminous peculiar galaxies at modest redshift. However, the median redshift has risen to for a limiting magnitude of (Lanzetta, Fernández-Soto & Yahil 1997). Hence, in the faint magnitude régime, band-shifting effects become important: the optical passbands sample shorter rest-frame wavelengths in galaxies at the higher redshifts, and large “morphological -corrections” can arise (e.g., Odehahn et al. 1996). At , the appearance in the observed optical is dominated by regions of recent star formation, luminous in the rest-frame ultraviolet on account of the massive, short-lived OB stars. Indeed, Colley et al. (1996) suggest that the observed peak in the two-point angular correlation function of the optical HDF at is due to mis-classifying multiple compact star-forming regions within larger high-redshift galaxies as separate systems, exacerbated by the cosmological bolometric surface-brightness dimming which boosts the contrast between the compact star-forming knots and the more diffuse host galaxy.
2.1 High-Resolution Imaging in the Near-Infrared
The rest-optical is a far better tracer of the dynamical mass of a galaxy than the ultraviolet. This suggests a strategy of high-resolution imaging in the near-infrared; the - and -bands in the rest-frame of a galaxy are well approximated by the - and -passbands, and multi-colour imaging out to the -band can trace the rest-frame -band morphology of galaxies as far as . However, until recently there has been no high-resolution infrared data set which reaches a limiting flux comparable to the optical HDF.
The Instrument Development Team (IDT) of the HST NICMOS camera (Thompson et al. 1998) have imaged an area of the northern HDF to unprecedented depth in the near-infrared, observing for 49 orbits in each of the F110W and F160W filters (centered at m and m and similar to the ground-based - and -bands). The widest-field NIC 3 camera was used to survey a portion of the HDF. A detailed description of the observations and data reduction are given by Thompson et al. (1999). Once we correct for different resolutions of NIC 3 and WFPC 2 (through “PSF matching”), we can use the spatially-resolved colours to study different stellar populations and/or dust-reddening within a galaxy (see Figs. 2 & 5).
2.2 The Transformation of Spiral Galaxies with Wavelength
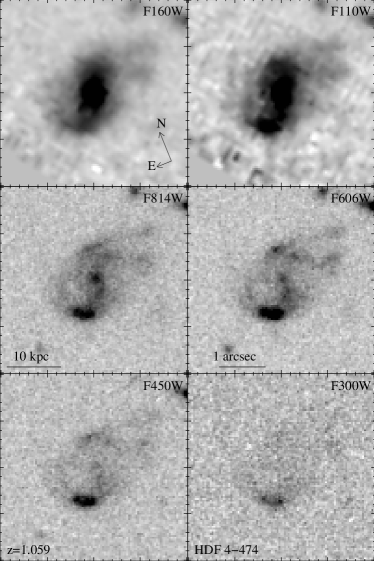
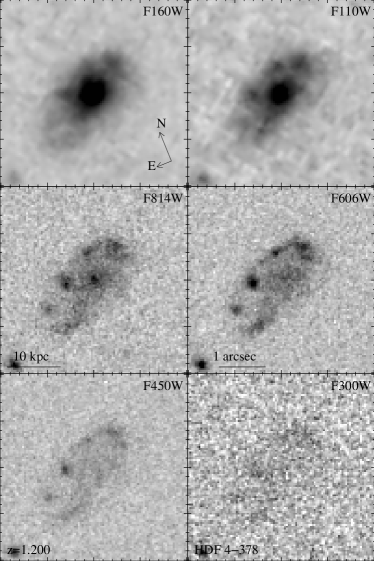
One of the most visually striking differences between the optical and near-infrared HDF images are spiral galaxies at moderately-high redshift (). At NICMOS wavelengths (the rest-optical), many of these are clearly classic spirals, and therefore dynamically-evolved stable systems which certainly should not fall under the banner of morphological peculiars. However, as illustrated in Fig. 2, moving to the rest-UV shifts the classification toward a much later Hubble type – i.e., becoming more irregular (Bunker, Spinrad & Thompson 1999). In extreme cases, the galaxy appearance is such a strong function of wavelength that some systems which resemble small groups of tidally-interacting sub-galactic clumps in the WFPC 2 optical images are only unveiled as nucleated spirals by the infrared observations. A classic example is the galaxy HDF 4-474.0 at (Cohen et al. 1996) which is totally dominated by an off-centre star forming H II region in the - and -images, but transforms into a ‘grand design’ face-on spiral in the near-infrared (Fig. 2a). Spiral bulges are dominated by cool giants, and so brighten at the redder wavelengths; in the case of HDF 4-378 (at an estimated photometric redshift of , Fernández-Soto, Lanzetta & Yahil 1999) the bulge is totally absent from the observed optical passbands, but dominates the infrared light (Fig. 2b). This is reminiscent of the far-UV 1500 Å imaging with UIT of the local spiral, M81, presented in O’Connell (1997).


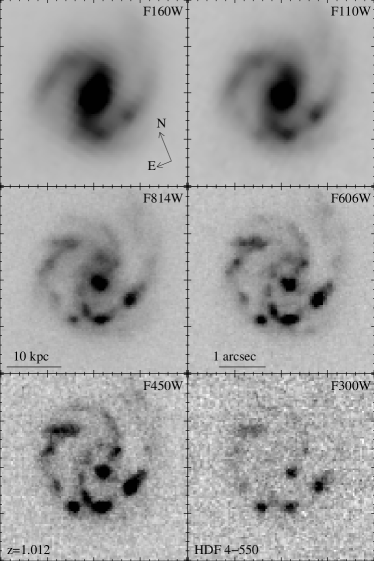
From the optical HDF, there also appears to be strong redshift evolution in the relative fraction of galactic bars. Indeed, van den Bergh et al. (1996) report just one barred spiral in the whole of HDF-North. More recently, Abraham et al. (1999) have found similar evolution in the WFPC 2 images of HDF-South (Williams et al. 1999), with a marked decline at in the proportion of barred spirals in both fields. If this is a truly evolutionary effect, then it has great significance for the physics of disk formation. However, once again the effects of large morphological -corrections at higher-redshifts makes the case for evolution inferred from the apparent decline of barred spirals at faint optical magnitudes less clear cut. Bars are dominated by older stellar populations, with similar colors to bulges (de Vaucouleurs 1961), and so are prominent at redder wavelengths. In the rest ultraviolet, the star forming regions in the disk will typically dominate the light, and a spiral which would be identified as being barred when viewed in the rest optical may be (mis-)classified as unbarred at shorter wavelengths. Examination of the IDT-NICMOS images reveals bars in the near-infrared which are undetected in the WFPC 2 images (e.g., Fig. 3b at ); hence, claims of evolution in the frequency of galactic bars based on optical data alone should be treated with some caution.
2.3 The Redshift Evolution in the Fraction of Truly Peculiar Systems
Using the six wavebands from the WFPC 2 and IDT-NICMOS imaging of the Hubble Deep Field, we have compared galaxy morphology at the same rest-frame wavelengths. Where available, we use the spectroscopically-measured redshifts (from Cohen et al. 1996 unless otherwise noted). Where no published spectroscopic redshift exists, we adopt the photometric redshift estimate of Fernández-Soto, Lanzetta & Yahil (1999). Figure 3 of Bunker (1999) shows the rest-frame -band of all the galaxies in the IDT-NICMOS field brighter than , which extends out to .
Down to (the brightest 100 galaxies in IDT-NICMOS field), only about 1/6 of galaxies change their appearance greatly between the WFPC 2 and NICMOS images – these have large morphological -corrections. Of the remaining number, about half of the galaxies retain the same morphology in all wavebands (above the redshifted Lyman break) and are “true peculiars”. Hence, the increased fraction of unusually-shaped systems at faint optical magnitudes is largely due to evolution rather than simply band-shifting effects. The remaining third of galaxies are too compact for changes in morphology to be ascertained (limited by the NIC 3 PSF, which has a FWHM of arcsec), and this fraction increases greatly at magnitudes fainter than . For most cosmologies, the higher-redshift systems are on average more compact, once allowance has been made for the fact that the higher-redshift systems are intrinsically more luminous in this apparent-magnitude limited sample.
3 The “Hot Dog” – A Study of a Chain Galaxy in the HDF
Some high-redshift galaxies which fall outside the traditional Hubble tuning-fork diagram belong to new morphological groups, such as tadpoles (van den Bergh et al. 1996) and ‘bow-shock’ systems (Fig. 5). A class which has received much attention is that of ‘chain galaxies’ (Cowie, Hu & Songaila 1995). It has been widely speculated that chain galaxies are linearly-organized giant star-forming regions, although some have argued that they might be galactic disks viewed edge-on (e.g., Dalcanton & Shectman 1996). It is unlikely that most of the chain galaxies are gravitational lensing phenomena, as the incidence of potential foreground lenses is small.
The brightest ‘-drop’ galaxy in the HDF is a chain galaxy, quite unlike the bulk of the Lyman-break population which are compact and isolated (Giavalisco, Steidel & Macchetto 1996). This galaxy, HDF 4-555.1 (see Fig. 5 and Steidel et al. 1996a, source C4-06), has been dubbed “the Hot Dog” because of its highly-elongated morphology – it is extended over , and clearly resolved even in ground-based seeing.
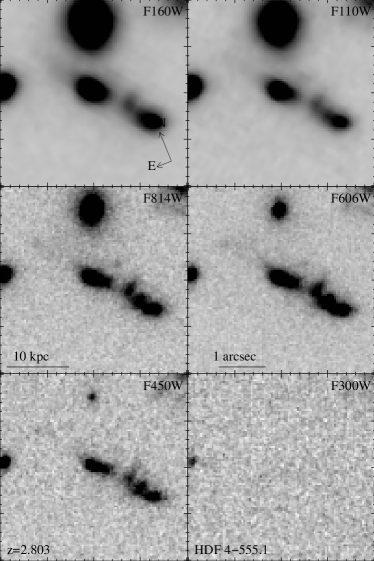
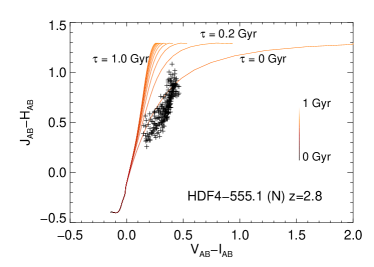
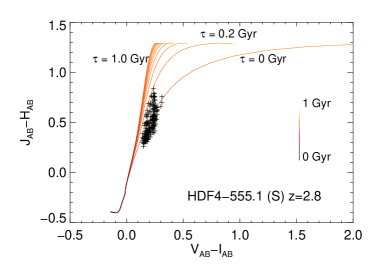
Examining the spatially-resolved colors of the Hot Dog reveals that both of the prominent lobes are well fit with young stellar populations ( Myr), although the southern component is bluer on average and exhibits a much smaller dispersion in colors than the northern (Fig. 5). This indicates that the star formation history of the northern component is more extended in time, or that the dust extinction along its length varies more than for the southern lobe. There is little evidence for a significant underlying older stellar population, which might be expected in a disk viewed edge-on.
We have obtained deep, spatially-resolved optical spectroscopy with
Keck/LRIS, using a long slit aligned along the major axis of the Hot Dog
(Bunker et al. 1998b). Our 14 ksec spectra
() sample the rest-frame ultraviolet ( Å), a region
devoid of strong forbidden emission lines. However, many of the
resonance lines associated with hot stellar winds do appear, although
their P Cygni profiles are less extended in velocity than those observed
in some local star-bursts. The overall rest-ultraviolet continuum also
indicates that the Hot Dog is an actively star-forming galaxy, albeit
with internal dust extinction of .
The presence of high-ionization N V and He II
in emission demands at least some O-stars. Ly- emission is
completely suppressed, and the absorption profile can be fit by a
combination of stellar photospheric absorption and a modest interstellar
hydrogen column of (a
borderline damped system). The Hot Dog exhibits some of the strongest
interstellar absorption features seen in the Lyman-break
population. However, a search for velocity gradients in these lines
along the major axis of this chain galaxy revealed that any systemic
rotation must be small (), inconsistent with an
edge-on rotating disk.
We also serendipitously discovered in our long-slit spectroscopy a compact companion galaxy, HDF 4-497.0, with Ly- emission ( Å) at a redshift within of the Hot Dog, and a projected separation of kpc. The flux in the Ly- line of this companion galaxy is , and the rest-ultraviolet continuum suggests a star formation rate of . The existence of this companion closely aligned along the major axis of the chain galaxy offers support to the contention that this is an example of star formation triggered by collapse along a filament.
As we have spatially-resolved spectroscopy of an extended high-redshift source, we can also use our data as a probe of the dimensions of intervening absorbers without being restricted to the one-dimensional sightlines avalable from QSOs. Our spatially-resolved spectroscopy reveals Mg II 2796/2803 Å absorption by a foreground system at . This absorption is most likely associated with the galaxy HDF 4-516.0 which has a photometric redshift consistent with the absorption lines, and is at a projected distance of 2 arcsec from the Hot Dog. The Mg II absorption is only pronounced in the northern component of the Hot Dog, and the absence of strong absorption in the southern component enables us to constrain the physical size of the Lyman limit system (the optically-thick halo) of this galaxy to be kpc.
4 Resolving the Stellar Populations in a Lensed Galaxy
Gravitational lensing can be used as a tool to increase the resolution attainable in studies of distant galaxies. Although morphological information is hard to disentangle because of the geometric distortions and uncertainties in lens modelling, the amplification afforded by strong lensing can allow the stellar populations to be mapped on the sub-kpc scale, as well as magnifying the total flux.
4.1 Optical/Near-Infrared Imaging of Lensed Arcs at
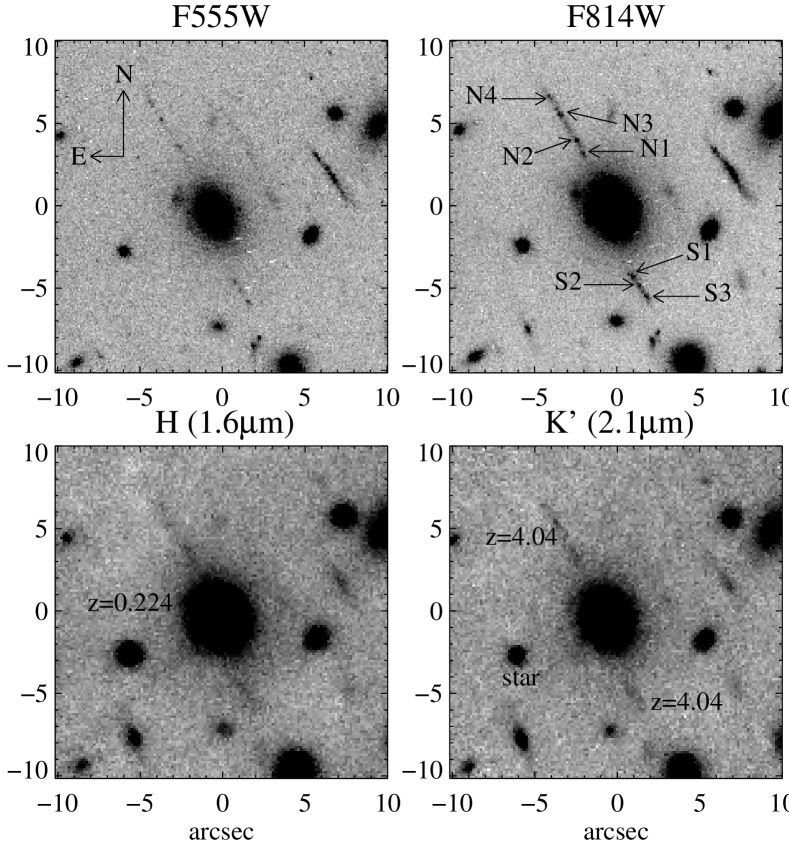
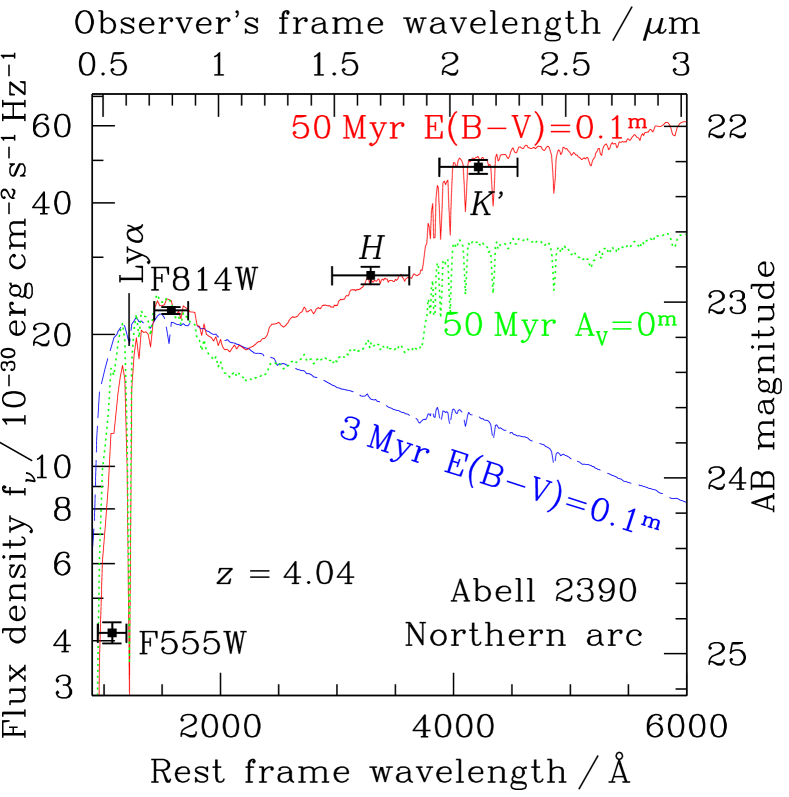
Combining archival HST/WFPC 2 data with deep near-infrared imaging taken with Keck/NIRC (Matthews & Soifer 1994) in good seeing, we have measured the spatially-resolved colours in a galaxy, gravitationally lensed by the rich cluster Abell 2390 () into a pair of highly-magnified near-linear arcs 3–5\arcsec in length (Frye & Broadhurst 1998). At the redshift of these arcs, the (m) and (m) near-infrared pass-bands straddle the age-sensitive rest-frame 4000 Å Balmer break (Fig. 6). Comparison of the optical and near-infrared photometry with a suite of spectral evolutionary models (the latest version of Bruzual & Charlot 1993) has enabled us to map the underlying stellar populations and differential dust extinction (Bunker et al. 1998a). The WFPC2 images clearly reveal several knots, bright in the rest-ultraviolet, which correspond to sites of active star formation. However, there are considerable portions of the arcs are significantly redder, consistent with being observed Myr after star formation has ceased, with modest dust extinction of . There is degeneracy in the models between dust reddening and age for the optical/near-infrared colours, but the most extreme scenario where the colour gradients are solely due to heavy dust reddening of an extremely young stellar population are strongly ruled out by upper limits in the far-infrared/sub-mm from ISO/SCUBA (Lémonon et al. 1998; Blain et al. 1998).


4.2 Keck/LRIS Spectroscopy
We have obtained optical spectroscopy from Keck/LRIS at moderate dispersion () with a long slit aligned along the major axis of the arcs (Fig. 7). Our 4 ksec spectrum shows regions with Ly- in emission that are adjacent to some of the bright knots seen in the optical HST images which sample the rest-frame ultraviolet (Figs. 7 & 9). The non-detections of N V 1240 Å, C IV 1549 Å & He II 1640 Å strongly favor the interpretation that the Ly- arises from the Lyman continuum flux produced by OB stars, rather than the harder ultraviolet spectrum of an AGN. We see the Ly- line morphology extending beyond the ultraviolet continuum, which we attribute to resonant scattering from H I (Bunker, Moustakas & Davis 2000). In the bright knots, the SEDs are consistent with a very young stellar population ( Myr) or ongoing star formation.

4.3 Evolutionary Status of the Galaxy
We have evidence for both ongoing star formation and regions of older stellar populations in the lensed arcs. It is therefore unlikely that this system in a true ‘primæval’ galaxy, viewed during its first major burst of star formation. Rather, our results suggest that the star formation history of this system has not been coeval, with current activity concentrated into small pockets within a larger, older structure. Correcting for the gravitational amplification (estimated to be from lens models), the intrinsic properties of the galaxy are comparable to the Lyman-break selected population of Steidel et al. (1996b,1999). The current extinction-corrected star formation rate ( for ) may be adequate to ‘build’ an galaxy over a Hubble time, but a more likely scenario may be the creation of a sub-unit which will undergo subsequent merging with nearby systems (such as the other galaxy identified in this field by Pelló et al. 1999) to assemble hierarchically the massive galaxies of today.


5 Conclusions
In this article, we have explored spatially-resolved stellar populations at high-redshift, and addressed the impact on studies of galaxy morphology. The deep, high-resolution IDT-NICMOS near-infrared imaging of a portion of the northern Hubble Deep Field has been combined with the WFPC 2 data and photometric redshift estimates to study the redshift evolution of morphology, comparing galaxy appearance at the same rest-wavelengths. Some Hubble tuning-fork galaxies only reveal their true morphology in the near-infrared images. This is particularly so for galaxies with a large dispersion in stellar ages and spatially-distinct stellar populations, such as spiral galaxies which sometimes exhibit galactic bars in the NICMOS images which are invisible at shorter wavelengths. However, galaxies which do undergo a morphological metamorphosis from the WFPC 2 to NIC 3 images are in the minority; most galaxies retain the same appearance in all wavebands, or are too compact for the structural parameters to be determined. Once the morphological -corrections have been accounted for, it appears that the fraction of galaxies falling outside the Hubble sequence does increase at faint magnitudes/high-. Many of these “true peculiars” show evidence of being dynamically disturbed (possibly through mergers) with recent star formation activity. From the HST imaging and resolved spectroscopy with Keck/LRIS, we have shown that a chain galaxy in the HDF has a predominantly young stellar population and no significant rotation, and is thus unlikely to be an edge-on disk galaxy. Using gravitational amplification to increase our resolution, we have also resolved the stellar populations on sub-kpc scales in a system of lensed arcs.
The analysis of galaxy morphologies and colours in multi-waveband imaging, coupled with resolved spectroscopy, provides a valuable probe into the stellar populations and evolution of galaxies. A natural progression is to use the integral field unit spectrographs currently being developed. Spectroscopy of spatially-resolved stellar populations in the high-redshift Universe will be a major scientific goal for NGST and the next generation of large ground-based telescopes with adaptive optics.
Acknowledgments
AJB acknowledges a NICMOS postdoctoral fellowship while at Berkeley (grant NAG 5-3043), and a U.K. PPARC observational rolling grant at the Institute of Astronomy in Cambridge (ref. no. PPA/G/O/1997/00793). The observations were obtained in part with the NASA/ESA Hubble Space Telescope operated by the Space Telescope Science Institute manged by the Association of Universities for Research in Astronomy Inc. under NASA contract NAS 5-26555. Some of the data presented herein were obtained at the W. M. Keck Observatory, which is operated as a scientific partnership among the California Institute of Technology, the University of California and the National Aeronautics and Space Administration. The Observatory was made possible by the generous financial support of the W. M. Keck Foundation. We are grateful to Mark Dickinson, Chuck Steidel, Lisa Storrie-Lombardi & Ray Weymann for useful discussions, and Brenda Frye and Tom Broadhurst for providing details of their arcs in advance of publication. We have made use of the spectral evolutionary models of Gustavo Bruzual and Stéphane Charlot. We thank Hans Hippelein and Klaus Meisenheimber at the Max-Planck-Institut für Astronomie for organizing an enjoyable and informative meeting at Ringberg.
References
- [1] Abraham, R. G., Tanvir, N. R., Santiago, B. X., Ellis, R. S., Glazebrook, K., & van den Bergh, S. 1996, MNRAS, 279, 47P
- [2] Abraham, R. G. 1997, in “The UV Universe at Low- and High-”, ed. Waller, W. H., Faneli, M. N., Hollis, J. E., & Danks, A. C. AIP Press, vol. 408, p195, astro-ph/9802036
- [3] Abraham, R. G., Merrifield, M. R., Ellis, R. S., Tanvir, N. R., & Brinchmann, J. 1999, MNRAS, 308, 569
- [4] Blain, A. W., Kneib, J.-P., Ivison, R. I., & Smail, I. 1998, ApJ, 512, L87
- [5] A. Bruzual, G., & Charlot, S. 1993, ApJ, 405, 538
- [6] Bunker, A. J., Moustakas, L. A., Davis, M., Frye, B. L., Broadhurst, T. J., & Spinrad, H. 1998a, in “The Young Universe: Galaxy Formation and Evolution at Intermediate and High Redshift”, eds. D’Odorico, S., Fontana, A., & Giallongo, E., ASP Conf. Ser. Vol. 146, p182, astro-ph/9802150
- [7] Bunker, A. J., Stern, D., Spinrad, H., Dey, A., & Steidel, C. C. 1998b, BAAS, 192.7008
- [8] Bunker, A. J., Moustakas, L. A., & Davis, M. 2000, ApJ, 531, 95
- [9] Bunker, A. J., Spinrad, H., & Thompson, R. I. 1999, BAAS, 194.0403
- [10] Bunker, A. J. 1999, in “The OCIW Workshop on Photometric Redshifts”, eds. Weymann, R. J., Storrie-Lombardi, L., Sawicki, M., & Brunner, R., ASP Conf. Ser. Vol. 191, p317, astro-ph/9907196
- [11] Cohen, J. G., Cowie, L. L., Hogg, D. W., Songaila, A., Blandford, R., Hu, E. M., & Shopbell, P. 1996, ApJ, 471, L5
- [12] Colley, W. N., Rhoads, J. E., Ostriker, J. P., & Spergel, D. N. 1996, ApJ, 473, L63
- [13] Cowie, L. L., Hu, E. M., & Songaila, A. 1995, AJ, 110, 1576
- [14] Dalcanton, J. J.; Shectman, S. A. 1996, ApJ, 465, L9
- [15] de Vaucouleurs, G., 1961, AJ, 66, 629
- [16] Driver, S. P., Windhorst, R. A., Ostrander, E. J., Keel, W. C., Griffiths, R. E., & Ratnatunga, K. U. 1995, , ApJ, 449, L23
- [17] Driver, S. P., Fernández-Soto, A., Couch, W. J., et al. 1998, ApJ, 496, L93
- [18] Fernández-Soto, A., Lanzetta, K. M., & Yahil, A. 1999, ApJ, 513, 34
- [19] Frye, B. L., & Broadhurst, T. J. 1998, ApJ, 499, L115
- [20] Giavalisco, M., Steidel, C. C., & Macchetto, F. D. 1996, ApJ, 470, 189
- [21] Glazebrook, K. G., Ellis, R. S., Santiago, B. X., & Griffiths, R. 1995, MNRAS, 275, 19P
- [22] Griffiths, R. E., Casertano, S., Ratnatunga, K. U., et al. 1994a, ApJ, 435, L19
- [23] Griffiths, R. E., Ratnatunga, K. U., Neuschaefer, L. W., et al. 1994b, ApJ, 437, 67
- [24] Lémonon, L., Pierre, M., Cesarsky, C. J., Elbaz, D., Pelló, R., Soucail, G., & Vigroux, L. 1998, A&A, 334, L21
- [25] Matthews, K., & Soifer, B. T. 1994, in “Infrared Astronomy with Arrays: the Next Generation”, ed. McLean, I., Dordrecht: Kluwer Academic Publishers, p239
- [26] O’Connell, R. W. 1997, in “The UV Universe at Low- and High-”, ed. Waller, W. H., Faneli, M. N., Hollis, J. E., & Danks, A. C. AIP Press, vol. 408, p11
- [27] Odewahn, S. C., Windhorst, R. A., Keel, W. C., & Driver, S. P. 1996, ApJ, 472, L13
- [28] Oke, J.B. & Gunn, J. 1983, ApJ, 266, 713
- [29] Oke, J.B., Cohen, J.G., Carr, M., et al. 1995, PASP, 107, 375
- [30] Pelló, R., Kneib, J.-P., Le Borgne, J.-F., et al. 1999, A&A, 346, 359
- [31] Pettini, M., Kellogg, M., Steidel, C. C., Dickinson, M., Adelberger, K. L., & Giavalisco, M. 1998, ApJ, 508, 539
- [32] Pettini, M., Steidel, C. C., Adelberger, K. L., Dickinson, M., & Giavalisco, M. 2000, ApJ, 528, 96
- [33] Steidel, C. C., Giavalisco M., Dickinson M. E., & Adelberger K. L. 1996a, AJ, 112, 352
- [34] Steidel, C. C., Giavalisco, M., Pettini, M., Dickinson, M., & Adelberger, A. 1996b, ApJ, 462, L17
- [35] Steidel, C. C., Adelberger, K. L., Giavalisco, M., Dickinson, M. E., & Pettini, M. 1999, ApJ, 519, 1
- [36] Thompson, R. I., Rieke, M., Schneider, G., Hines, D., & Corbin, M. 1998, ApJ, 492, L95
- [37] Thompson, R. I., Storrie-Lombardi, L. J., Weymann, R. J., Rieke, M. J., Schneider, G., Stobie, E., & Lytle, D. 1999, AJ, 117, 17
- [38] van den Bergh, S., Abraham, R. G., Ellis, R. S., Tanvir, N. R., Santiago, B. X., & Glazebrook, K. G. 1996, AJ, 112, 359
- [39] Williams, R. E., Blacker, B., Dickinson, M., et al. 1996, AJ, 112, 1335
- [40] Williams, R. E., Baum, S. A., Bergeron, L. E., et al. 1999, BAAS, 193.7501