The First VLT FORS1 spectra of Lyman-break candidates in the HDF-S and AXAF Deep Field ††thanks: Based on observations collected at the European Southern Observatory, Paranal, Chile
Abstract
We report on low-resolution multi-object spectroscopy of 30 faint targets () in the HDF-S and AXAF deep field obtained with the VLT Focal Reducer/low dispersion Spectrograph (FORS1). Eight high-redshift galaxies with have been identified. The spectroscopic redshifts are in good agreement with the photometric ones with a dispersion at and at . The inferred star formation rates of the individual objects are moderate, ranging from a few to a few tens . Five out of the eight high-z objects do not show prominent emission lines. One object has a spectrum typical of an AGN. In the AXAF field two relatively close pairs of galaxies have been identified, with separations of 8.7 and 3.1 proper Mpc and mean redshifts of 3.11 and 3.93, respectively.
Key Words.:
Techniques: spectroscopic; Galaxies: evolution, formation, distances and redshifts1 Introduction
Observations of galaxies, now extending up to a redshift (Hu et al. (1999)), are starting to provide quantitative information on basic properties - number densities, luminosities, colors, sizes, morphologies, star formation rates (SFR), chemical abundances, dynamics and clustering - over a large span of cosmic time. These data are beginning to sketch out a direct picture not only of the physical processes taking place in the assembly of the first galaxies, but also of the formation and evolution of large scale structure (LSS) from the primordial density fluctuations. Quantitative information is now available about the evolution of the neutral hydrogen and metal content of the universe since , the galaxy luminosity function since , the morphology of field and cluster galaxies since . A recent dramatic addition to the general picture has been the discovery of a large population of actively star-forming galaxies at (Steidel et al., (1996), hereafter SGDA96). The “Lyman break” color-selection technique (Steidel & Hamilton, (1992)) has proved a reliable and highly efficient method to select galaxies in large numbers at , providing the first opportunity for statistical studies of evolutionary processes in galaxies beyond . Follow-up spectroscopy of the UV drop-out candidates on the Keck telescopes shows most to lie in the expected redshift range, , with successful redshift measurement for more than . The Lyman-break galaxies have spectra resembling those of nearby starburst galaxies, are strongly clustered, with a co-moving correlation length similar to present-day galaxies. SGDA96 inferred typical SFRs of for their galaxies, assuming a critical density universe. Dust corrections based on the UV continuum slope and on near-IR spectroscopy of a few objects suggest values larger by a mean factor of about 7 (Pettini et al., (1998)). From the width of saturated interstellar absorption lines, SGDA96 inferred tentative 1D velocity dispersions in the range , but Pettini et al. (1998) measure in the IR significantly narrower line-widths for the Balmer and [OIII] emission lines, albeit in a sample of only five objects.
A programme has been started with the ESO VLT to study systematically galaxies at with the aim to clarify the earliest phases of the processes leading to the formation of galaxies and LSS, reaching a redshift domain where observations are more cosmologically discriminant (Arnouts et al., (1999)) and taking advantage of a wide photometric coverage (in particular in the IR) to obtain mass estimates of the detected objects. We report here the results of pilot observations carried out during the commissioning and the science verification of the FORS1 instrument at the VLT-UT1.
2 The photometric databases and the selection of the candidates
Deep multicolor imaging of the HDF-S and AXAF deep field has been obtained from HST and from the ground. In particular WFPC2 data, consisting of deep images in the F300W, F450W, F606W and F814W filters, cover an area of 4.7 sq.arcmin reaching magnitude limits of 26.8, 27.7, 28.2 and 27.7 (in a 0.2 sq.arcsec area, Williams et al. (1999)). data over an area of 25 sq.arcmin, including the WFPC2 field, have been obtained at the ESO 3.5m New Technology Telescope (NTT) as a part of the ESO Imaging Survey (EIS) program (da Costa et al., (1999)). They reach limiting magnitudes of , , , , , , and . The EIS survey observed also the AXAF1 field (Benoist et al., (2000)). 25 sq.arcmin were covered in down to 27.0, 27, 26.5, 26.5 and 26, and 23.5. Photometric catalogs were derived from Lanzetta et al. (1999), da Costa et al. (1999) and Benoist et al. (2000). Lyman-break galaxy candidates were selected by the EIS team on the basis of two-color diagrams shortly after the EIS observations in order to provide targets for the FORS1 commissioning and Science Verification. A more refined selection has been carried out after the observations reported here on the basis of the photometric redshift technique described by Arnouts et al. (1999).
3 Spectroscopic Observations
The present data have been retrieved from the ESO Public Archive. Spectroscopic observations were carried out with the FORS1 instrument (Nicklas et al., (1997)) in multiple object spectroscopy (MOS) mode on December 1998 by the FORS1 Commissioning Team and on January 1999 for the FORS1 Science Verification (see http://www.eso.org/science/ut1sv/ and Cristiani, (1999)). In the FORS1 MOS mode 19 movable slit blade pairs can be placed in a FOV of sq.arcmin. The actual useful field in the direction of the dispersion is somewhat less and depends on the length of the spectra/dispersion. In the present case the Grism I150 was used, providing a useful field of sq.arcmin. One configuration of slits was observed in the HDF-S and two in the AXAF1. The journal of the observations is given in Table LABEL:tab:obs.
| Field | date | exp.time (s) | ||
|---|---|---|---|---|
| HDF-S | 22:32:46 | :34.1 | 1998-Dec-15 | 1800 |
| HDF-S | 22:32:46 | :34.1 | 1998-Dec-16 | 3600 |
| HDF-S | 22:32:46 | :34.1 | 1998-Dec-18 | 1800 |
| HDF-S | 22:32:46 | :34.1 | 1998-Dec-19 | 1800 |
| HDF-S | 22:32:46 | :34.1 | 1998-Dec-19 | 1800 |
| HDF-S | 22:32:46 | :34.1 | 1998-Dec-20 | 1800 |
| HDF-S | 22:32:46 | :34.1 | 1998-Dec-20 | 1800 |
| AXAF1/A | 03:32:08 | :46.0 | 1999-Jan-16 | 2100 |
| AXAF1/A | 03:32:08 | :46.0 | 1999-Jan-21 | 3600 |
| AXAF1/A | 03:32:08 | :46.0 | 1999-Jan-21 | 2200 |
| AXAF1/A | 03:32:08 | :46.0 | 1999-Jan-22 | 2100 |
| AXAF1/B | 03:32:08 | :46.0 | 1999-Jan-18 | 2100 |
| AXAF1/B | 03:32:08 | :46.0 | 1999-Jan-18 | 2100 |
| AXAF1/B | 03:32:08 | :46.0 | 1999-Jan-19 | 2100 |
| AXAF1/B | 03:32:08 | :46.0 | 1999-Jan-19 | 1600 |
| AXAF1/B | 03:32:08 | :46.0 | 1999-Jan-22 | 2100 |
When no suitable candidate was available for the allowed range of positions of a given slit, a random object in the field was chosen.
The MOS observations were reduced within the MIDAS package, using commands of the LONG and MOS contexts. For each object the available 2-D spectra were stacked and then an optimal extraction was carried out.

Tables 2 and 3 give the photometric information and the redshift (when it has been possible to estimate it) for the objects observed in the HDF-S and AXAF deep field, respectively.
| Ident. | z | ||||
|---|---|---|---|---|---|
| EIS 18 | 22:32:30.9 | -60:32:44 | - | 25.18 | 24.92 |
| EIS 23 | 22:32:31.9 | -60:35:16 | - | 25.25 | 24.81 |
| ANON15 | 22:32:34.3 | -60:35:52 | Mstar | 23.52 | 22.68 |
| ANON19 | 22:32:38.0 | -60:37:18 | 0.514 | - | - |
| ANON18 | 22:32:38.7 | -60:37:02 | 0.410 | - | - |
| EIS 33 | 22:32:40.0 | -60:36:21 | - | 24.36 | 24.04 |
| EIS 36 | 22:32:42.2 | -60:34:46 | Mstar | 25.67 | |
| ANON02 | 22:32:45.0 | -60:30:55 | 0.514 | - | - |
| ANON17 | 22:32:45.9 | -60:36:40 | 0.852 | - | - |
| EIS 43 | 22:32:47.0 | -60:31:46 | 3.20 | 24.52 | 24.40 |
| ANON03 | 22:32:48.5 | -60:31:16 | 0.516 | 24.31 | 23.58 |
| EIS 47 | 22:32:49.3 | -60:32:25 | 2.79 | 23.61† | 23.33† |
| ANON01 | 22:32:49.4 | -60:30:41 | 0.776 | - | - |
| EIS 52 | 22:32:53.1 | -60:32:06 | - | 25.10 | 24.49 |
| EIS 54 | 22:32:53.5 | -60:33:12 | - | 25.08 | 24.86 |
| EIS 53 | 22:32:53.5 | -60:35:24 | 3.521 | 24.92 | 24.24 |
| ANON09 | 22:32:53.7 | -60:33:37 | 0.565 | 22.52 | 21.92 |
| EIS 58 | 22:32:54.7 | -60:34:31 | - | 24.61 | 24.22 |
| EIS 60 | 22:32:55.4 | -60:33:55 | Mstar | 26.32 | 25.30 |
| complex morphology: photometry from Lanzetta et al. 1999. | |||||
| Ident. | z | ||||
|---|---|---|---|---|---|
| ANON14 | 03:32:03.5 | -27:47:31 | 1.157 | 24.02 | 24.32 |
| EIS U28 | 03:32:03.6 | -27:43:40 | 3.132 | 24.79 | 24.87 |
| EIS U12 | 03:32:04.4 | -27:46:03 | 3.083 | 24.77 | 24.68 |
| EIS U21 | 03:32:05.0 | -27:44:32 | 3.462 | 23.65 | 23.74 |
| EIS B07 | 03:32:05.1 | -27:46:12 | 3.912 | 25.15 | 24.67 |
| EIS U01 | 03:32:05.8 | -27:48:16 | star? | 23.64 | 22.98 |
| EIS B02 | 03:32:06.6 | -27:47:47 | 3.939 | 25.47 | 24.68 |
| EIS U14 | 03:32:09.1 | -27:45:35 | - | 25.37 | 24.95 |
| EIS B06 | 03:32:09.2 | -27:46:53 | Mstar | 26.39 | 25.02 |
| EIS U19 | 03:32:09.6 | -27:45:14 | - | 25.48 | 25.02 |
| EIS B12 | 03:32:10.1 | -27:44:10 | - | 25.14 | 24.50 |
In Column 1 the EIS identifier refers to Lyman-break candidates in the original EIS lists (for the AXAF field U- and B-dropouts are listed with the “EIS U” and “EIS B” prefix, respectively). Random-chosen objects are listed with the “ANON” prefix followed by the number of the slit in which they were placed. The spectra of 8 galaxies with redshifts between 2.8 and 4.0 are shown in Fig. 1. These and more spectra are available in digital form at the URL http://www.eso.org/science/ut1sv/MOS_DR.html. In some cases (HDF-S: EIS 23, EIS 33, EIS 52; AXAF: EIS U19, EIS B12) it was not possible to determine a redshift due to the lack of significant spectral features rather than to an insufficient S/N of the spectrum. The photometric data of Columns 5 and 6 have been taken from the EIS database in its most recent version (Arnouts, private communication). Five HDF-S ANON targets lie outside the EIS images and no photometry is provided for them.
4 Discussion
At present, the spectroscopy of candidate Lyman-break galaxies has been restricted to an area of 13.5 sq.arcmin in the HDF-S in which imaging is available and 25 sq.arcmin in the AXAF deep field ( sq.arcmin covered in and 3 sq.arcmin in only). After the FORS1 spectroscopic observations, which were based on a preliminary list of Lyman-break candidates produced shortly after the EIS imaging observations, we carried out a more refined selection of galaxies with on the basis of a photometric redshift code (described in Arnouts et al. 1999). In the HDF-S candidates have been found down to a limiting mag of , while in the AXAF deep field candidates have been selected down to . Of the total candidates turned out to have been observed during Commissioning and Science Verification: 8 of them have been confirmed to be at high redshift, 2 resulted in inconclusive spectra.
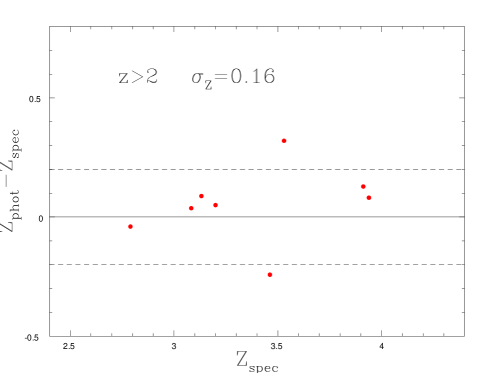
Fig. 2 shows the comparison between photometric and spectroscopic redshifts for the 8 galaxies with observed so far in the HDF-S and AXAF field. The resulting dispersion is . At lower redshift, including some preliminary results in the HDF-S of Dennefeld et al. (2000, in preparation, see http://www.iap.fr/hst/tmrresults.html, the dispersion turns out to be (47 objects).
The properties of the high-z galaxies confirmed with the present observations are summarized in Table LABEL:tab:properties. They have been inferred from the GISSEL models best-fitting the photometric data (Arnouts et al., (1999)) imposing the redshift at the spectroscopic value. The Star formation rate (Column 2) is estimated with the UV continuum flux at 150 nm derived from the best fitting model. For a Salpeter IMF () with constant SFR, a galaxy with SFR yr -1 produces nm erg s-1 Å-1 (Madau et al., (1996)). Column 4 lists the SFR computed with the correction of the intrinsic extinction (reported in Column 3), as obtained form the best-fit procedure. The Calzetti extinction law (Calzetti, (1997)) has been adopted. Column 5 and 6 show the estimated age 111In this paper and are assumed throughout. and stellar mass. As typically found in surveys based on the “Lyman-break” technique, the inferred star formation rates are moderate, ranging from a few to a few tens yr-1. Five out of eight high-z objects do not show prominent emission lines. AXAF EIS-U21 has a spectrum typical of an AGN, showing Ly-, CIV and possibly SiIV in emission with a P-Cyg profile.
| Identifier | SFR | SFR | Age | Mass | |
|---|---|---|---|---|---|
| Uncorr. | Corr. | ||||
| yr | mag | yr | Gyr | ||
| HDF-EIS43 | 8 | 0.0 | 8 | 0.7 | 10.6 |
| HDF-EIS47 | 15 | 0.1 | 38 | 0.1 | 11.2 |
| HDF-EIS53 | 12 | 0.1 | 19 | 0.1 | 10.8 |
| AX-EISU28 | 6 | 0.2 | 13 | 1.4 | 10.9 |
| AX-EISU12 | 6 | 0.0 | 6 | 0.1 | 10.0 |
| AX-EISU21 | AGN | ||||
| AX-EISB07 | 12 | 0.0 | 12 | 1.0 | 10.5 |
| AX-EISB02 | 12 | 0.0 | 12 | 0.7 | 10.5 |
It is interesting to note that two relatively close pairs of galaxies are observed in the AXAF field. EISU28/EISU12 and EISB07/EISB02 are separated of only 8.7 and 3.1 proper Mpc, respectively. Given the small number of objects in the present sample any statistical conclusion is obviously impossible, but it appears natural to link the occurrence of the two pairs to the redshift “spikes” observed by Steidel et al. (1998) at . Future observations of the remaining high-z galaxy candidates and the extension of the surveyed area (see http://www.eso.org/science/eis/) will make it possible to address also this issue on a more quantitative basis.
Acknowledgements.
We warmly thank F. Comeron, R.Gilmozzi, P.Rosati and all the FORS-1/ISAAC SV Team and the EIS Team for making possible the present observations. AAS acknowledges generous financial support form the Royal Society. SA has been supported during this work by a Marie Curie Grant Fellowship. This work has been conducted with partial support by the TMR programme Formation and Evolution of Galaxies set up by the European Community under the contract FMRX-CT96-0086.References
- Arnouts et al., (1999) Arnouts S., Cristiani S., Moscardini L., et al., MNRAS, 310, 540
- Calzetti, (1997) Calzetti D., 1997, AJ 113, 162
- Cristiani, (1999) Cristiani S., 1999, in “Formation and Evolution of Galaxies”, (astro-ph/9908165)
- da Costa et al., (1999) da Costa L., Nonino M., Rengelink R. et al., 1999, A&A in press (astro-ph/9812105)
- Hu et al. (1999) Hu E.M., McMahon R.G., Cowie L.L., 1999, ApJ, 522, L9
- Lanzetta et al., (1999) Lanzetta K.M., Chen H.W., Fernandez-Soto A., et al., 1999, in ”Photometric Redshifts and High Redshift Galaxies”, ed. R. Weymann et al. (astro-ph/9907281)
- Madau et al., (1996) Madau P., Ferguson H.C., Dickinson M.E., et al., 1996, MNRAS 283, 1388
- Nicklas et al., (1997) Nicklas H., Seifert W., Boehnhardt H., Kiesewetter-Koebinger S., Rupprecht G., 1997, SPIE 2871, 1222
- Pettini et al., (1998) Pettini M., Kellogg M., Steidel C.C., et al., 1998 ApJ 508, 539
- Benoist et al., (2000) Benoist C., Rengelink R., Nonino M., et al., 2000, A&A in press (revised version of astro-ph/9812190)
- Steidel & Hamilton, (1992) Steidel C.C., Hamilton D., 1992, AJ, 104, 941
- Steidel et al., (1996) Steidel C.C., Giavalisco M., Dickinson M., Adelberger K., 1996, AJ 112, 352, SGDA96
- Steidel et al., (1998) Steidel C.C., Adelberger K.L., Dickinson M., et al., 1998, ApJ, 492, 428
- Williams et al. (1999) Williams R., et al. 1999, AJ in press and (http://www.stsci.edu/ftp/science/hdfsouth/catalogs.html)