Extremely Red Objects from the NICMOS/HST Parallel Imaging Survey
Abstract
We present a catalog of extremely red objects discovered using the NICMOS/HST parallel imaging database and ground-based optical follow-up observations. Within an area of 16 square arc-minutes, we detect 15 objects with and . We have also obtained K-band photometry for a subset of the 15 EROs. All of the selected EROs imaged at K-band have . Our objects have colors in the range of 1.3 2.1, redder than the cluster ellipticals at and nearly 1 magnitude redder than the average population selected from the F160W images at the same depth. In addition, among only 22 NICMOS pointings, we detected two groups or clusters in two fields, each contains 3 or more EROs, suggesting that extremely red galaxies may be strongly clustered. At bright magnitudes with , the ERO surface density is similar to what has been measured by other surveys. At the limit of our sample, F160W , our measured surface density is 0.94 arcmin-2. Excluding the two possible groups/clusters and the one apparently stellar object, reduces the surface density to 0.38 arcmin-2.
Subject headings:
Galaxies — Elliptical and Starburst galaxies1. Introduction
Deep near-IR imaging surveys have revealed a population of extremely red objects (“EROs”; Elston, Rieke & Rieke 1988; McCarthy, Persson & West 1992; Graham & Dey 1996; Hu & Ridgeway 1994; Soifer et al. 1994; Dey, Spinrad & Dickinson 1995; Thompson et al. 1999). The nature of the extremely red population remains unclear. As it is defined largely by a single color, primarily , there is no certainty that it represents a uniform class of object, and it may contain contributions from galaxies, cool stars or substellar objects and active nuclei. The precise definition of an ERO varies among the different surveys and depends on the particular bandpasses employed. Most samples were defined by or . The present work is based on a somewhat different color system, that defined by the NICMOS F160W bandpass and conventional Kron-Cousins R magnitudes. The NICMOS F160W band is similar to the Johnson H band filter and the color term is negligable for a flat spectral energy distribution (in units) (M. Rieke, 1999, private communication). Among the resolved objects there are reasonable expectations that there should exist stellar systems at redshifts such that the K-correction applied to an old or intermediate age population will produce very red optical to near-IR colors. Alternatively even fairly modest extinction, when observed in the same redshift range, can produce very steep spectral energy distributions in the rest-frame near-UV and there are local examples of such objects among the dusty starburst population. The central issue regarding the nature of the resolved EROs is to understand to what degree these two classes of objects contribute to the overall population.
The earliest interpretation of the colors of EROs were centered around the old stellar population hypothesis (e.g. McCarthy, Persson, & West 1991; Hu & Ridgeway 1994) and redshifts of 1 - 2 were inferred from their multi-band photometry. There are clear examples which support this interpretation, such as weak radio source LBDS 53W091 at (Dunlop et al. 1996) and near-IR selected object CL0939+4713B at z (Soifer et al. 1999), and a concentration of EROs at (Liu et al. 2000). Graham and Dey (1996) argued that the spectral energy distribution of HR10 (Hu & Ridgeway 1994) is well matched by a dusty star-forming galaxy at . The detection of a strong sub-mm continuum from HR10 (Cimatti et al. 1998; Dey et al. 1999) provided conclusive evidence that some of EROs, if not all, are dust enshrouded starburst galaxies with inferred star formation rates of at moderate redshifts (). Recent deep near-IR follow-up observations of the sub-mm sources detected with the SCUBA (Smail et al. 1998) have suggested that two faint sub-mm sources may also be EROs with (Smail et al. 1999). Liu et al. have measured redshifts for several other EROs and most of these are also in the range and some have moderately strong emission lines (Liu et al. 2000).
Two important open issues concern the surface density of EROs and the relative contribution of different classes of objects as a function of both color and apparent magnitude. We continue to lack statistically large samples of EROs. The most recent systematic large survey, covering an area of 154 square arcminutes by Thompson et al. (1999), has yielded six objects with and . To quantify the fraction of different classes of EROs as a function of colors and magnitude, larger samples are required. The ERO surface density inferred from the Thompson et al. survey is 0.04 arcmin-2 for and . Depending on the K-band magnitude limit, color and possibly environment, the reported surface densities of EROs range from arcmin-2, derived from several serendipitous surveys over small areas (Hu & Ridgway 1994; Cowie et al. 1994; Beckwith et al. 1998; Thompson et al. 1999). There have been suggestions that EROs tend to cluster, particularly, in regions around high redshift AGNs compared with blank fields. The large luminosities and (admittedly uncertain) space densities imply that these objects represent a singificant consitutent of the overall galaxy population and that their contribution to the overall rate of star formation is non-negligable (e.g. Liu et al. 2000).
In this paper, we present a sample of EROs discovered using NICMOS on HST while operating in the parallel mode. Our combined NICMOS/optical survey covers only 16 square arcminutes but it provides high spatial resolution and better signal-to-noise in the near-IR than most ground-based surveys.
2. Observations and Reductions
2.1. Near Infrared Images
The images under discussion here were obtained with camera 3 on NICMOS (Thompson et al. 1998) using the F160W (m, m) and F110W band-passes (m, m). The data were obtained in the parallel observing mode during the period from October 1997 to November 1998, excluding the dedicated NICMOS camera 3 observing campaigns. This allowed us to observe fields which are essentially randomly distributed over the sky. The sensitivity varies from field-to-field due to different integration times and background levels. The NICMOS internal pupil adjustment mirror was set near the end of its travel, providing the best possible focus for camera 3. The PSF in the images is slightly non-gaussian, but well characterized by FWHM. We obtained four images per orbit, two each with the F110W and F160W filters. The field offset mirror (FOM) was used to dither between two fixed positions apart in a direction aligned with one axis of the detector. In addition there were small inter-orbit dither moves executed for some of the pointings. The projected size of a camera 3 pixel is , giving a field of view for each image. A small area is lost in the construction of the final mosaic image. The NICMOS camera 3 parallel program covered approximately 200 square arcminutes at high galactic lattitude in its 14 months of operation. In the present work, we are limited by the amount and the depth of the visible-light data that we were able to collect for the NICMOS parallel fields. As described below, most of the NICMOS F160W images easily reach F160W magnitudes fainter than 21 (Vega magnitude) with high signal-to-noise ratios (eg. 20 at H = 21.0). Thus, to detect EROs at these depths requires 3 R magnitude limits of 26 in our follow-up images. As the NICMOS camera 3 field of view is only 0.722 square arcminutes, optical followup is quite inefficient.
We used McLeod’s (1997) NicRed v1.7 package to linearize and remove the cosmic rays from the MultiAccum images. Median images were derived from more than 50 pointings and these were used to remove the dark and sky signals. Even with the optimal dark subtraction, there remain considerable frame-to-frame variations in the quality of the final images. The individual linearized, dark corrected, flatfielded and cosmic ray cleaned images were shifted, masked and combined to produce final mosaic images. Before shifting, each image was block-replicated and integer () offsets were applied. In this way we avoided smoothing or interpolation of the data. The MultiAccum process is not 100% efficient in rejecting cosmic ray events and so we applied a rejection when assembling the final mosaics. More details regarding the NICMOS imaging reduction can be found in Yan et al. (1998).
In Table 1, we list surface brightness limits in the F160W filter for the fields where we have obtained optical data. The 50% completeness depth in the in the shallowest field is approximately m(F160W). Thus our near-IR catalog is 100% complete at the ERO selection limit (F160W as described below). We emphasize that our ERO search is entirely limited by the depth of the optical images.
| Field | RA | DEC | b | T(F160W) | ||
|---|---|---|---|---|---|---|
| (J2000) | (deg) | (sec) | mag/arcsec2 | |||
| 00413302 | 00:41:16 | 33:02:04 | -30 | 2040 | 25.0 | |
| 00505200 | 00:50:12 | 52:00:01 | -65 | 2040 | 25.1 | |
| 00495159 | 00:49:57 | 51:59:57 | -65 | 2040 | 25.1 | |
| 02400140 | 02:40:01 | 01:40:39 | -54 | 2816 | 24.1 | |
| 02400141a | 02:40:07 | 01:41:10 | -54 | 2816 | 23.8 | |
| 02400141b | 02:40:12 | 01:41:27 | -54 | 2816 | 24.6 | |
| 03540943 | 03:54:51 | 09:45:09 | -32 | 1020 | 24.2 | |
| 03540945 | 03:54:51 | 09:45:30 | -32 | 1020 | 24.1 | |
| 04570456 | 04:57:19 | 04:56:51 | -28 | 4480 | 25.7 | |
| 07296915 | 07:29:57 | 69:15:02 | 29 | 5120 | 25.9 | |
| 07416515 | 07:41:44 | 65:15:25 | 30 | 1030 | 24.9 | |
| 15040110 | 15:04:37 | 01:10:31 | 49 | 510 | 23.4 | |
| 16044318 | 16:04:55 | 43:18:56 | 48 | 3840 | 25.6 | |
| 16313001 | 16:31:39 | 30:01:23 | 42 | 3584 | 25.1 | |
| 16313730 | 16:31:40 | 37:30:30 | 43 | 3570 | 25.2 | |
| 16313736 | 16:31:19 | 37:36:53 | 43 | 3570 | 24.9 | |
| 16573526 | 16:57:23 | 35:26:05 | 37 | 18360 | 25.4 | |
| 19406915 | 19:40:57 | 69:15:04 | 30 | 6120 | 23.9 | |
| 20443124 | 21:44:40 | 31:24:55 | 37 | 2040 | 24.9 | |
| 22202442 | 22:20:11 | 24:42:14 | 56 | 5110 | 25.7 | |
| 23252442 | 22:20:12 | 24:42:00 | -56 | 5120 | 25.9 | |
| 23441524 | 23:44:00 | 15:24:50 | -70 | 3840 | 25.4 | |
2.2. Optical Observations
Multicolor CCD observations of several of the NICMOS parallel fields were made at Cerro-Tololo, Las Campanas, WIYN, Palomar and the W. M. Keck observatories. The date of the observations, duration of the R images, the FWHM of the seeing and the 3 limiting surface brightness of the R images are listed in Table 2. The pixel scales range from for the LCO, WIYN, and Keck cameras to for the CTIO BTC camera system. Several of the fields were observed on more than one occasions and from different sites to obtain photometric calibration. The seeing was better than for most of the fields. The data were reduced and calibrated using standard methods. The resulting images were interpolated and rotated to match the NICMOS fields and true color images were constructed from the F160W, F110W, and R images (or F160W, R and V where possible). This allowed for easy and efficient identification of objects with red colors. The photometry was performed on the original uninterpolated images.
| Field | Inst. | Date | FWHM | T(R) | ||
|---|---|---|---|---|---|---|
| arcsec | sec. | mag/arcsec2 | ||||
| 00413302 | WIYN | 11/25/98 | 0.9 | 3600 | 26.9 | |
| 00505200 | LCO | 10/14/98 | 1.1 | 3500 | 26.8 | |
| 02400141 | CTIO | 09/15/98 | 1.2 | 2500 | 26.8 | |
| 03540945 | LCO | 10/12/98 | 0.8 | 4000 | 26.6 | |
| 04570456 | LCO | 03/02/98 | 0.8 | 3000 | 26.2 | |
| 07296915 | WIYN | 11/25/98 | 0.8 | 4800 | 26.9 | |
| 07416515 | WIYN | 01/18/99 | 0.7 | 3600 | 27.1 | |
| 15040110 | WIYN | 05/03/98 | 0.8 | 1800 | 25.8 | |
| 16044318 | Keck | 06/22/98 | 0.6 | 1800 | 26.6 | cirrus |
| 16044318 | WIYN | 05/02/98 | 0.7 | 3000 | 26.5 | |
| 16313001 | Keck | 05/21/99 | 0.7 | 900 | 27.3 | |
| 16313001 | WIYN | 04/27/98 | 0.7 | 3600 | 26.2 | |
| 16313736 | Keck | 05/21/99 | 0.6 | 300 | 26.5 | |
| 16573526 | Keck | 05/21/99 | 0.7 | 600 | 27.0 | |
| 19406915 | CTIO | 09/14/98 | 1.1 | 2500 | 26.8 | |
| 20443124 | LCO | 10/13/98 | 0.9 | 3500 | 26.7 | |
| 22202442 | LCO | 10/12/98 | 0.8 | 5400 | 27.1 | |
| 23252442 | WIYN | 10/24/98 | 0.8 | 1800 | 26.1 | |
| 23441524 | CTIO | 09/13/98 | 1.0 | 4000 | 26.9 |
![[Uncaptioned image]](/html/astro-ph/0004170/assets/x1.png)
3. Results
3.1. ERO Detection and Photometry
All of the ERO identifications were made visually from comparisons between the aligned near-IR and optical images. The small size of each NICMOS image () as well as its sensitive depth made visual selection effecient. All of the EROs are well detected in the near-IR bands and were either undetected or marginally detected in the R-band images. () colors were measured for all of the ERO candidates using the original uninterpolated images. The colors are subject to significant uncertainties due to the low signal levels of the red objects in the R-band images. The mismatch between the point spread functions of NICMOS and ground-based CCD images adds a significant complication to the color measurement. We adopted the following method to estimate the () colors. We smoothed our F160W images to the same FWHM as the corresponding optical images. The F160W and R magnitudes were then measured in identical apertures. The aperture diameter is the measured FWHM in the R-band images. We used the Source Extractor software (Bertin & Arnouts 1996) to measure the magnitudes.
In Table 3 we also list the magnitudes of EROs in a variety of filters. These are isophotal magnitudes measured out to 1 isophotal radius. As our sample of EROs are well detected at F160W, isophotal magnitudes are a good measure of total magnitudes. For the EROs which are undetected in the optical images, their 3 magnitude limits within a 2.5FWHM diameter aperture are used.
| Obj. Name | RAJ2000 | DECJ2000 | RK | RH | K | H | J | I | R | V | B | |
|---|---|---|---|---|---|---|---|---|---|---|---|---|
| 00505200A | 00:50:13.176 | 52:00:12.62 | … | 5.2 | … | 20.6 | 22.4 | 23.8 | 25.9 | 25.6 | … | |
| 02400140A | 02:40:06.780 | 01:41:40.76 | … | 5.1 | … | 19.2 | 20.9 | … | 24.3 | 26.5 | 26.3 | |
| 04570457A | 04:57:20.184 | 04:57:12.46 | 6.6 | 6.0 | 18.17 | 18.8 | 20.5 | 23.2 | 24.8 | 25.0 | ||
| 16313001A | 16:31:39.180 | +30:01:19.60 | … | 5.3 | … | 21.4 | 23.1 | … | 26.9 | … | … | |
| 16313001B | 16:31:38.885 | +30:01:26.33 | … | 5.6 | … | 21.3 | 23.2 | … | 26.9 | … | … | |
| 16313001C | 16:31:39.609 | +30:01:09.42 | … | 5.5 | … | 21.2 | 22.7 | … | 26.9 | … | … | |
| 16313001D | 16:31:38.197 | +30:01:01.51 | … | 6.1 | … | 20.8 | 22.3 | … | 26.9 | … | … | |
| 16313001E | 16:31:40.741 | +30:00:49.19 | … | 6.3 | … | 20.3 | 22.0 | … | 26.9 | … | … | |
| 16313736A | 16:31:19.549 | +37:37:01.08 | … | 5.0 | … | 21.4 | 23.6 | … | 25.0 | … | … | |
| 19406915A | 19:40:55.732 | 69:15:17.82 | … | 5.2 | … | 20.5 | 22.1 | … | 25.7 | 25.1 | 26.0 | |
| 19406915B | 19:40:57.821 | 69:15:07.40 | … | 5.2 | … | 20.6 | 22.6 | … | 25.7 | 25.1 | 26.0 | |
| 23252809A | 23:25:01.830 | +28:09:25.30 | … | 5.3 | … | 20.2 | 22.2 | … | 25.5 | … | … | |
| 23441525A | 23:43:58.504 | 15:25:12.74 | 6.1 | 5.0 | 17.8 | 18.9 | 20.8 | … | 23.9 | 25.6 | 26.2 | |
| 23441525CaaFor these two galaxies their R H colors are slightly less than 5, but since they belong to the same cluster group, we included them for the completeness. These two objects are excluded in the ERO surface density calculation. | 23:43:58.675 | 15:24:56.33 | 5.6 | 4.4 | 18.7 | 19.9 | 21.5 | … | 24.3 | 24.6 | 26.2 | |
| 23441525D | 23:43:59.103 | 15:24:57.42 | 5.8 | 5.0 | 19.5 | 20.5 | 21.8 | … | 25.4 | 25.6 | 26.2 | |
| 23441525FaaFor these two galaxies their R H colors are slightly less than 5, but since they belong to the same cluster group, we included them for the completeness. These two objects are excluded in the ERO surface density calculation. | 23:43:59.254 | 15:25:00.63 | 5.9 | 4.5 | 18.2 | 19.7 | 21.4 | … | 24.1 | 24.2 | 24.9 | |
| 23441525H | 23:44:01.113 | 15:25:10.83 | 6.2 | 5.2 | 19.1 | 20.2 | 21.9 | … | 25.4 | 25.6 | 26.2 |
3.2. Surface Density
In a total of 22 NICMOS fields, covering 16 square arcminutes, we detect 15 objects with . Table 3 lists their equatorial coordinates, near-IR and optical magnitudes, and optical-IR colors. For some fields, we also have K-band images taken with NIRC (Matthews & Soifer, 1994) on the Keck telescope (Teplitz et al. 2000). The ERO sample is selected with without any limits set on H magnitude. Our color selection system is similar to used in ground-based obsevations, and so direct comparisons are possible.
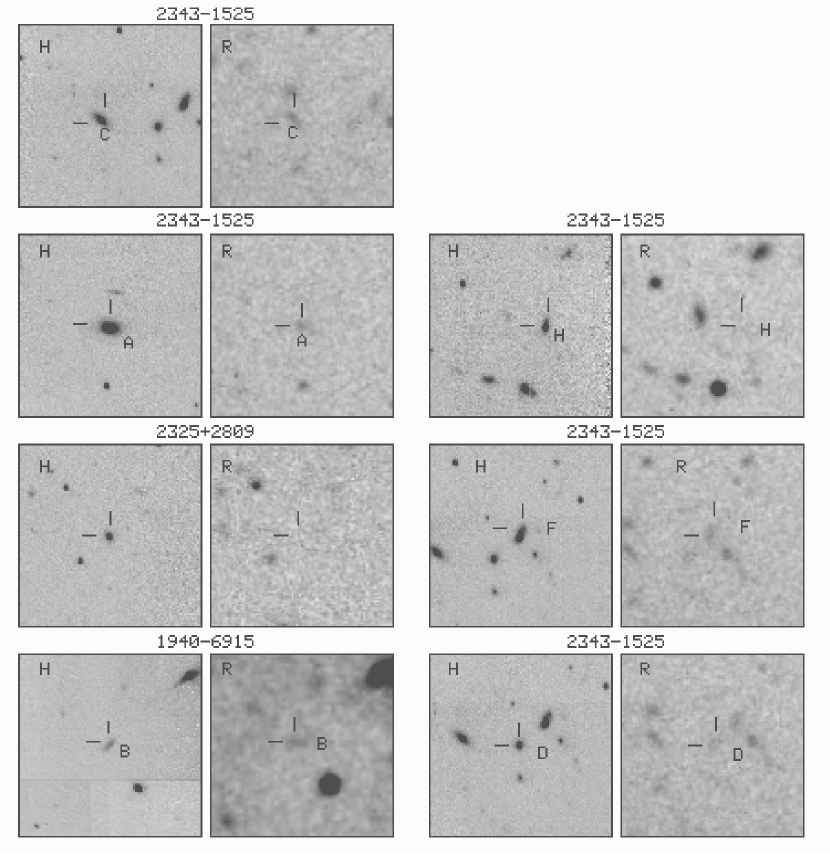
Figure 1 shows the R and F160W band images of each ERO. All of our EROs are resolved in the NIC3 images and appear to be extended, except ERO 1940-6915A. This object has m(F160W) = 20.6. and appears to be unresolved in our NIC3 image. The reamining objects exhibit both elliptical and indeterminate morphologies. The detailed analyses of the ERO luminosity profiles using both the NICMOS camera 2 and camera 3 data will be presented in Yan & McCarthy (2000).
In a few fields where we have very deep optical images taken with LRIS (Oke et al. 1995) at the Keck 10 m telescope, we were able to find EROs with H magnitude as faint as 21.4. The surface density of EROs depend on the magnitude limit of the sample. Including the two apparent clusters of EROs and the point source like object ERO 1940-6915A, we estimate surface densities of 0.19 arcmin.-2, 0.19 arcmin.-2, 0.50 arcmin.-2, and 0.94 for EROs with and , , , and respectively. If we exclude the two ERO clusters and the possible stellar object, the inferred surface density is significantly lower, 0.13 arcmin.-2, 0.13 arcmin.-2, 0.25 arcmin.-2 and 0.38 arcmin.-2 for EROs brighter than 19.5, 20, 20.5 and 21.5 respectively. Here we did not include 23441525C and 23441525F whose R H colors are slightly less than 5. Since our areal coverage is very small, the statistical errors in these estimates are large, particularly at bright magnitudes. If EROs have F160W - K colors of as suggested by our observations, our surface density estimate is consistent within 3 with that inferred from the ground-based ERO survey by Thompson et al. (1999) of 0.04 arcmin.-2 for R K 6 and K 19.
3.3. Infrared Colors
In Figure 2, we present F110W - F160W colors for all of the galaxies detected in 19 NICMOS fields, where we have both F160W and F110W images as well as ground-based optical follow-up observations (see Table 1). The solid dots in the figure represent the EROs listed in Table 3. Overlaying on top of the data are color-magnitude tracks for a passively evolving L⋆ elliptical galaxy formed at in a single burst lasting 1 Gyr and a star-forming galaxy with a constant star formation rate of 1 M⊙/yr respectively. Here we adopt H and q. The open diamonds indicate the places with redshifts of 0.5, 1, 2, and 3. The error bars on F110W - F160W colors and F160W magnitudes are , calculated from Sextractor (Bertin & Arnouts 1996). The F110W F160W colors of our R - F160W selected EROs appear to be redder than the average color of field galaxies (Figure 2). They also appear to be redder than the cluster elliptical population studied by Stanford et al. (1998) (J H ). There are some objects which have red J H colors, but R H colors that do not meet our ERO definition. These objects may contain small amounts of current star formation. If the objects in our ERO sample have luminosities near L∗, the median redshift of our sample is , and the total range sampled is roughly .
Among the 22 NICMOS pointings for which we have deep optical photometry, we found two fields that each contains more than 3 objects meeting our ERO definition. Plate 1 and 2 show the VR F160W composite true color pictures of the ERO groups in 23441524 and 1631+3001. In the 23441524 field, we also obtained K band images and the selected ERO candidates have . The 16313001 field has many red objects, including several very faint objects with , which are not selected in our ERO sample. Plates 1 and 2 clearly indicate two potential groups or clusters of EROs. Follow-up spectroscopy would be important for determining the cluster redshifts and the physical nature of these EROs. Our detections of two clusters of EROs over a small area of sqaure arcminutes suggest that EROs tend to be strongly clustered. Previous studies by McCarthy et al. (1992) and Thompson et al (1999) have also noted the ERO clustering phenomenon from small statistical samples. Obviously, the problem of ERO clustering will be an important goal for future deep infrared surveys covering large area.
4. Acknowledgments
We thank the staff of the Space Telescope Science Institute for their efforts in making this parallel program possible. In particular we thank Duccio Machetto, Peg Stanley, Doug van Orsow, and the staff of the PRESTO division. We also thank John Mackenty and members of the STScI NICMOS group for crafting the exposure sequences. Some of the data presented herein were obtained at the W.M. Keck Observatory, which is operated as a scientific partnership among the California Institute of Technology, the University of California and the National Aeronautics and Space Administration. The Observatory was made possible by the generous financial support of the W.M. Keck Foundation. This research was supported, in part, by grants from the Space Telescope Science Institute, GO-7499.01-96A, AR-07972.01-96A and PO423101. HIT acknowledges funding by the Space Telescope Imaging Spectrograph Instrument Definition Team through the National Optical Astronomy Observatories and by the NASA Goddard Space Flight Center.
References
- (1) Barger, A.J., Cowie, L.L., Sanders, D.B., Fulton, E., Taniguchi, Y., Sato, Y., Kawara, K., Okuda, H., 1998, Nature, 394, 248
- (2) Beckwith, S.V.W., Thompson, D., Mannucci, F., Djorgovski, S.G. 1998, ApJ, 504, 107
- (3) Bertin, E. & Arnouts, S. 1996, A&AS, 117, 393
- (4) Cimatti, A., Andreani, P., Rottgering, H. & Tilanus, R. 1998, Nature, 392, 895
- (5) Cowie, L.L., Gardner, J.P., Hu, E.M., Songaila, A., Hodapp, K.W., & Windhorst, R.J. 1994, ApJ, 434, 114
- (6) Dey, A., Spinrad, H. & Dickinson, M. 1995, ApJ, 440, 515
- (7) Dey, A., Graham, J., Ivison, R.J., Smail, I., Wright, G.S., Liu, M.C. 1999, ApJ, 519, 610
- (8) Dunlop, J., Peacock, J., Spinrad, H., Dey, A., Jimenez, R., Stern, D., & Windhorst, R. 1996, Nature, 381, L13
- (9) Elston, R., Rieke, M.J. & Rieke, G.H. 1988, ApJ, 331, L77
- (10) Graham, J.R. & Dey, A. 1996, ApJ, 471, 720
- (11) Graham, J.R. et al. 1999, in The Hy-Redshift Universe: Galaxy Formation and Evolution at High Redshift, eds. A.J. Bunker & W.J.M. van Breugel
- (12) Hu, E.M. & Ridgeway, S.E. 1994, AJ, 107, 1303
- (13) Liu, M.C., Dey, A., Graham, J.R., Bundy, K.A., Steidel, C.C., Adelberger, K. & Dickinson, M.E. 2000, AJ, June issue, in press
- (14) Matthews, K. & Soifer, B.T., 1994, in Infrared Astronomy with Arrays: the Next Generation, I. McLean ed. (Dordrecht: Kluwer Academic Publishers), p.239
- (15) McCarthy, P.J., Persson, S.E. & West, S.C. 1992, ApJ, 386, 52
- (16) McLeod, B. 1997, in HST Calibration Workshop, ed. S. Casertano et al. p.281
- (17) Oke, J.B., Cohen, J.G., Carr, M., Cromer, J., Dingizian, A., Harris, F.H., Labrecque, S., Lucinio, R., Schall, W., Epps H., and Miller, J. 1995, PASP, 107, 375
- (18) Soifer, T., Matthews, K., Djorgovski, S., Larkin, J., Graham, J.R., Harrison, W., Jernigan, G., Lin, S., Nelson, J., Neugebauer, G., Smith, G., Smith, J.D., & Ziomkowski, C. 1994, ApJ, 420, L1
- (19) Soifer, T.B., Matthews, K., Neugebauer, G., Armus, L., Cohen, J.G., Persson, S.E., Smail, I. 1999, AJ, 118, 2065
- (20) Smail, I., Ivison, R.J., Blain, A.W., Kneib, J.-P. 1998, ApJ, 507, L21
- (21) Smail, I., Ivison, R.J., Kneib, J.-P., Cowie, L.L., Blain, A.W., Owen, F.N., Morrison, G.E. 1999, MNRAS, 308,1061
- (22) Stanford, S.A., Eisenhardt, P.R., & Dickinson, M. et al. 1998, ApJ, 492, 461
- (23) Teplitz,H. et al. 2000, in prep.
- (24) Thompson, D., Beckwith, S.V.W., Fockenbrock, R., Fried, J., Hippelein, H., Huang, J.S., von Kuhlmann, B., Leinert, Ch., Meisenheimer, K., Phleps, S., Roser, H.J., Thommes, E., Wolf, C. 1999, ApJ, 523,100
- (25) Thompson, R.I., Rieke, M., Schneider, G., Hines, D.C., & Corbin, M.R. 1998, ApJ, 492, L95
- (26) Yan, L., McCarthy, P.J., Storrie-Lombardi, L.J., Weymann, R.J., 1998, ApJ, 507, L19
- (27) Yan, L., McCarthy, P.J., 2000, AJ, in preparation
Plate 1. — This is a VR F160W composite color image of 23431524 field. The field shown here has a size of 5050. The color image indicates a cluster of EROs.
Plate 2. — A VR F160W composite color picture of 1631+3001 field shows a cluster of EROs. The field size is the same as in Plate 1.
