TGRS OBSERVATIONS OF POSITRON ANNIHILATION IN CLASSICAL NOVAE
Abstract
The TGRS experiment on board the Wind spacecraft has many advantages as a sky monitor — broad field of view ( centered on the south ecliptic pole), long life (1994–present), and stable low background and continuous coverage due to Wind’s high altitude high eccentricity orbit. The Ge detector has sufficient energy resolution (3–4 keV at 511 keV) to resolve a cosmic positron annihilation line from the strong background annihilation line from -decays induced by cosmic ray impacts on the instrument, if the cosmic line is Doppler-shifted by this amount. Such lines (blueshifted) are predicted from nucleosynthesis in classical novae. We have searched the entire TGRS database for 1995–1997 for this line, with negative results. In principle such a search could yield an unbiased upper limit on the highly-uncertain Galactic nova rate. We carefully examined the times around the known nova events during this period, also with negative results. The upper limit on the nova line flux in a 6-hr interval is typically photon cm-2 s-1 (). We performed the same analysis for times around the outburst of Nova Vel 1999, obtaining a worse limit due to recent degradation of the detector response caused by cosmic ray induced damage.
I INTRODUCTION
Theoretical models of classical novae imply that large quantities of -unstable proton-rich nuclei are formed during a thermonuclear runaway, with half-lives of the order minutes to hours. The resulting positrons undergo annihilation in the expanding nova envelope, giving rise to a pulse of annihilation -rays which is blueshifted and broadened by the nova velocity and lasts for up to hr (2).
All space-borne instruments are subject to a strong background emission line at 511 keV, arising from annihilation of cosmic ray induced -decay positrons in the instrument, which hinders detection of the same line from cosmic sources. However, a spectrometer with sufficient energy resolution could distinguish between cosmic and background lines because the former is blueshifted, typically by 2–5 keV. The Ge spectrometer TGRS (FWHM resolution 3 keV at the beginning of its mission) fulfills this requirement. Its other advantages as a detector and monitor of the nova 511 keV line are its broad aperture (nearly sterad) and its high altitude high inclination orbit, in which background count rates are rather low, due to the lack of interaction with Earth’s trapped radiation belts, and to the virtual absence of Earth albedo background radiation. The background count rate and spectrum has also been extremely stable throughout the mission.
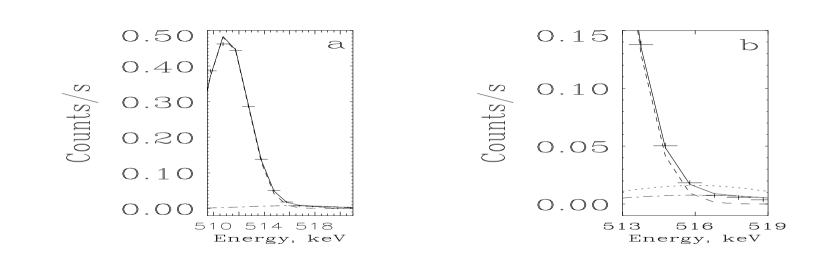
A disadvantage of Ge detectors for long-term missions is progressive degradation of performance due to cosmic-ray impact damage. For this reason most of the data used here were obtained during 1995–1997, before this effect became serious. In an attempt to avoid the effects of degradation, such as low-energy ”tailing”, we fitted only energies on the high-energy (blue) side of the background 511 keV line. One such fitted background spectrum is shown in Fig. 1. The dashed line is the strong background 511 keV line. The dot-dashed line is the fit to a theoretical nova line emitted in a 6-hr interval after the event (3). Although the amplitude of this line is significant, we will see shortly that it is characteristic of all our background spectra — in other words, there is a systematic constant positive offset in this measurement. For scale, the dotted line shows how the same line would appear from a model nova at a distance 1 kpc. This line would be detected at a level .
II SURVEY OF THE SOUTHERN SKY, 1995–1997
The global rate of classical novae in the Galaxy is highly uncertain, since the two methods used to derive it both suffer from serious systematic problems. One involves correcting the rate of actual discoveries ( yr-1) for highly uneven sky coverage and interstellar extinction for poorly-known nova distances. The other involves correcting the nova rates measured in external galaxies (according to some parameter such as ), which runs into the problem of differences in the stellar populations between galaxies.
The method used here is potentially superior, being free from these biases. The 511 keV -rays are not subject to interstellar extinction, and TGRS’s sky coverage was almost uniform during the period 1995–1997. Between 1995 January and 1997 October TGRS accumulated about s of background spectra (88% overall). Nor are much data lost due to changing sensitivity across the aperture, which amounts to a factor 25% between the zenith and the ecliptic plane.
This entire period was divided into 6 hr intervals during which background spectra were accumulated, which were fitted to models of the type shown in Fig. 1. The parameters of the nova line in these fits were fixed at values predicted by theory at epochs hr and hr after the explosion (widths 8 keV FWHM, blueshifts 5 and 2 keV, from ref. 2 and Hernanz 1997, private communication). The fits to the count spectra were normalized by the effective area for the zenith angle of an average nova, which is . The fitted amplitudes for the 6-hr and 12-hr lines were combined in order to maximize the signal.

The fitted nova line amplitudes in the 4005 resulting background spectra are shown in Fig. 2. Since the positive systematic amplitude is constant to a very good approximation, we are justified in subtracting it from all measurements. We then see that there is no single 6-hr interval which, after this subtraction, yields a convincing nova signal. We chose a level as the threshold for detection of a candidate signal (Fig. 2, dashed line), which is appropriate for the expected number of chance detections in 4005 events. From Poisson statistics, our measured nova rate is therefore at the 63% level. The sensitivity of this survey at the level is about photon cm-2 s-1 (4).
If a given nova model predicts a 511 keV line flux at 1 kpc then this survey could have detected it out to a distance kpc. Unfortunately the most recent self-consistent hydrodynamic models (5) predict much smaller fluxes ( photon cm-2 s-1 at 1 kpc) than earlier versions (2), although parametrized models (6) can predict values values as high as photon cm-2 s-1. Thus in the most optimistic case kpc, for an ONeMg nova of model type HH5 (6). Using the Bahcall-Soneira Galactic mass model (1) we can extrapolate our limit event per s within 1.4 kpc (which includes 0.8% of the Galaxy) to a Galactic rate events yr-1 of this type.
III NOVA VELORUM 1999
Five novae occurred within TGRS’s aperture during the period 1995–1997, before the instrument performance began to deteriorate. Searches for 511 keV line emission around the times of these outbursts were unsuccessful (3), the sensitivities achieved being similar to the values given above for the overall survey. Unfortunately a very bright nova V382 Vel ( N Vel 1999) was discovered in 1999 May, by which time the deterioration of the detector performance had advanced.
Three main effects contribute to this deterioration (7): a distortion of the response to a narrow line (starting with low-energy tailing, culminating in the formation of a separate low-energy peak); a poorly-quantified loss of efficiency; and an accelerated rate of change of the instrument gain. In order to apply our search method to Nova Vel we attempted approximate solutions to these problems. In the count spectrum fitting, the Gaussian line models (Fig. 1) were replaced by more complex shapes reflecting the current detector response (evaluated from the response to the 511 keV and other background lines). Fortunately, during the rather narrow time interval (15–23 May) which we fitted the response did not change significantly, nor did the gain. We estimated the detector effective area by assuming constancy of the true TGRS background line strengths, which we had found to be a very good approximation during the period of stability 1995–1997; a measurement of the 511 keV line intensity, compared with the average from 1995–1997, then enabled an efficiency correction to be made.
The preliminary results are shown in Fig. 3. Note that, compared to Fig. 2, both the error bars and the systematic positive offset are much worse. The rise to visual maximum probably started at least 1 d before discovery (arrow), and the explosion may have occurred up to 3 d before that. Our fitted background nova line amplitude should show a single 6-hr peak at that epoch, over and above the average background level (solid line). No such event was observed, so that we can only place upper limits on the line flux and a lower limit on the distance to V382 Vel. The average upper limit above the solid line is photon cm-2 s-1; however, the constant positive offset level is much less well-defined than it was earlier in the mission (Fig. 2), so that a systematic error estimate for this must be introduced. We also estimated the systematic error due to the uncertainty in the nova line position arising from the broad and irregular shape of the background 511 keV line relative to which it is measured. We thus obtained an upper limit on the line flux of order photon cm-2 s-1. V382 Vel is believed to have occurred on an ONeMg white dwarf (8), in which case we can combine our flux limit with the best-case theoretical flux at 1 kpc of photon cm-2 s-1 (6) to obtain a lower limit of 0.66 kpc on the distance.

References
- (1) (1) Bahcall, J. N., & Soneira, R. M. 1984, ApJS, 55, 67
- (2) (2) Gómez-Gomar, J., Hernanz, M., José, J. & Isern, J. 1998, MNRAS, 296, 913
- (3) (3) Harris, M. J., et al., 1999, ApJ, 522, 424
- (4) (4) Harris, M. J., et al., 1999, submitted to ApJ
- (5) (5) Hernanz, M., José, J., Coc, A., Gómez-Gomar, J., & Isern, J. 1999, ApJ in press
- (6) (6) Kudryashov, A. D., Chugai, N. N., & Tutukov, A. V. 1999, LANL preprint astro-ph/9812100 and these Proceedings
- (7) (7) Kurczynski, P., et al. 1999, Nucl. Instr. Methods A, 431, 141
- (8) (8) Shore, S. N., Starrfield, S., Gehrz, R. D., & Woodward, C. E. 1999, IAUC 7192
- (9)