email: hspoon@eso.org, amoor@eso.org 22institutetext: Kapteyn Astronomical Institute, Postbus 800, NL-9700 AV Groningen, The Netherlands
email: j.koornneef@astro.rug.nl, tielens@astro.rug.nl 33institutetext: Max-Planck-Institut für extraterrestrische Physik (MPE), Postfach 1603, D-85740 Garching, Germany
email: lutz@mpe.mpg.de
Mid-infrared ISO spectroscopy of NGC 4945 ††thanks: Based on observations with ISO, an ESA project with instruments funded by ESA Member States (especially the PI countries: France, Germany, the Netherlands and the United Kingdom) and with the participation of ISAS and NASA
Abstract
We have observed the central region of the nearby starburst galaxy NGC 4945 with the mid-infrared spectrometers SWS and PHT-S aboard ISO. We do not find any evidence for the existence of the powerful AGN, inferred from hard X-ray observations. The upper limits on our AGN tracers 14.32m&24.3m and 7.65m imply an A160 towards the NLR, assuming the NLR to be of equal strength as in the Circinus galaxy. Other possibilities are discussed. The starburst excitation indicators 15.56m/12.81m and Lbol/Llyc suggest that the starburst in the central region is at least 5106 yrs old, and that it accounts for at least half of the nuclear bolometric luminosity. The starburst might well power the entire bolometric luminosity, but the available constraints are also consistent with an up to 50% contribution of the embedded AGN. With PHT-S, at a resolution of 90, we detect strong absorption features of water ice, and, for the first time in an external galaxy, of CO2 and CO. The same PHT-S spectrum also reveals strong emission from the family of PAH features. Finally, we have observed and detected several pure rotational and ro-vibrational H2 lines, two of which, the (0-0) S(0) & S(1) lines, allow us to determine the excitation temperature (160K) and warm H2 mass (2.4107M⊙). The low excitation temperature shows Orion-like shocks not to be representative for the entire emission of the central region of the galaxy and fairly normal PDRs to be perhaps more typical.
Key Words.:
Galaxies: individual: NGC4945 — Galaxies: ISM — Galaxies: starburst — Galaxies: Seyfert1 Introduction
NGC 4945 is a nearby, large (204) spiral galaxy seen nearly edge on (i 78; Ott Ott (1995)). At a recession velocity of 560km/s it is at the mean radial velocity of the Centaurus group (Hesser et al. Hesser (1984)), of which it is believed to be a member. Distance estimates vary between 3.5 and 4.0Mpc (see Bergman et al. Bergman (1992) and Mauersberger et al. Mauersberger (1996) for discussions). In this paper we will adopt a distance of 3.9 Mpc (Bergman et al. Bergman (1992)), which implies that 1 is equivalent to 18pc.
NGC 4945 is one of the brightest infrared galaxies in the sky: S[12]=24Jy, S[25]=43Jy, S[60]=588Jy, S[100]=1416Jy (Rice et al. Rice (1988)). The total infrared luminosity amounts to L(8-1000m)=2.951010 L☉, 75% of which originates in the central 129 (Brock et al. Brock (1988)).
Near infrared observations reveal the nuclear region to be the site of a powerful, yet visually obscured, starburst. Br (Moorwood et al. 1996a ) and Pa (Marconi et al. Marconi (2000)) recombination line maps show the starburst to be concentrated in a circumnuclear disk or ring 200pc across (11). Further evidence for (a period of) strong star formation comes from the discovery of a conical structure, roughly perpendicular to the galaxy major axis. It is believed to be a cavity, vacated by a starburst-driven superwind (Heckman et al. Heckman (1990); Moorwood et al. 1996a ). The non-detection of O iii within the cone and the absence of coronal lines excludes an AGN as the driver of the outflow.
Clear evidence for the presence of an AGN comes from hard X-ray observations (Iwasawa et al. Iwasawa (1993); Guainazzi et al. Guainazzi (2000)). The AGN X-ray emission is however heavily absorbed by a column density of 1024.7cm-2, which obscures the AGN at all optical and infrared wavelengths. Previous authors have attributed most of the IR luminosity to the starburst (e.g. Moorwood & Oliva Moorwood94 (1994); Koornneef & Israel Koornneef96 (1996)). Hard X-ray observations with BeppoSAX indicate that the bolometric luminosity may as well be accounted for by the AGN alone (Guainazzi et al. Guainazzi (2000)).
3cm&6cm ATCA radio maps of the central region of NGC 4945 (Forbes & Norris Forbes (1998)) are dominated by strong nuclear emission, and emission extended along the disc of the galaxy. There is also evidence for some filamentry structure associated with the cavity cleared by the starburst superwind. VLBI observations by Sadler et al. (Sadler (1995)) reveal the existence of a compact radio core. This, as well as the presence of H2O megamasers in a Keplerian disc about a 106 M⊙ black hole (Greenhill et al. Greenhill (1997)), are taken as further evidence for the presence of an AGN.
Near infrared observations of molecular hydrogen emission in NGC 4945 have been reported by several authors over the last 15 years (e.g. Moorwood & Glass Moorwood84 (1984); Moorwood & Oliva Moorwood88 (1988); Koornneef Koornneef93 (1993); Moorwood & Oliva Moorwood94 (1994); Koornneef & Israel Koornneef96 (1996); Moorwood et al. 1996a ; Quillen et al. Quillen (1999); Marconi et al. Marconi (2000)). While fluxes are known for eight ro-vibrational transitions accesible from the ground (Koornneef & Israel Koornneef96 (1996)), spatial information is available only for the (1-0) S(1) 2.1218m line. These observations show the H2 emission to be associated with the hollow cone, not with the starburst traced in hydrogen recombination emission. The absence of a correlation argues against photons as the source of excitation. Instead, the emission is attributed to shock heating of the molecular material at the face of the cavity (Moorwood et al. 1996a ; Marconi et al. Marconi (2000)).
Mid-infrared spectroscopy is much less affected by intervening extinction than the UV and optical equivalents, with A()/AV less than 0.1. Observations of the central region of the galaxy, using the mid-infrared spectrometer SWS (De Graauw et al. deGraauw (1996)) and the spectrophotometer PHT-S (Lemke et al. Lemke (1996)), both aboard ISO (Kessler et al. Kessler (1996)), are therefore very useful to study the nuclear components otherwise hidden by heavy extinction. In Sect. 3.1 we present the results of the search for high excitation emission from the AGN. In Sect. 3.2 we study the properties of the nuclear starburst. In Sect. 3.3 we discuss the dominant nuclear power source. Sect. 3.4 discusses the broad emission and absorption features, tracing the properties of the interstellar medium in and in front of the nucleus. Finally, in Sect. 3.5 we discuss the physical conditions and excitation of the warm molecular hydrogen.
2 Observations
As part of the Central Program “MPEXGAL”, we have observed the central region of NGC 4945 with the Short Wavelength Spectrometer (SWS) and the spectrophotometer PHT-S on board ISO.
2.1 SWS spectroscopy
SWS grating line profile scans (SWS02 mode) were obtained on 1996 February 6 for 28 spectral lines in the range of 2.42 to 40.34m. The spectral resolution in this range varies between R=900 and 2000, corresponding to a velocity resolution of 330–150 km/s. Aperture sizes used range between 1420 and 2033. SWS was centered on the 1.4GHz continuum peak from Ables et al. (Ables (1987)), which coincides with the the position of the L-band peak of Moorwood et al. (1996a ). At the time of observation the position angle of the major axis of the SWS apertures was 35.4, 10 off from that of the galaxy major axis (45).
The data reduction was performed using the SWS Interactive Analysis system (SIA; Lahuis et al. Lahuis (1998); Wieprecht et al. Wieprecht (1998)), putting special emphasis on tools to improve cosmic ray spike removal, dark current subtraction and flat fielding. The wavelength calibration of SWS is discussed by Valentijn et al. (1996a ). We used calibration files as of March 1999. The accuracy of the flux calibration is estimated to be 30% (Schaeidt et al. Schaeidt (1996)). The resulting spectra are shown in Fig 1.
In total 17 spectral lines were detected. For another 11 lines we derived upper limits, using gaussian profiles of width equal to other lines of the same (or comparable) species, scaled to a peak height corresponding to approximately 3 of the noise. Both detections and upper limits are presented in Table 1.
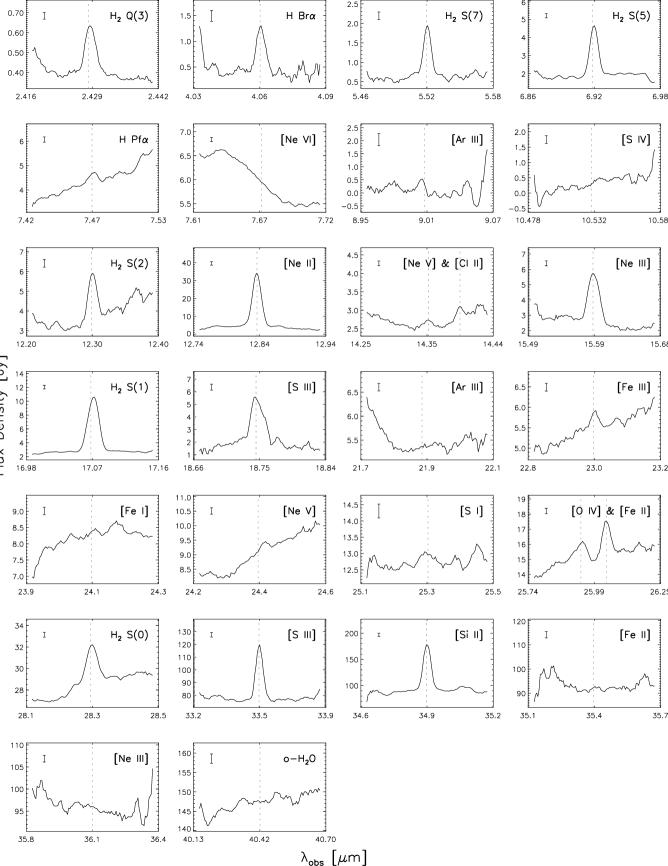
| Identification | Fobs | Aperture | |
|---|---|---|---|
| m | W/cm | ||
| H2 (1-0) Q(3) | 2.424 | 3.20 10-20 | 1420 |
| Br | 4.052 | 7.79 10-20 | 1420 |
| H2 (0-0) S(7) | 5.510 | 1.11 10-19 | 1420 |
| H2 (0-0) S(5) | 6.909 | 1.54 10-19 | 1420 |
| Pf | 7.460 | 1.95 10-20 | 1420 |
| 7.652 | 7.3 10-21 | 1420 | |
| 8.991 | 2.3 10-20 | 1420 | |
| 10.511 | 8.8 10-21 | 1420 | |
| H2 (0-0) S(2) | 12.279 | 7.45 10-20 | 1427 |
| 12.814 | 8.68 10-19 | 1427 | |
| 14.322 | 7.0 10-21 | 1427 | |
| 14.368 | 5.19 10-21 | 1427 | |
| 15.555 | 7.51 10-20 | 1427 | |
| H2 (0-0) S(1) | 17.035 | 1.51 10-19 | 1427 |
| 18.713 | 6.88 10-20 | 1427 | |
| 21.829 | 5.1 10-21 | 1427 | |
| 22.925 | 6.46 10-21 | 1427 | |
| 24.042 | 5.4 10-21 | 1427 | |
| 24.318 | 5.5 10-21 | 1427 | |
| 25.257 | 1.4 10-20 | 1427 | |
| 25.890 | 3.00 10-20 | 1427 | |
| 25.988 | 4.11 10-20 | 1427 | |
| H2 (0-0) S(0) | 28.221 | 4.82 10-20 | 2027 |
| 33.481 | 4.87 10-19 | 2033 | |
| 34.815 | 9.66 10-19 | 2033 | |
| 35.349 | 2.8 10-20 | 2033 | |
| 36.014 | 1.6 10-20 | 2033 | |
| o-H2O | 40.341 | 2.8 10-20 | 2033 |
2.2 PHT-S spectrophotometry
We have obtained two low resolution (/90) ISO-PHT-S spectra, on 1996 October 12 and 1997 August 3, respectively. ISO-PHT-S comprises two low-resolution grating spectrometers covering simultaneously the wavelength range 2.47 to 4.87m and 5.84 to 11.62m. The spectrum is registered by two linear arrays of 64 Si:Ga detectors with a common entrance aperture of 24 24. The measurements were carried out in rectangular chopped mode, using a chopper throw of 180. The resulting spectra thus are free of contributions from zodiacal light, that would otherwise affect the spectrum. The pure on-source integration times were 512 and 1024 s.
The ISO-PHT-S data were reduced using PIA111PIA is a joint development by the ESA Astrophysics Division and the ISO-PHT Consortium (Gabriel et al. Gabriel (1997)) version 8.1. Steps in the data reduction included: 1) deglitching on ramp level. 2) subdivision of ramps in two sections of 32 non destructive read-outs. 3) ramp fitting to derive signals. 4) masking of bad signals by eye-inspection. 5) kappa sigma and min/max clipping on remaining signal distribution. 6) determination of average signal per chopper plateau. 7) masking or correction of bad plateaux by eye-inspection. 8) background subtraction using all but the first four plateaux. 9) finally, flux calibration, using the signal dependent spectral response function of Acosta-Pulido (Acosta99 (1999)). This spectral response function avoids some deficiencies of the previous PIA response function, in particular in the 3m region near the “Ice” feature. The absolute calibration is accurate to within 20%.
The two resulting spectra were obtained at slightly different position angles about the nucleus. For the first, the square aperture was aligned with the galaxy major axis (45). For the second, the position angle was 31.1. Fig. 2 shows the averaged ISO-PHT-S spectrum. The on-source integration times were used as weight factors in the computation of the average spectrum.
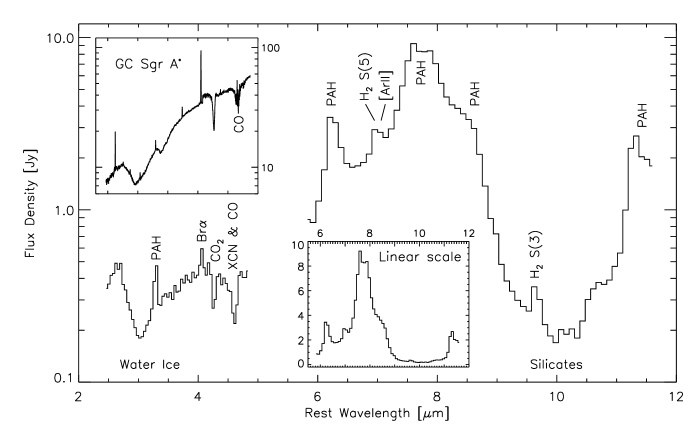
A number of emission lines can be identified in the ISO-PHT-S spectrum. These include 9.66m H2 (0-0) S(3), the unresolved blend of 6.99m Ar ii and 6.91m H2 (0-0) S(5), and 4.05m H Br. For the 9.66m H2 (0-0) S(3) line, not included in the SWS02 line scans, we measure a flux of 5.410-20 W/cm2, with an uncertainty of 30%.
3 Results
3.1 AGN not seen at mid-infrared wavelengths
NGC 4945 is a peculiar and interesting target for studying the relation of AGN and star formation in galaxies. Clear evidence for hidden AGN activity comes from hard X-ray observations. NGC 4945 is amongst the brighest hard X-ray emitting galaxies and exhibits variability of its 13–200keV flux on timescales of 10hrs, which clearly establishes its AGN origin (Iwasawa et al. Iwasawa (1993); Guainazzi et al. Guainazzi (2000); Marconi et al. Marconi (2000)). The AGN X-ray emission is heavily absorbed by a column density of 1024.7 cm-2 (corresponding to AV2600), a high value, but within the range observed for Seyfert 2 galaxies (e.g. Risaliti et al. Risaliti (1999)). In unified schemes, the X-ray obscuration measures a line of sight towards the very center. Obscuration towards the NLR probes a different line of sight and is usually significantly lower, making the NLR visible in Seyfert 2 galaxies.
Mid-infrared high excitation lines are able to penetrate a far larger dust obscuration than their optical and UV counterparts. They are therefore ideally suited as tracers of embedded AGN activity. Mid-infrared emission lines like 14.32m & 24.32m, 7.65m and 25.9m are prominently present in the spectrum of all Seyferts observed with ISO (Moorwood et al. 1996b ; Genzel et al. Genzel (1998)). On the other hand, the same emission lines are also weakly visible towards, for instance, supernova remnant RCW 103 (Oliva et al. Oliva (1999)). emission (at the few percent level compared to ) has also been detected in a sample of starburst galaxies (Lutz et al. Lutz98 (1998)), again at a level much weaker than seen in typical AGNs. The origin of the weak level emission in these sources is believed to be shocks. A detection of any of the high excitation lines discussed above does therefore not automatically imply the detection of an AGN in NGC 4945.
We do not detect the lines of and . No trace of is seen in the wing of the nearby PAH emission feature (Fig. 1). From Fig. 1 it might appear that the two lines were indeed detected. However, at the level at which the features appear, instrumental effects play a significant role. In the 14.35m line scan a strong fringe in the relative spectral response function coincides exactly with the expected position for the line. Depending on the size of the emitting area, the feature may be entirely attributed to this instrumental effect. We therefore chose to state an upper limit for the 14.32m line. The feature seen in the other scan, centered at 24.4m, was registered by only two detectors, although 12 detectors scanned over the central wavelength. As visible in Fig. 1, the feature is redshifted with respect to the NGC 4945 systemic velocity. This shift is not observed for any other line we observed. We therefore derive an upper limit for this line too.
The only detected high ionization line in NGC 4945 is the 25.9m line. An AGN contribution to this line is possible — to match the limits on higher excitation lines, only part of the emission would be related to an AGN. The detection of possibly shock-related in many starbursts (Lutz et al. Lutz98 (1998)) cautions, however, that this may be a more plausible origin of in NGC 4945. The ratio of 0.033 with respect to +0.44 is above average, but well within the range observed for the Lutz et al. (Lutz98 (1998)) starbursts, also considering that the high extinction (Sect. 3.2) will increase the observed ratio relative to the intrinsic one. A population of Wolf-Rayet stars as origin of the emission seems unlikely. Lutz et al. (Lutz98 (1998)) have shown that the emission would have to originate in widely dispersed small H ii regions and would have to be relatively strong. emission at this level has not been observed in local star forming regions. A conservative analysis will hence not attribute the emission in NGC 4945 to the AGN nor to a population of Wolf-Rayet stars.
| NGC 4945 | Circinus | |
| Distance Mpc | 3.9 | 4a |
| H col. dens. to AGN cm-2 | 51024 | 41024b |
| AV to AGN | 2600 | 2100 |
| L(2–10keV) L⊙ | 78107c | 8.8–44107b |
| Lν(100keV)/LFIR | 0.003d | 0.002d |
| L(8–1000m) L⊙ | 2.21010 | 1.21010a |
| 14.3m W/cm2 | 7.010-21 | 44010-21e |
| 24.3m W/cm2 | 5.510-21 | 24410-21e |
| 7.65m W/cm2 | 7.310-21 | 41310-21e |
The limits on high excitation AGN tracers are consistent with several scenarios, or perhaps more likely a combination of them:
-
•
The Narrow Line Region is extremely obscured even in the mid-IR. We derive an A160 (A(7.65m)=A(14.3m)=A(24.3m)4.3) to the NLR from a comparison of Circinus and NGC 4945 and line strengths, under the assumption that the galaxies’ NLRs are similar. The choice for Circinus is motivated in Table 2.
-
•
UV photons from the AGN are absorbed close to the nucleus along all lines of sight
-
•
The extreme ultraviolet luminosity of the AGN is lower than in Circinus. In comparison to the Circinus SED, this would imply a large deficiency in UV relative to X-ray flux (Table 2).
3.2 Starburst properties
Near-infrared broad-band and emission-line imaging has revealed the nucleus of NGC 4945 to be the site of a sizeable starburst, the presence of which is illustrated by the conically shaped starburst superwind-blown cavity traced at many near-infrared wavelengths (Moorwood et al. 1996a ; Marconi et al. Marconi (2000)). Hampered by the large extinction even in the near-infrared, age estimates for the nuclear starburst are sparse and intrinsically uncertain. ISO-SWS offers the possibility for the first time to observe the mid-infrared line ratio 15.56m/ 12.81m. This ratio, which is much less affected by extinction than visible and UV lines, is sensitive to the hardness of the stellar radiation field and hence is a good indicator for the age of the nuclear starburst. We observed the two lines in the same ISO-SWS aperture, which was centered on the nucleus (see Table 1).
To estimate the extinction to the NGC 4945 nuclear starburst we use the ratio of the 18.71m and 33.48m S iii lines. This ratio is commonly used as a density diagnostic for the density range 102.5–104.5 cm-3 and is only mildly dependent on the temperature of the emitting gas. Assuming a typical starburst gas density of 300 cm-3 (Kunze et al. Kunze (1996); Rigopoulou et al. Rigopoulou96 (1996)), the intrinsic ratio should be 0.43 (i.e. the value in the low density limit, computed using the collision strengths of Tayal & Gupta Tayal (1999)). The observed ratio is far lower: 0.140.06. We hence deduce a screen extinction of A(18.7m)=1.7, which, using the Galactic center extinction law of Draine (Draine (1989); with A(9.7m)/E(J–K)=0.71), amounts to AV=36. This value is to be considered an upper limit in case the S iii emitting area is larger than 1427, in which case an aperture effect causes the S iii ratio to be a lower limit.
Another independent estimate of the extinction is usually obtained from hydrogen recombination line strengths, assuming ‘case-B’ conditions. For NGC 4945 we therefore observed the 4.05m Br and the 7.46m Pf line. Both were measured in the same aperture. The ratio Pf/Br is 0.250.10, whereas ‘case-B’ recombination theory predicts a ratio of 0.32. The extinction at 7.46m must therefore be similar or slightly larger than at 4.05m. This indicates that the grain composition is unusual and probably more similar to the composition found in the line of sight towards the Galactic center (Lutz et al. Lutz96 (1996); Lutz Lutz99 (1999)) than found towards other parts of our Galaxy. An extinction towards the NGC 4945 nuclear starburst can therefore at present not be derived from lines in the 4–7m range.
The extinction derived for the nuclear starburst is somewhat larger than the value we derive for the warm molecular hydrogen (see Sect. 3.5). This indicates that the warm molecular hydrogen and nuclear starburst emission are coming from different nuclear components, the latter possibly more enshrouded than the former. With the unusual grain composition in mind, it is striking how well the Galactic Center extinction law fits our molecular hydrogen data, resulting in a smooth excitation diagram, even for the H2 (0-0) S(3) line in the center of the 9.7m silicate feature (see Sect. 3.5). We are therefore confident that the extinction correction for the starburst, derived using the S iii ratio, is also useful.
In order to determine the excitation of the nuclear starburst we apply the extinction correction derived from the ratio to the observed / ratio. The extinction corrections amount to A(12.8m)=1.51 and A(15.6m)=1.19. The extinction corrected / ratio is 0.064. Thornley et al. (Thornley (2000)) list observed / ratios for 26 starburst galaxies, all measured in the same ISO-SWS configuration. Clearly, NGC 4945 is among the lowest excitation targets in their sample. Note that the ISO-SWS aperture used is large compared to the typical size scales in starbursts. The ratios listed by Thornley et al. (Thornley (2000)) should therefore be regarded as aperture averaged.
For starburst galaxies Lbol/Llyc is another measure of the excitation of star clusters. Depending on the upper mass cut-off, the star formation decay time scale and the age of the clusters, Thornley et al. (Thornley (2000)) modeled Lbol/Llyc to lie between 3 and 200. The measured values for starburst galaxies range between 3 and 50. Below we will determine Lbol/Llyc for the NGC 4945 nuclear starburst. We assume Lbol=LIR (i.e. no AGN contribution to LIR) and estimate Llyc from the dereddened 4.05m Br flux. For A(4.05m)=1.2 (applying the Galactic center law of Draine (Draine (1989)) for AV=36) and Llyc=670 LBrα we find Llyc=8108L⊙ and Lbol/Llyc=28. Using the 12.81m line and the empirical scaling Llyc=64 L (Genzel et al. Genzel (1998)) a similar result is obtained.
Given the variety of possible star forming histories, it is hard to constrain the age of the nuclear starburst (assuming no AGN contribution to LIR). However, both excitation diagnostics agree on a low excitation which suggests an evolved burst with an age in excess of 5106 years, but would also be consistent with a low IMF upper mass cut-off.
Marconi et al. (Marconi (2000)) show that it is possible to construct starburst models which are consistent with their near-infrared observations of NGC 4945, but differ by the total luminosity generated (their Fig. 4). An instantaneous burst would not leave space in the energy budget for a sizable contribution from the hidden AGN, whereas a combination of instantaneous burst and constant star formation would. We would like to point out here that the latter model would be inconsistent with the low / ratio observed by us. Only their instantaneous burst is in agreement with both the near-infrared and mid-infrared observations.
3.3 What powers the nucleus of NGC 4945?
The large extinction towards the nuclear starburst and the AGN buried within,
makes it very difficult to assess the contributions of either component to the
nuclear bolometric luminosity.
The optical, near-infrared, mid-infrared and far-infrared spectra of NGC 4945
are entirely consistent with a starburst-like nature: BLR or NLR
high-excitation lines are absent; the starburst excitation indicator
/ has a starburst-like value; the ratios
of 6m (ISO-PHT-S), S12 or S25 to S60 or S100 fluxes are all very low
and consistent with emission from cold dust only. Furthermore, the ratio
Lbol/Llyc=28, is perfectly consistent with the
low excitation of the starburst as deduced from
/. And last, NGC 4945 lies on the
radio-far-infrared correlation for starburst galaxies (Forbes & Norris
Forbes (1998)). Hence, the starburst might well account for the the
entire observed bolometric luminosity.
On the other hand, Guainazzi et al. (Guainazzi (2000)), who have
observed the AGN in NGC 4945 in hard X-rays, compute the AGN to be able
to account for all the bolometric luminosity observed, if it has
a typical quasar LX/Lbol ratio. Since there is no
such thing as a template AGN spectrum, the conversion factor applied,
L1-10keV/L0.05 (Elvis et al. Elvis (1994)), may have
an uncertainty which could easily allow for the NGC 4945 starburst to
dominate the bolometric luminosity instead.
The same uncertanties surround the accretion rate of the
1.6106M⊙ black hole inferred from H2O
maser observations (Greenhill et al. Greenhill (1997)). A high but not
implausible rate of 50% of the Eddington rate
(LEdd4.11010 L⊙)
would suffice to power the observed bolometric luminosity. Given the
wide range of efficiencies inferred for Seyferts, this information does
not add anything to identify the dominant power source.
In this complex situation with two potentially dominant power sources, the most significant constraint on their relative weight is the total Lbol/Llyc ratio and its implications on the Lbol/Llyc of the starburst component. L is directly constrained by observations, but L changes for different assumptions on the starburst and AGN contributions to the total bolometric luminosity. If there is a significant AGN contribution, (Lbol/Llyc)sb will be less than the global value of 28. Values as low as 3 which are possible for a zero age massive star population with Salpeter IMF (e.g. Leitherer & Heckman Leitherer (1995)) are strongly inconsistent with the low excitation observed in NGC 4945. Thornley et al. (Thornley (2000)) model Ne iii/Ne ii and Lbol/Llyc ratios of starbursts, taking into account clusters of different ages within the ISO-SWS aperture. An evolving starburst with Ne iii/Ne ii=0.064 as in NGC 4945 must have a Lbol/Llyc15 (their Fig. 8). This limit simply reflects the higher Lbol/Llyc of later type O stars and persists if the low excitation is due to an upper mass cut-off rather than evolution. With a lower limit of 15 on (Lbol/Llyc)sb, the starburst contribution to the bolometric luminosity must be at least 50%.
We hence conclude that the AGN in NGC 4945 plays a secondary although most likely not insignificant role in the energetics of this nearby galaxy. Extremely small values for the AGN contribution to the bolometric luminosity would imply an unrealistically high ratio of LX/Lbol for the AGN. The very low inferred black hole mass, the very cold mid-infrared to far-infrared colors, and the absence of any clear line of sight towards the AGN, support our view that starburst activity dominates AGN activity in NGC 4945.
3.4 Emission and absorption features
The infrared spectrum of the central region of NGC 4945 obtained with ISO-PHT-S (see Fig. 2) presents a new view of the ISM in starburst galaxies. Even at the low spectral resolving power of R90 the spectrum is dominated by a wealth of emission and absorption features.
Especially prominent is the family of PAH emission features at 3.3, 6.2, 7.7, 8.6 and 11.3m, which ISO confirmed to be common-place in most galactic and extragalactic ISM spectra (e.g. Acosta-Pulido et al. Acosta96 (1996); Rigopoulou et al. Rigopoulou99 (1999); Mattila et al. Mattila (1999); Clavel et al. Clavel (2000)). Nevertheless, the weakness of the 8.6 and 11.3m PAH bands in NGC 4945 is unusual. Consistent with AV36 and with the strength of the absorption features discussed below, we explain this weakness by heavy extinction, which will suppress these two features placed in the wings of the silicate absorption feature.
Perhaps the most important result, however, is the rich absorption spectrum, indicating that we are observing the infrared sources in the central region of NGC 4945 through a medium containing molecular ices. Interstellar absorptions of 4.27m (2343cm-1) solid CO2 and 4.68–4.67m ‘XCN’+CO are detected, the first time in an extragalactic source to our knowledge. At our resolving power and signal-to-noise we cannot determine the contribution of 4.62m (2165cm-1) XCN, 4.67m (2140cm-1) CO ice and of gaseous CO absorptions to the 4.58–4.67m absorption complex. The strength of the XCN absorption appears to be remarkable, suggestive of ice grain processing in an energetic environment (Lacy et al. Lacy (1984)). We defer a more detailed analysis of the XCN/CO feature to a future paper, which will also include the results of follow-up observations with ISAAC at the VLT. A strong silicate feature is observed around 9.7m (see also Moorwood & Glass Moorwood84 (1984)). A deep minimum is also detected around 3.0m, which is suggestive of water ice (or more precise, the O-H stretch) absorption. Table 3 gives column densities for some of the absorption features discussed above. The presence and strength of these absorption features is consistent with the high starburst obscuration derived from the emission lines (but see also Chiar et al. (Chiar (2000)) for variations in the strength of features along lines of sight of similar AV).
| Species | A | center | N | N/NH | ||||
|---|---|---|---|---|---|---|---|---|
| m | cm/mol. | [mol./cm | ||||||
| NGC 4945 | SgrA∗ | NGC 4945 | SgrA∗ | NGC 4945 | SgrA∗ | |||
| H2O | 3.09 | 210-16a | 0.9 | 0.50b | 2.41018 | 1.31018b | 3.510-5 | 2.310-5 |
| CO2 | 4.27 | 7.410-17c | 0.8d | 0.72e | 2.01017 | 1.71017e | 2.910-6 | 3.010-6 |
| XCN | 4.60 | — | — | — | — | — | — | — |
At the resolution of ISO-PHT-S the molecular absorption features in NGC 4945 show striking similarities with the features seen in the ISO-SWS spectrum of the line of sight towards the Galactic center (Lutz et al. Lutz96 (1996); see Fig. 2). Observations at our spectral resolution do however not permit a detailed comparison. Regarding the 4.26m CO2 feature it is likely that the feature can be attributed to solid state CO2, since high spectral resolution ISO-SWS observations of other sources indicate that the contribution of gaseous CO2 to the observed feature is very small (see in particular van Dishoeck et al. vanDishoeck (1996)). In the 4.6-4.8m region, the spectra of NGC 4945 and the Galactic center differ more strongly, and a more careful inspection is required to assess the contributions of gaseous and solid CO and XCN. ISO-SWS spectroscopy of the Galactic center (Lutz et al. Lutz96 (1996)) clearly shows that what we see at low resolution as a relatively shallow and broad feature is in fact dominated by individual lines of gaseous CO. Contributions of a potential underlying solid CO/XCN component are possible but difficult to separate until our high resolution follow-up observations have been executed.
3.5 Molecular hydrogen: physical conditions, excitation and mass
Near infrared observations of molecular hydrogen emission in NGC 4945 have been reported by several authors over the last 15 years. The most complete set of observations is published by Koornneef & Israel (Koornneef96 (1996)), who observed 8 ro-vibrational transitions with IRSPEC at the ESO NTT. With ISO-SWS and ISO-PHT-S we have extended the number of observed lines from 8 to 14 by observing the pure rotational transitions S(0), S(1), S(2), S(3), S(5) and S(7) as well as the (1-0) Q(3) line. The latter was also observed with IRSPEC and can therefore be used to determine the proper aperture correction factor for the IRSPEC data set. An overview of the observed lines is presented in Table 4.
| Identification | F | Instrument | Aperture | A()b | Aul | Tu | gu | Nu(,J)/g | |
|---|---|---|---|---|---|---|---|---|---|
| m | W/cm | 1/s | K | ||||||
| 0-0 S(0) | 28.2207 | 4.8210-20 | SWS | 2027 | 0.44 | 2.9410-11 | 510 | 5 | 1.271062 |
| 0-0 S(1) | 17.0346 | 1.5110-19 | SWS | 1427 | 0.84 | 4.7610-10 | 1015 | 21 | 5.131060 |
| 0-0 S(2) | 12.2785 | 7.4510-20 | SWS | 1427 | 1.04 | 2.7610-9 | 1682 | 9 | 8.791059 |
| 0-0 S(3) | 9.6649 | 5.4310-20 | PHT-S | 2424 | 2.34 | 9.8410-9 | 2504 | 33 | 1.281059 |
| 0-0 S(5) | 6.9091 | 1.5410-19 | SWS | 1420 | 0.27 | 5.8810-8 | 4587 | 45 | 4.741057 |
| 1-0 Q(1) | 2.4066 | 1.4810-20 | IRSPEC | 66 | 1.72 | 4.2910-7 | 6150 | 9 | 9.691056 |
| 1-0 Q(2) | 2.4134 | 5.110-21 | IRSPEC | 66 | 1.71 | 3.0310-7 | 6471 | 5 | 8.471056 |
| 1-0 S(0) | 2.2235 | 4.410-21 | IRSPEC | 66 | 1.98 | 2.5310-7 | 6471 | 5 | 1.031057 |
| 1-0 Q(3) | 2.4237 | 3.2010-20 | SWS | 1420 | 1.70 | 2.7810-7 | 6951 | 21 | 5.821056 |
| 1-0 Q(3) | 2.4237 | 1.3610-20 | IRSPEC | 66 | 1.70 | 2.7810-7 | 6951 | 21 | 5.821056 |
| 1-0 S(1) | 2.1218 | 1.2910-20 | IRSPEC | 66 | 2.15 | 3.4710-7 | 6951 | 21 | 5.841056 |
| 0-0 S(7) | 5.5103 | 1.1110-19 | SWS | 1420 | 0.40 | 2.0010-7 | 7197 | 57 | 7.131056 |
| 1-0 Q(4) | 2.4375 | 2.210-21 | IRSPEC | 66 | 1.68 | 2.6510-7 | 7584 | 9 | 2.281056 |
| 2-1 S(1) | 2.2477 | 2.310-21 | IRSPEC | 66 | 1.94 | 4.9810-7 | 12550 | 21 | 6.361055 |
| 2-1 S(2) | 2.1542 | 0.610-21 | IRSPEC | 66 | 2.09 | 5.6010-7 | 13150 | 9 | 3.791055 |
-
a
Before aperture correction
-
b
Extinction law ‘A’ & AV=20 (see text)
-
c
After aperture correction (IRSPEC data only) and extinction correction. Adopted distance D=3.9Mpc
Information on the spatial extent of the H2 emitting region is only available for the 2.12m (1-0) S(1) line (Koornneef & Israel Koornneef96 (1996); Moorwood et al. 1996a ; Quillen et al. Quillen (1999); Marconi et al. Marconi (2000)). Based on Fig. 3a of Moorwood et al. (1996a ) we estimate that more than 90% of the (1-0) S(1) emission fits within the smallest ISO-SWS aperture (1420). It is not unreasonable to expect the H2 emitting area to increase with decreasing H2 temperature. The aperture sizes used to observe the respective H2 transitions increase with increasing sensitivity to lower temperature H2. Based on this, we will assume in what follows that ISO-SWS and ISO-PHT-S have observed all available warm H2. Further to this, all three instruments were centered on the same nuclear position and viewed the nuclear region under more or less similar position angles (see Sect. 2). We will use the ratio of the 1-0 Q(3) line fluxes measured by ISO-SWS and IRSPEC to scale the other IRSPEC lines to the ISO-SWS aperture size. This ratio is 2.33.
From the 14 transitions observed it is possible to compute the upper level populations for 12 levels. We assumed the H2 levels to be optically thin. The excitation diagram in Fig. 3 shows a plot of the natural logarithm of the total number of H2 molecules (Nu), divided by the statistical weight (gu), in the upper level of each transition detected, versus the energy of that level (Eu/k). The plot shows the situation after extinction correction (see below).
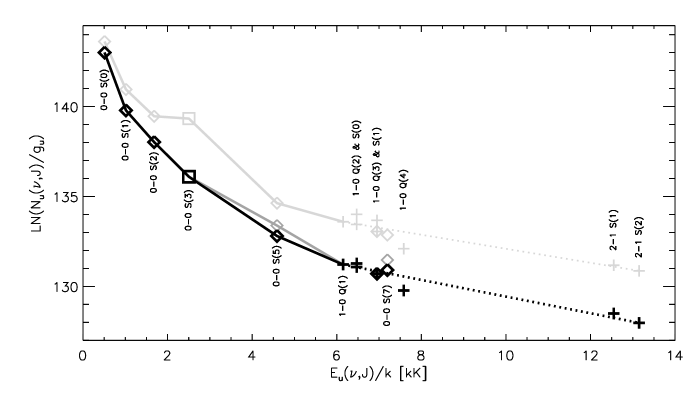
The excitation temperature (Tex) of the gas is the reciprocal of the slope of the excitation diagram. If the warm H2 is in LTE, the excitation temperature directly corresponds to the kinetic temperature. As is clearly visible from Fig. 3, (extinction corrected; see below) the excitation temperature increases monotonically with upper level energy, from 160K for the combination of (0-0) S(0) & S(1) to 2200K for the ro-vibrational lines.
In a highly obscured galaxy like NGC 4945, extinction corrections to the H2 emission will be important. The extinction can be estimated from the H2 data themselves taking into account that any known excitation mechanism should produce a “smooth” excitation diagram for the pure rotational lines, and that transitions originating in a common upper level should give consistent results. More specifically, we use three criteria:
-
•
The excitation temperature should increase monotonically from the lowest to the highest energy levels. This sets limits on the extinction correction for the (0-0) S(3) line in the center of the 9.7m silicate absorption feature.
-
•
The ratio of the (1-0) Q(3) & (1-0) S(1) lines at 2.42 & 2.12m should be its intrinsic ratio determined by molecular constants only. The same applies to the (1-0) Q(2) & (1-0) S(0) lines at 2.41 & 2.22m, that originate from identical upper levels too.
-
•
In LTE, the upper level populations normalized by the statistical weights should be similar for the 0-0 S(7) & 1-0 Q(3) lines at 5.51 & 2.42m, which differ by only 4% in upper level energy.
We have varied the extinction and tried several extinction laws. We present the most applicable extinction laws here:
- •
-
•
Law B: The same as law ‘A’, except for the range =2.6,8.8m, where we took the extinction law as found towards the Galactic center (Lutz Lutz99 (1999)). In the 3-8m range this reddening law constitutes a significantly higher extinction than usually assumed.
From Fig. 3 and the criteria defined above, moderate extinctions of AV=17–23 are clearly preferred. Extinction law A provides a somewhat better fit than extinction law B. None of the 3 solutions gives a good fit to the (1-0) Q(4) data point. In the following analysis, we use the preferrred extinction correction of AV=20 and extinction law A. We note that the extinction to the H2 emitting region is slightly less than that to the starburst regions (Sect. 3.2). This plausibly matches the morphological results of Moorwood et al. (1996a ), who find the starburst in an obscured disk, but the H2 emission extending into a less obscured wind blown cavity.
A rough estimate of the amount of warm molecular hydrogen in the nucleus of NGC 4945 can be derived from the level populations of the pure rotational S(0) and S(1) transitions. The excitation temperature for the upper levels of these transitions (J=2 and J=3) is 160K. Assuming the same excitation conditions for the J=0 and J=1 levels, we compute a warm molecular hydrogen mass of 2.4107M☉. This is 9% of the total H2 gas mass estimated from CO and 0.7% of the dynamical mass interior to the molecular ring (Bergman et al. Bergman (1992); see below).
As already noted, the excitation temperature changes significantly with level energy. This is the consequence of the natural fact that the emitting gas will consist of a mixture of temperatures. The rich NGC 4945 dataset allows us to address this in a more quantitative way. Experiments with fits assuming a number of discrete temperature components lead us to suggest that a power law might give a good representation of the mass distribution as a function of temperature. We obtain a good fit for the following power law: dM/dT=4.431015 T-4.793 M☉/K. The quality of the fit is shown in Fig. 4.
| Temp. range | M(warm H2) | % of total M(H2) |
|---|---|---|
| K | M☉ | |
| 200–10000 | 2.19106 | 0.8% |
| 150–10000 | 6.51106 | 2.4% |
| 120–10000 | 1.52107 | 5.6% |
| 100–10000 | 3.03107 | 11% |
| 90–10000 | 4.52107 | 17% |
| 80–10000 | 7.06107 | 26% |
| 70–10000 | 1.17108 | 43% |
| 60–10000 | 2.10108 | 78% |
| 50–10000 | 4.20108 | 156% |

Table 5 gives warm molecular masses for several low temperature cut-offs. Since H2 gas at temperatures below 70K does not contribute to the (0-0) S(0) flux, nor to any of the other pure rotational lines, we cannot verify whether our power law mass distribution continues down to the lowest temperatures. Nevertheless, we have included mass estimates down to a low temperature cut-off of 50K. This number is reasonable, since we don’t expect the giant molecular clouds (GMCs) to be as cold as in the Galactic disk (10–20K). Rather we expect conditions as found near the Galactic center, where the GMCs are believed to have temperatures exceeding 50K (Armstrong & Barrett Armstrong (1985)).
It is interesting to compare our warm molecular hydrogen gas mass estimate with values found in the literature (see Moorwood & Oliva Moorwood94 (1994) for a review). Bergman et al. (Bergman (1992)), using the inner molecular rotation curve of Whiteoak et al. (Whiteoak (1990)), compute a dynamical mass interior to the molecular ring (R280pc=15.6) of 3.3109M☉. The same authors use CO to derive a total H2 gas mass of 2.7108M☉ for the ring, assuming the rather high kinetic gas temperature of 100K. Note that a low temperature cut-off of the order 50–60K in our H2 temperature distribution would bring our estimate of the total H2 gas mass in agreement with that derived from the low level CO observations. The total H2 gas mass of 2.7108M☉ agrees well with a starburst-like position of NGC 4945 in the LIR–M(H2) diagram (Young & Scoville Young (1991)).
In Table 6 we list for a number of external galaxies and Galactic template sources temperatures and masses of the warm molecular hydrogen gas. With a value of 9%, NGC 4945 has a warm H2 gas fraction similar to that found for most of the other galaxies listed. Note however that the results for NGC 3256, NGC 4038/39 and Arp 220 are less well constrained than for NGC 6946 and NGC 4945: only for the latter two can the temperature of the warm H2 gas be determined from the (0-0) S(0) and S(1) transitions directly. For the same reason a comparison of the H2 gas temperatures is of limited value unless they are derived from identical line combinations. Fairly low temperatures can be derived from the (0-0) S(0) and S(1) lines, 160K and 179K for NGC 4945 and NGC 6946, respectively. Limits for other galaxies listed in Table 6 are consistent with a similarly low temperature. This temperature is well below that observed for an Orion type shock (500K). It is closer to what is observed for the same line combination in PDRs (e.g. Orion Bar: 155K, D. Rosenthal priv. comm.; S140: 159K, Draine & Bertoldi, DraineBertoldi (1999)). While a variety of regions may contribute to the galaxy-integrated temperature distribution, this comparison clearly shows Orion-like shocks to be not representative for the entire emission, and fairly normal PDRs (or less energetic shocks) to be perhaps more typical. If excited by shocks (as suggested by the morphology, Moorwood et al. 1996a ), then the near-infrared H2 emission in NGC 4945 must trace a small subcomponent of faster shocks.
| Object | Type | Ref | Rot. lines observed | T01 | T12 | Trot | Mwarm | % of total H2 |
| K | K | K | M | |||||
| NGC3256 | galaxy | a | S0, S1, S2, S5 | 150a | 109 | 3 | ||
| NGC4038/39 | galaxy | b | S1, S2 | 200a | 5.6107 | 8 | ||
| 405 | 8106 | 1 | ||||||
| NGC4945 | galaxy | S0—S3,S5,S7 | 160 | 2.4107 | 9 | |||
| 380 | 1.2106 | 0.4 | ||||||
| NGC6946 | galaxy | c | S0,S1,S2 | 179b | 5106 | 5–10 | ||
| Arp220 | galaxy | d | S0, S1, S2, S5 | 150a | 3.5109 | 10 | ||
| Orion Bar | PDR | e | S0–S5,S7,S12,S13,S15,S19,S21 | 155 | — | — | ||
| S140 | PDR | f | S0—S5,S7,S9,S13 | 159 | — | — | ||
| Orion Peak 1 | shock | e | S0, S1–S21, S25 | 578 | — | — | ||
| Cepheus A West | shock | g | S1—S5,S7,S9 | 700 | — | — | ||
| Cepheus A East | shock | h | S0, S1–S8,S9,S10,S11 | 740 | — | — |
-
a
assumed; limits are measured for NGC 3256 (K) and Arp 220 (K)
-
b
T01 recomputed from the original (0-0) S(0) & S(1) fluxes
References: a) Rigopoulou et al. (Rigopoulou96 (1996)); b) Kunze et al. (Kunze (1996)); c) Valentijn et al. (1996b ); d) Sturm et al. (Sturm (1996)); e) D. Rosenthal (priv. comm.); f) Draine&Bertoldi (DraineBertoldi (1999)); g) Wright et al. (Wright (1996)); h) van den Ancker et al. (vandenAncker (2000))
4 Conclusions
The main results of this paper can be summarized as follows:
-
•
The nuclear starburst is heavily obscured by 36 mag. of visual extinction, as infered from the 18.7m/33.5m ratio.
-
•
The excitation of the nuclear starburst is very low, as deduced from excitation indicators 15.56m/12.81m and Lbol/Llyc, consistent with an age of at least 5106yrs. Comparison with starburst models implies that at least 50% of the bolometric luminosity is powered by the starburst.
-
•
The very low inferred black hole mass, the very cold mid-infrared to far-infrared colors, and the absence of any free line of sight to the NLR supports the conclusion that the starburst dominates the bolometric luminosity.
-
•
Our mid-infrared ISO spectroscopy does not provide any evidence for the existence of an AGN in the nucleus of NGC 4945. The only high excitation line detected, the 25.9m line, is most likely produced in shocks associated with the nuclear starburst.
-
•
The AGN, detected in hard X-rays, is unusual in not revealing itself at optical, near-infrared and mid-infrared wavelengths. Hence, either the NLR is extremely obscured (A160), or UV photons from the AGN are absorbed close to the nucleus along all lines of sight, or the AGN is deficient in UV relative to its X-ray flux.
-
•
Many ISM solid state and molecular features have been observed with ISO-PHT-S in the 2.4–11.7m range. Most prominent in emission are the PAH features at 3.3, 6.2, 7.7 and 11.2m. The strongest absorption features are those of water ice, CO2 and CO, seen against the nuclear spectrum. These features show striking similarities to the absorption features seen towards the Galactic center.
-
•
We have studied the physical conditions, excitation and mass of warm H2, combining IRSPEC and ISO observations of 14 transitions. We derive a visual extinction of 20 mag. to the H2 emitting region. From the (0-0) S(0)& S(1) lines, we compute a warm (160K) H2 gas mass of 2.4107M⊙, 9% of the total gas mass inferred from CO. The excitation diagram is best fitted by a power law of the form dM/dT=4.431015 T-4.793 M☉/K. The low excitation temperature of 160K shows Orion-like shocks not to be representative for the entire emission, and fairly normal PDRs to be perhaps more typical.
Acknowledgements.
The authors wish to thank Dietmar Kunze and Fred Lahuis for help in the SWS datareduction and Matt Lehnert, Steve Lord and Eckhard Sturm for stimulating discussions.References
- (1) Ables J.G., Forster J.R., Manchester R.N., et al., 1987, MNRAS 226, 157
- (2) Acosta-Pulido J.A., Klaas U., Laureijs R.J., et al., 1996, A&A 315, L121
- (3) Acosta-Pulido J.A., 1999, ISO Explanatory Library, http://www.iso.vilspa.esa.es/users/expl_lib/PHT/chop_re- port02.ps.gz
- (4) Armstrong J.T., Barrett A.H., 1985, ApJS 57, 535
- (5) Bergman P., Aalto S., Black J.H., Rydbeck G., 1992, A&A 265, 403
- (6) Brock D., Joy M., Lester D.F., et al., 1988, ApJ 329, 208
- (7) Chiar J.E., Tielens A.G.G.M., Whittet D.C.B., et al., 2000, ApJ in press (astroph/0002421)
- (8) Clavel J., Schulz B., Altieri B., et al., 2000, A&A in press (astroph/0003298)
- (9) De Graauw Th., Haser L.N., Beintema D.A., et al., 1996, A&A 315, L49
- (10) Draine B.T., 1989, In: Infrared Spectroscopy in Astronomy, B.H. Kaldeich (ed.), ESA-SP 290, 93
- (11) Draine B.T., Bertoldi F., 1999, In: The Universe as seen by ISO, P. Cox, M.F. Kessler (eds.), ESA-SP 427, 553
- (12) Elvis M., Wilkes B., McDowell J.C., et al., 1994, ApJS 95, 1
- (13) Forbes D.A., Norris R.P., 1998, MNRAS 300, 757
- (14) Gabriel C., Acosta-Pulido J., Heinrichsen I., Morris H., Tai W.-M., 1997, In: Proc. of the ADASS VI conference, G. Hunt & H.E. Payne (eds.), ASP Conf. Ser. 125, 108
- (15) Genzel R., Lutz D., Sturm E., et al., 1998, ApJ 498, 579
- (16) Gerakines P.A., Schutte W.A., Greenberg J.M., van Dishoeck E.F., 1995, A&A 296, 810
- (17) Gerakines P.A., Whittet D.C.B., Ehrenfreund P., et al., 1999, ApJ 522, 357
- (18) Greenhill L.J., Moran J.M., Herrnstein J.R., 1997, ApJ 481, L23
- (19) Guainazzi M., Matt G., Brandt W.N., et al., 2000, A&A in press (astroph/0001528)
- (20) Hagen W., Tielens A.G.G.M., 1981, J. Chem. Phys. 75, 4198
- (21) Heckman T.M., Armus L., Miley G.K., 1990, ApJS 74, 833
- (22) Hesser J.E., Harris H.C., van den Bergh S., et al., 1984, ApJ 276, 491
- (23) Iwasawa K., Koyama K., Awaki H., et al., 1993, ApJ 409, 155
- (24) Kessler M.F., Steinz J.A., Anderegg M.E., et al., 1996, A&A 315, L27
- (25) Koornneef J., 1993, ApJ 403, 581
- (26) Koornneef J., Israel P.F., 1996, New Astronomy 1, 271
- (27) Kunze D., Rigopoulou D., Lutz D., et al., 1996, A&A 315, L101
- (28) Lacy J.H., Baas F., Allamandola L.J., 1984, ApJ 276, 533
- (29) Lahuis F., Wieprecht E., Bauer O.H., et al., 1998, In: Astronomical Data Analysis Software and Systems VII, R. Albrecht, R.N. Hook, H.A. Bushouse (eds.), ASP Conf. Ser. 145, 224
- (30) Leitherer C., Heckman T.M., 1995, ApJS 96, 9
- (31) Lemke D., Klaas U., Abolins J., et al., 1996, A&A 315, L64
- (32) Lutz D., 1999, In: The Universe as seen by ISO, P. Cox, M.F. Kessler (eds.), ESA-SP 427, 623
- (33) Lutz D., Feuchtgruber H., Genzel R., et al., 1996, A&A 315, L269
- (34) Lutz D., Kunze D., Spoon H.W.W., et al., 1998, A&A 333, L75
- (35) Marconi A., Maiolino R., Oliva E., et al., 2000, A&A in press (astroph/0002244)
- (36) Matt G., Guainazzi M., Maiolino R., et al., 1999, A&A 341, L39
- (37) Mattila K., Lehtinen K., Lemke D., 1999, A&A 342, 643
- (38) Mauersberger R., Henkel C., Whiteoak J.B., et al., 1996, A&A 309, 705
- (39) Moorwood A.F.M., Glass I.S., 1984, A&A 135, 281
- (40) Moorwood A.F.M., Oliva E., 1988, A&A 203, 278
- (41) Moorwood A.F.M., Oliva E., 1994, ApJ 429, 602
- (42) Moorwood A.F.M.,van der Werf P.P., Kotilainen J.K., et al., 1996a, A&A 308, L1
- (43) Moorwood A.F.M., Lutz D., Oliva E., et al., 1996b, A&A 315, L109
- (44) Oliva E., Moorwood A.F.M., Drapatz S., et al., 1999, A&A 343, 943
- (45) Ott M., 1995, Ph.D. Thesis, Bonn University
- (46) Quillen A.C., Alonso-Herrero A., Rieke M.J., et al., 1999, ApJ 527, 696
- (47) Rice W., Lonsdale C.J., Soifer B.T., et al., 1988, ApJS 68, 91
- (48) Rigopoulou D., Lutz D., Genzel R., et al., 1996, A&A 315, L125
- (49) Rigopoulou D., Spoon H.W.W., Genzel R., et al., 1999, AJ 118, 2625
- (50) Risaliti G., Maiolino R., Salvati M., 1999, ApJ 522, 157
- (51) Roche P.F., Aitken D.K., 1985, MNRAS 215, 425
- (52) Sadler E.M., Slee O.B., Reynolds J.E., Roy A.L., 1995, MNRAS 276, 1373
- (53) Schaeidt S., Morris P.W., Salama A., et al., 1996, A&A 315, L55
- (54) Siebenmorgen R., Moorwood A., Freudling W., et al., 1997, A&A 325, 450
- (55) Sturm E., Lutz D., Genzel R., et al., 1996, A&A 315, L133
- (56) Tayal S.S., Gupta G.P., 1999, ApJ 526, 544
- (57) Thornley M.D., Förster Schreiber N.M., Lutz D., et al., 2000, ApJ in press (astroph/0003334)
- (58) Valentijn E., Feuchtgruber H., Kester D.J.M., et al., 1996, A&A 315, L60
- (59) Valentijn E., Van der Werf P.P., De Graauw Th., et al., 1996, A&A 315, L145
- (60) van den Ancker M.E., Tielens A.G.G.M., Wesselius P.R., 2000, A&A in prep.
- (61) van Dishoeck E.F., Helmich F.P., de Graauw Th., et al., 1996, A&A 315, L349
- (62) Whiteoak J.B., Dahlem M., Wielebinski R., Harnett J.I., 1990, A&A 231, 25
- (63) Wieprecht E., Lahuis F., Bauer O.H., et al., 1998, In: Astronomical Data Analysis Software and Systems VII, R. Albrecht, R.N. Hook, H.A. Bushouse (eds.), ASP Conf. Ser. 145, 279
- (64) Wright C.M., Drapatz S., Timmermann R., et al., 1996, A&A 315, L301
- (65) Young J.S., Scoville N., 1991, ARA&A 29, 581